
Abstract
The aim of this work is to show a proposal for avalanche susceptibility mapping (scale 1:25.000) using Geographic Information Systems (GIS). The map to which the article accompanies (Formigal; Sheet 145-I) follows strictly the dimensions of the Spanish Topographic Cartography series at scale 1:25.000. The Formigal-Peyreget area, located in the Central Spanish and French Pyrenees, is one of the Pyrenean regions where avalanche risk is more noticeable. The methodology involves the use of GIS to model avalanche starting zones, including the multi-criteria cateogorisation of four variables: (i) minimum altitude of the regional isotherm of 0°C for the winter months; (ii) slope; (iii) ground cover; (iv) morphology of the slope (curvature). The information presented in the map classifies avalanche start zones susceptibility into four categories: low, moderate, high and very high. This methodology is intended to be used as a reference for the production of future maps of avalanche susceptibility in other regions where the method is deemed appropriate.
1. Introduction
Among the natural hazards affecting mountain areas, snow avalanches occupy a significant place. Avalanches are very usual during the winter season in the Spanish and French Central Pyrenees (Aragón, Pyrénées-Atlantiques and Hautes-Pyrénées regions), and a considerable amount of research work on theoretical and practical aspects of this geomorphic process has been recently carried out in this area (CitationChueca & Julián, 2004, Citation2010; CitationChueca et al., 2010; CitationJulián & Chueca, 1999, Citation2008, 2012; CitationJulián et al., 2001; CitationLópez, Sarasa, & Oller, 1997; CitationPalomo, 2007; CitationPalomo, Julián, & Chueca, 2008).
The aim of this paper is to show a proposal for avalanche susceptibility mapping (scale 1:25.000) using Geographic Information Systems (GIS). The (Main Map) we have produced (Formigal; Sheet 145-I) follows strictly the dimensions of the Spanish Topographic Cartography series at scale 1:25.000 and covers the Formigal-Peyreget area, which includes parts of the Spanish and French Pyrenees. Due to its altitude, slope and type of land cover, this is one of the Pyrenean regions where avalanche risk is more likely but, so far, lacks a systematic mapping of its avalanche hazard, a fundamental tool in emergency management procedures and as a public utility tool.
Usually, snow avalanche risk assessment methods integrate the delimitation of starting zones, avalanche tracks, and run-out distances as well as their impact (CitationBuisson & Charlier, 1989). The run-out analysis is based in the application of dynamic models (CitationBuisson & Charlier, 1993; CitationCappabianca, Barboloni, & Natale, 2008; Citation Gruber & Sardemann, 2003) and the prediction and spatial delimitation of avalanche susceptibility relies on GIS technology (CitationFurdada et al., 1995; CitationGhinoi & Chung, 2005; CitationPertiziger, 1998; CitationStoffel, Meister, & Schweizer, 1998). Our work is centred in the cartography of the avalanche starting zones susceptibility from which, using additional hillshade modelling and topographic information, is possible to infer avalanche tracks and run-out zones.
2. Study area
The mapped sector is located between 42°45′ and 42°50′ north latitude and 0°21′ and 0°31′ west longitude (). Includes a portion of French land (northern area of the map), located in the Département des Pyrénées-Atlantiques and drained by the upper sections of the Gave de Brousset and Gave de Rébee rivers, which later converge down valley in the main Gave d'Ossau ( and ); and a portion of Spanish territory (central and southern areas of the map) which belongs to the Comunidad Autónoma de Aragón and is drained by the Aragón and Gállego rivers ( and ). The topography of the region is marked, with altitudes between 1190 m a.s.l. in the river Aragón thalweg near Canfranc-Estación and over 2400 m in some of the highest peaks located both in France (Pic de Soques, 2716 m; Pic de Peyreget, 2479 m; Pic de Peyrelue, 2435 m) and Spain (Pico de Anayet, 2574 m; Pico Arroyetas, 2556 m; Vértice de Anayet, 2555 m; Pico Culivillas, 2509 m).
Figure 1. Location map of the study area.
Figure 2. Slopes with high and very high avalanche susceptibility in the Ruisseau de l'Ourade valley (Pico Las Ferraturas-Pic de Peyrelue area) (Photo: J. Chueca).
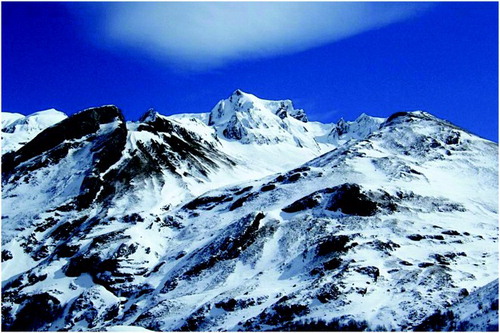
Figure 3. Ruisseau du Pourtalet valley (Cirque d'Anéou area): moderate and high avalanche susceptibility slopes (Photo: J. Chueca).
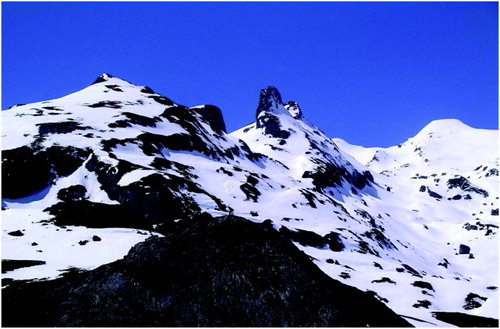
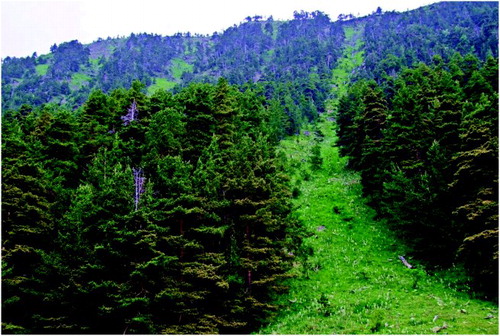
Figure 4. Summer view from the Llanos de Anayet of the slopes of the Vértice de Anayet (left) and Pico de Anayet (right) with reduced avalanche susceptibility due to high slope values (Photo: J. Chueca).
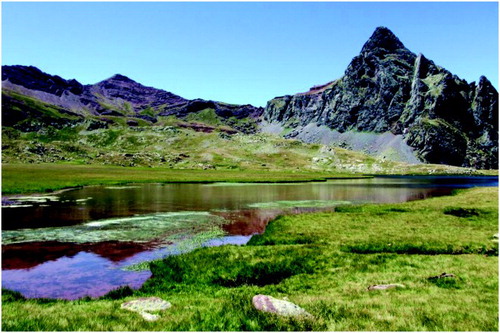
Figure 5. Avalanche paths in the Canal Roya (Canales del Serradero sector) (Photo: J. Chueca).
Geologically, the study area is included in the Axial Pyrenees, represented by Paleozoic lithologies strongly folded that show great structural complexity (CitationBixel, Muller, & Roger, 1985; CitationRíos, Galera, Barettino, & Lanaja, 1989). The diversity of materials, Devonian limestones (Peña Foratata, Pic d'Estremere) and slates (Upper Gállego, Formigal), Carboniferous limestones (Anéou, Portalet, Canfranc-Estación) and greywackes-slates (Astún, Canal Roya), Permian sandstones (Las Arroyeras, Canal de Izas) and the volcanic dikes of Anayet and Midi d'Ossau, provides a considerable geomorphologic variety to the whole sector. All these zones were affected by the Quaternary glaciations that eroded deep U-shaped valleys well visible in the Canal Roya, Canal de Izas or Gave de Brousset. Today, the landscape is being affected by cryonival, mass wasting, karst and fluvio-torrential processes (CitationJulián, Chueca, & Peña, 2000).
The whole area has a humid mountain climate with Atlantic influences (precipitation values of 1318 mm/year in Sallent at 1285 m a.s.l; 1552 mm/year in La Sarra, at 1460 m; 1668 mm/year in Balneario de Panticosa, at 1660 m). Rainfall shows a maximum in winter and a secondary one in autumn, and the main snow precipitation period goes from December to March (Citationde la Riva, 2000).
In the vegetation of the mapped area, herbaceous communities of the alpine and subalpine bioclimatic stages dominate. The traditional exploitation of the forest in both the Spanish and French sectors has reduced the presence of dense forest of beech (Fagus sylvatica), spruce (Abies alba) and Scotch pine (Pinus sylvestris) to isolated patches located in the upper Gave de Brousset valley, Formigal area (La Tosquera), the entrance to Canal Roya and Canal de Izas valleys and the surroundings of Canfranc-Estación. At higher elevations, up to 2300 m, Mountain pine (Pinus uncinata) is present, being the only species tree that is adapted to the low winter temperatures and the significant snow cover (CitationIbarra & Pérez Cabello, 2000).
3. Methods
The area mapped corresponds to one of the sheets at scale 1:25.000 of the Spanish Topographic Cartography series (Formigal; Sheet 145-I). The reference frame used is the European Terrestrial Reference System 1989 (ETRS89), projection Universal Transverse Mercator, Zone 30N.
The methodology adopted is based mainly, with small variations, on the initial modelling and mapping of avalanche start zones hazard made for nearby areas: the Ordesa (CitationJulián & Chueca, 2008, Citation2012), Aguas Limpias (CitationPalomo et al., 2008) and Upper Gállego valleys (CitationChueca & Julián, 2010). The reliability and significance of the model was recently evaluated with good results in the Upper Gállego valley (an area included in the eastern sector of the present Formigal map). For doing so, the Kappa statistic and additional quality measures derived from confusion matrices (sensitivity or general accuracy and associated 95% confidence intervals) were used, comparing the modelled cartographic results with real avalanche data for two test sites: El Portalet-Puerto Viejo de Sallent and Bacarizal-Espelunciecha valleys (CitationChueca & Julián, 2010).
The four variables considered in this work include: (i) Minimum altitude of the regional isotherm of 0°C for the winter months. Marks the theoretical lower limit from which the precipitation is registering as snow and the low temperatures favour its conservation; (ii) Slope. Avalanches originate predominantly in areas with slopes ranging between 25° and 45° (McClung & Schaerer, Citation2006). Below 25° the snowpack remains stable unless unusual weather situations arise leading to extraordinary snowfalls. Above 45° the snow is not well anchored to the ground cover or the underlying mantle and slides, depositing at lower levels; (iii) Ground cover. Terrain roughness depends on this variable, which limits (rough substrates) or favour (non-rough substrates) the start of snow avalanches. In the analysis of this variable, six ground cover categories are considered: forest, open woodland, scrub, grassland, bare rock lithology and urbanized areas; (iv) Morphology of the slope (curvature). The concavity or convexity of slopes respectively favours or hinders the stability of the snow cover (CitationMaggioni & Gruber, 2003).
In order to study these variables we used information from several sources, which were managed in the context of ArcGIS Geographic Information System (v. 10.0): (i) Digital altimetry scale 1:25.000 (Spanish Instituto Geográfico Nacional; BTN25: Base Topográfica Nacional 1:25.000; Sheet 145-I: Formigal). From this altimetry, a Digital Elevation Model (DEM) was obtained by interpolation of contour lines and spot elevations in raster format with a final resolution of 5 m. From the DEM, we derived: a) the cartography of favourable slopes, reclassified in five intervals (<25°, 25°−30°, 30°−40°, 40°−45°, and >45°); and b) the cartography of the longitudinal curvature, reclassified in two categories (convex and plane-concave); (ii) Aerial flight 2009 PNOA (Spanish Plan Nacional de Ortofotografía Aérea), scale 1:5.000 (colour, pixel resolution: 0.5 m). From its photointerpretation, cartography of the ground cover was obtained, identifying the categories related with terrain roughness (forest, open woodland, scrub, grassland, bare rock and urbanized areas). Subsequent field work helped to verify photo interpretations; (iii) The minimum altitude of the regional isotherm of 0°C for the winter months was obtained from Citationde la Riva (2000), who analysed the climatology of the study area (December: 1917 m; January: 1663 m; February, 1611 m; March: 1850 m). In order to obtain the cartography of favourable altitudes from the DEM we used as a reference the lowest altitude value, corresponding to the month of February.
A multi-criteria analysis was applied, considering the aforementioned criteria (favourable altitude, slope, ground cover and curvature) to produce the map of avalanche start zones susceptibility. Additionally, in order to refine the results, we applied weights to the categories or intervals defined for each of the variables, following the methodology already used in previous studies (CitationChueca & Julián, 2010; CitationJulián & Chueca, 2008, Citation2012; CitationPalomo et al., 2008) (). The multi-criteria analysis yielded susceptibility values to the triggering of avalanches between 0.5 and 3.3. From this, and selecting homogeneous intervals, the four categories we finally adopted for our (Main Map) were: low susceptibility (values between 0.5 and 1.2), moderate susceptibility (values between 1.2 and 1.9), high susceptibility (values between 1.9 and 2.6) and very high susceptibility (values between 2.6 and 3.2).
Table 1. Weights applied to the intervals defined for each of the variables used in the multicriteria analysis.
A hillshade model, elaborated from the DEM (azimuth: 315°; altitude: 45°), was used as a background for the cartography, which was also covered by a 1 km UTM gridline and additional geographic coordinates. The information shown on the (Main Map) was structured in four main sections: (i) Avalanche start zones susceptibility: This section, in which a standard colour symbology for hazard and risk cartography is used, includes the four categories of avalanche start zones susceptibility already defined (low, moderate, high and very high); (ii) Hydrological elements: This part of the legend includes items related to the river system: rivers, streams and mountain lakes; (iii) Topographic elements: This section covers the trigonometrical points present in the study area and some of the most significant spot elevations. Contour intervals were also mapped with an equidistance of 50 m; (iv) Anthropogenic elements: A considerable amount of elements of anthropogenic and cultural origin are present in the mapped area: (a) Roads (Spanish N-330 and A-136; French D-934) and tunnels, paths and trails; (b) Railways and railway tunnels; (c) Country boundaries and municipal limits (in this case, only in the Spanish section of the map); (d) Buildings, parking areas, ski lifts, reservoirs and dams. Finally, the included toponymy provides textual information about many of the hydrological, topographic and anthropic features mapped in the Formigal Sheet. Hydrological, topographic and anthropic elements were obtained from the Spanish Instituto Geográfico Nacional (BTN25: Base Topográfica Nacional 1:25.000; Sheet 145-I: Formigal).
4. Conclusions
The mapping of avalanche susceptibility is a fundamental tool in emergency management procedures and as a public utility tool in mountain regions. So far, the Formigal-Peyreget area lacks a systematic cartography of its avalanche hazard, a geomorphological process strongly active in the sector during the winter season. In this work, we have presented a proposal for the elaboration of this kind of cartography, at 1:25.000 scale, using automatic procedures integrated in the context of a Geographic Information System.
In addition to very accurately locate the avalanche start zones susceptibility, the hillshade model and the topographic elements included in the map allow an adequate estimation of possible avalanche paths and avalanche run-out sectors, even if these areas are not explicitly mapped. The inclusion of the main elements of anthropic and cultural origin (roads, buildings, infrastructures, etc.) helps to identify sectors where avalanche risk could be noticeable, providing information useful in the management and planning of an area frequently visited during the winter months because of its importance as a tourism and ski resort.
Software
The information used to carry out this work was integrated into the Geographical Information System ArcGIS (v. 10.0) from which analysis of data and derived cartographies were obtained. The final design of the cartography we have presented here was also made using the layout module of the ArcGIS software.
Main Map: Formigal: Avalanche Susceptibility Map
Download PDF (12.4 MB)Acknowledgments
The authors acknowledge M. Ferentinou, C. Chalkias, J. Abraham and C. Orton for reviewing the manuscript and the map and making helpful suggestions to improve them.
Related Research Data
References
- Bixel, F., Muller, J., & Roger, P. (1985). Carte geologique Pic du Midi D'Ossau et haut basin du rio Gallego, 1:25.000. Bordeaux: Institut de Géodynamique Université de Bordeaux.
- Buisson, L., & Charlier, C. (1989). Avalanche starting-zone analysis by use of a knowledge-based system. Annals of Glaciology, 13, 27–30.
- Buisson, L., & Charlier, C. (1993). Avalanche modelling and integration of expert knowledge in the ELSA system. Annals of Glaciology, 18, 123–128.
- Cappabianca, F., Barboloni, M., & Natale, L. (2008). Snow avalanche risk assessment and mapping: A new method based on a combination of statistical analysis, avalanche dynamics simulation and empirically-based vulnerability relations integrated in a GIS platform. Cold Regions Science and Technology, 54(3), 193–205. doi: 10.1016/j.coldregions.2008.06.005
- Chueca, J., & Julián, A. (2004). Caracterización y tipología de canales de aludes en el valle de Ordesa (Pirineo central español). Bol. R. Soc. Esp. Hist. Nat. (Sec. Geol.), 99(1–4), 93–103.
- Chueca, J., & Julián, A. (2010). Cartografía de zonas probables de salida de aludes en el Alto Gállego (Pirineo central aragonés) mediante el empleo de Sistemas de Información Geográfica. Cuadernos de Investigación Geográfica, 36(1), 27–41.
- Chueca, J., Julián, A., Palomo, M., Muntán, E., Oller, P., Barriendos, M., & Gutiérrez, E. (2010). Factores geomorfológicos y nivometeorológicos condicionantes de aludes en el circo de Musales (Pirineo central aragonés): el evento de abril de 2008. In J. J. Blanco, M. A. de Pablo, & M. Ramos (Eds.), Ambientes periglaciares, permafrost y variabilidad climática (pp. 47–54). Universidad de Alcalá, Servicio de Publicaciones.
- De la Riva, J. (2000). Caracterización climática del alto valle de Tena. Boletín Glaciológico Aragonés, 1, 81–109.
- Furdada, G., Martí, G., Oller, P., García, C., Mases, M., & Vilaplana, J. M. (1995). Avalanche mapping and related GIS applications in the Catalan Pyrenees. Surveys in Geophysics, 16(5–6), 681–693. doi: 10.1007/BF00665748
- Ghinoi, A., & Chung, C. J. (2005). STARTER: A statistical GIS-based model for the prediction of snow avalanche susceptibility using terrain features. Application to Alta Val Badia, Italian Dolomites. Geomorphology, 66(1–4), 305–325. doi: 10.1016/j.geomorph.2004.09.018
- Gruber, U., & Sardemann, S. (2003). High-frequency avalanches: Release area characteristics and run-out distances. Cold Regions Science and Technology, 37(3), 439–451. doi: 10.1016/S0165-232X(03)00083-1
- Ibarra, P., & Pérez Cabello, F. (2000). La vegetación del alto valle de Tena. Boletín Glaciológico Aragonés, 1, 127–149.
- Julián, A., & Chueca, J. (1999). Cartografía de zonas probables de aludes en el valle de Ordesa (Pirineo aragonés). Geographicalia, 37, 73–86.
- Julián, A., & Chueca, J. (2008). Cartografía de zonas de salida de aludes en el valle de Ordesa (Pirineo central español): factores condicionantes y evolución temporal. In J. Benavente, & F. J. Gracia (Eds.), Trabajos de Geomorfología en España, 2006-2008 (pp. 413–416). Cádiz: SEG.
- Julián, A., & Chueca, J. (2012). Mapping of avalanche start zones susceptibility: Arazas basin, Ordesa and Monte Perdido National Park (Spanish Pyrenees). Journal of Maps, 8(1), 14–21. doi: 10.1080/17445647.2012.668414
- Julián, A., Chueca, J., & Peña, J. L. (2000). El relieve del Alto Gállego (Pirineo aragonés). Boletín Glaciológico Aragonés, 1, 45–79.
- Julián, A., Peña, J. L., Chueca, J., Zabalza, J., Lapeña, A., & López Moreno, J. I. (2001). Cartografía de zonas probables de aludes en el Pirineo aragonés: metodología y resultados. Boletín de la A.G.E., 30, 119–134.
- López, R., Sarasa, A., & Oller, P. (1997). Caracterización, simulación y prevención de aludes en el barranco de Secras. Túnel de Somport (Huesca). IV Simposio Nacional sobre taludes y laderas inestables, Granada, 703–717.
- Maggioni, M., & Gruber, U. (2003). The influence of topographic parameters on avalanche release dimension and frequency. Cold Regions Science and Technology, 37(3), 407–419. doi: 10.1016/S0165-232X(03)00080-6
- McClung, D., & Schaerer, P. (2006). The avalanche handbook. Seattle: The Mountaineers Books.
- Palomo, M. (2007). Los aludes en el Circo de Piedrafita (Pirineo aragonés): el evento del 8 de febrero de 1996. Boletín Glaciológico Aragonés, 8, 61–83.
- Palomo, M., Julián, A., & Chueca, J. (2008). Aplicación de un análisis multicriterio a la delimitación de zonas probables de aludes (valle del Aguas Limpias, Pirineo central español). In J. Benavente, & F. J. Gracia (Eds.), Trabajos de Geomorfología en España, 2006-2008 (pp. 417–420). Cádiz: SEG.
- Pertiziger, F. (1998). Using of SIG technology for avalanche hazard mapping, scale 10.000. Publikasjon Norges Geotekniske Institutt, 203, 210–214.
- Ríos, L. M., Galera, J. M., Barettino, D., & Lanaja, J. M. (1989). Memoria del Mapa Geológico de España, escala 1:50.000, Hoja 145, Sallent. Madrid: Instituto Geológico y Minero de España.
- Stoffel, A., Meister, R., & Schweizer, J. (1998). Spatial characteristics of avalanche activity in an Alpine valley. A GIS approach. Annals of Glaciology, 26, 329–336.