
Abstract
There is value in being able to automatically measure and visualise the visual exposure of city sites (monuments and buildings, tourist sites) – for example, in urban planning, as an aid to automated way finding, or in augmented reality city guides. Here we present the outputs of an algorithm able to calculate visual exposure – both as an absolute measure of the façade area and in terms of a building's perceived size (its lesser importance with distance). Both metrics influence the photogenic nature of a site. We therefore compared against maps showing the locations from where geo-located Flickr images were taken. The results accord with the metrics and therefore help disambiguate the meaning of Flickr tags.
1. Introduction
Typically, a city is richly composed of office blocks, museums, galleries, public spaces, monuments, and residential buildings. Its varied topography and streets offer ever-changing panoramas. Much research has been devoted to measuring the prominence and visibility of a city's many landmarks and places of interest, both from an urban morphology perspective and as a basis for selecting content for wayfinding applications (CitationDuckham, Winter, & Robinson, 2010; CitationElias, 2003; CitationRichter & Winter, 2014; CitationSorrows & Hirtle, 1999). It is acknowledged that various factors affect how people perceive the prominence of buildings and monuments in the landscape, and how this collectively affects their sense of place. In this research, we report on attempts to visualise the visual exposure of a range of popular tourist sites, including a castle, a narrow street, open gardens, and various museums. We compare these visualisations with maps showing the locations of where photographs were taken from the equivalent site. Edinburgh (Scotland) was chosen as a test case because it is a visually interesting city built upon a varied topography, occupied by many grand buildings and monuments. It is divided into an Old Town and a New Town, separated by a large public park (Princes Street Gardens) in a shallow valley and the city's main railway station. The openness of the park provides vistas of the old and new towns. Alongside is a large castle built upon a plug of an extinct volcano, which demands visual attention due to its dominance on the skyline. The paper begins with an overview of the visual exposure model, then presents the mapped results of running this model for a selection of popular sites, and concludes with a comparison against photograph locations based on geotagged Flickr imagery (www.flickr.com).
2. Method
There have been numerous previous studies on urban visibility. Until recently, these have tended to use the two-dimensional boundaries of buildings to calculate isovists (CitationBenedikt, 1979; CitationTandy, 1967; CitationTurner, Doxa, O'Sullivan, & Penn, 2001), but now Digital Surface Models (DSMs) (generated from Light Detection and Ranging (LiDAR) data) include surface feature elevation at fine levels of detail and therefore provide a much richer basis for urban visibility modelling (CitationBartie & Mackaness, 2006; CitationPalmer & Shan, 2002; CitationRottensteiner & Briese, 2002). The idea of modelling visual exposure was proposed by CitationLlobera (2003) and is defined as a measure of the field of view occupied by an object in the user's view. The value changes as the user moves around a space depending on the viewing distance and angle, and occlusion of the designated target object. This differs from a viewshed in that the value returned from a visual exposure calculation reflects the amount of a defined target seen from that location, rather than the extent of surrounding space which is visible.
In the model presented here, we calculated two metrics which are the amount of a building visible (façade area) and the perceived area (which factors in the viewing distance) (CitationBartie, Reitsma, Kingham, & Mills, 2010). The reason for the two metrics is that on some occasions you can view more of a target building, or site, from a greater distance than close-up. In these cases, although the target object is further away, it has a greater photographic appeal, which is reflected by the façade area metric. The visibility model did not consider cognitive issues such as size consistency (CitationBoring, 1964), or the ease with which a feature may be identified against background objects (CitationSorrows & Hirtle, 1999; CitationWinter, 2003).
LiDAR data were used to create a DSM and Digital Terrain Model. These data were georeferenced to the corresponding OS Master Map (CitationOS, 2014) data using the British National Grid coordinate system, and processed to ensure that any vehicles present in the data capture were removed from the road surface. This was necessary to reduce the occurrence of target occlusion from temporary moveable surface objects. The process was automated by using the OS Master Map road polygons to define the road regions in the surface models, and by running a kernel function across the terrain model to identify the regions of steep slope which would not be expected on roads. These regions were then replaced with interpolated values from the surrounding terrain model. The visual exposure was calculated by modelling the lines-of-sight from a location in the study region to all of the cells in the 1 metre resolution DSM.
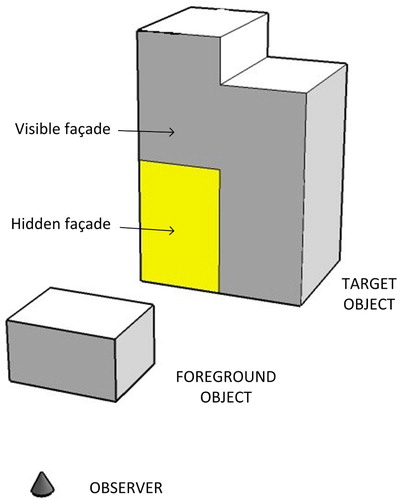
The total visual exposure for each OS Master Map polygon was calculated by summing the model output for all cells within the defined polygon boundary. Two metrics were calculated: the total façade area visible and the perceived area. The total façade area does not vary with distance, but is a measure of the total frontage surface area that is visible from an observer location (). The perceived area is based on this figure but includes a distance squared decay factor, so that objects at greater distances are given a lower score to model the reduced coverage on the viewer's retina (CitationSchlosberg, 1950).
Figure 1. Visible and obscured regions of a target object.
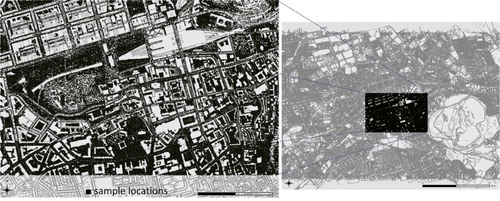
The visual exposures for all OS Master Map polygons were calculated from 75,000 locations within the study region. This was done to reduce the computation time, yet provide a dense coverage across the study region. The sample locations were randomly chosen from the pedestrian-accessible areas, defined as the outdoor places a pedestrian could access including roads, pavements, and open spaces but not roof tops, water bodies, or rail regions. As the visual exposure is a measure of how much of the city, including vertical aspects of buildings, can be seen from a given location it was important to extend the spatial data sets (e.g. DSM, OS Master Map) beyond the study area. The 75,000 sample locations in the defined study region and the full extent of the data sets used in the calculations are shown in .
Figure 2. The large scale map (left) shows the 75,000 sample locations selected at random from pedestrian-accessible regions in the study area. The map on the right shows the extent of the data sets included in each calculation, since visual exposure is a measure of objects in view from the surrounding region.
3. Results
The visual exposure for all objects can then be summed for each location within the city to produce a cumulative visual exposure map (). This differs from other cumulative maps in that it is the summation of exposure maps which include vertical extents of objects (façade area), rather than just a count of the number of times a cell is visible. This means that it not only reflects the horizontal expanse in view, but also the vertical extent of objects which can be seen, so that a location alongside a tall building may result in a similar cumulative visual exposure score to one near a courtyard.
Figure 3. Cumulative visual exposure across Edinburgh, using the façade area metric.
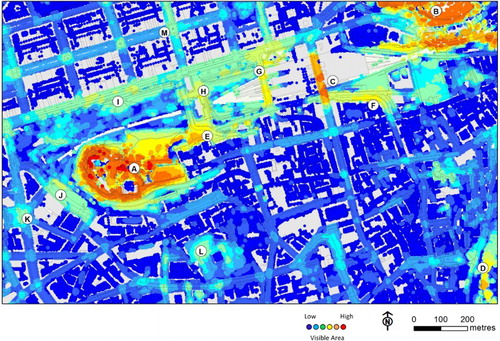
The highest visual exposures for the city are from Edinburgh Castle (A) and Calton Hill (B), meaning these locations offer the greatest combined view of city objects. The south side of North Bridge (C) is also a good photo location as it has open views to the east and west and clear views of Waverley train station, Princes Street Gardens, and the more distant Holyrood Park which includes Arthur's Seat and the Crags (D) to the south east. Views from the Crags (D) themselves are extensive to the west, but blocked by the cliff face to the east. The Mound (E) is a street on a hill with a northerly outlook and has clear views of the Princes Street Gardens and the Royal Scottish Academy (H). Cranston Street (F) offers exposed views north across the city council building, the eastern part of Waverley train station, North Bridge (C), and Calton Hill (B). Waverley Bridge (G) is a road which runs through a shallow valley and therefore has reduced views compared to the higher bridge crossing at (C). The Royal Scottish Academy (H), Castle Terrace (J) and Usher Hall (K), and the open playgrounds of George Heriot School (L) exhibit similar scores. Princes Street Gardens (I) has not only some good views, but also regions of limited view due to the tree canopy obscuring more distant objects. It is worth noting the increase in cumulative visual exposure at junctions where the views open up to see a greater number of city objects. This is particularly noticeable along George Street (M), which may, in part, be due to the statues at the centre.
3.1. Mapping visual exposure for sites
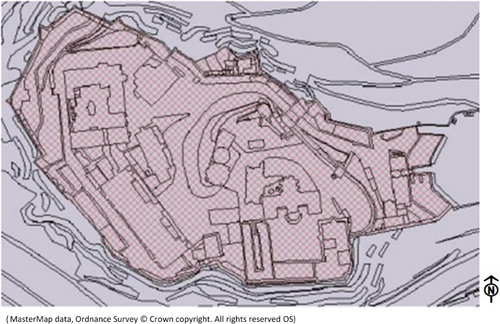
The OS Master Map polygons represent the smallest identifiable units from aerial imagery, such as individual buildings, parks, and road regions. However, people sometimes refer to entities (or ‘sites’) which consist of many of these polygons. For example, Edinburgh Castle consists of 326 polygons (), but is typically considered as a single entity. It is possible that any polygon can be the member of a number of sites. For example, polygons that contribute to the Edinburgh Castle site are also considered as part of the Old Town.
Figure 4. The 326 polygons comprising the Edinburgh Castle site.
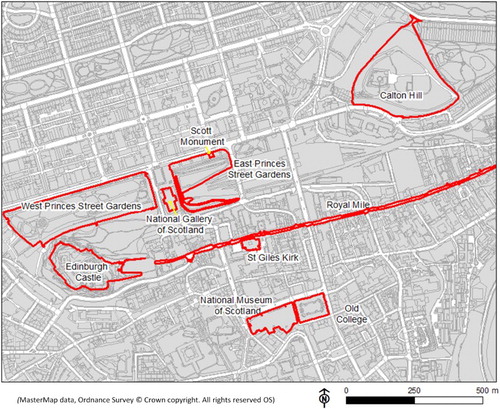
To reflect this view of the city, polygons were grouped according to a site, for a number of popular tourist sites in Edinburgh (). The sites selected ranged from large natural features (e.g. West Princes Street Gardens), to large buildings (e.g. National Museum of Scotland), to roads (e.g. The Royal Mile), to a tall tower with a small footprint (e.g. Scott Monument). The visual exposure was then calculated for each of these sites.
Figure 5. Grouping of polygons according to some popular tourist sites.
The Main Map associated with this article is a visual magnitude map (VMM) and shows the façade area and perceived area maps for six of the sites (Calton Hill, St Giles Cathedral, Scott Monument, The Royal Mile, Edinburgh Castle, and Princes Street Gardens). The third column of the VMM is based on a frequency count of the location from which Flickr images were taken of that particular site. Previous research reveals ambiguity in how Flickr images are located and tagged. To reduce these errors, a filtering process was carried out whereby the set of tags for each geotagged image were compared against all other tags from images within 50 metres. The tag comparison was performed using trigrams allowing for fuzzy string matching which ignored minor spelling mistakes, stop words (e.g. of, the), and word order (e.g. National Art Gallery, National Gallery of Art). The most popular tag by unique user count was considered as the main tag for each image. The more common items which occur across the map were ignored, such as ‘Edinburgh’, ‘Scotland’, ‘Nikon’, ‘2011’ using a tf-idf approach (CitationMackaness & Chaudhry, 2013). Once the main tag had been determined for each image, it was possible to filter out those tags which were only used by a few users, to leave the more robust Flickr image locations.
There are some interesting things to note when studying the VMM. Calton Hill was identified earlier as a place which offered good views of the city ( site B). It is noticeable from the façade map that the majority of regions that can see Calton Hill have a good view of it (shown in red), with some of the best regions being North Bridge ( site C), Edinburgh Castle ( site A), and the Crags ( site D). The perceived area map gives an indication of how large the site is in the field of view, considering the viewing distance. This correlates fairly well to the top Flickr tags, notably on Calton Hill itself, but also the more distance vantage points of Edinburgh Castle, and North Bridge.
St Giles Cathedral is a visually exciting building with a crown steeple, situated on the popular Royal Mile. It attracts a lot of attention as can be seen by the density of the Flickr images. However, due to the narrow streets and surrounding buildings, it has a fairly limited visual impact. There are some locations from within Edinburgh Castle that can see a high façade area, and indeed this has been taken advantage of by Flickr photographers. There are also Flickr images from the National Museum of Scotland (see for location), which were not identified in the visual exposure output. This is because the visibility model was only run from an observer at street level, while the National Museum has roof top access from which the Cathedral is visible.
Scott Monument is a tall gothic looking structure on the busy Princes Street shopping area. This area is fairly open to the south where Princes Street Gardens is located, and this shows up in the exposure maps which extend a long way south of the site across the valley to the opposite hill. It is not a very large object so although it is recognisable from many locations, it does not occupy a large part of the field of view. As it is a tall structure and is situated in an open region, it has a fairly consistent façade area region (shown in green).
The Royal Mile (fourth row in the VMM) is the commonly used name for the High Street which is a tourist favourite. It is long thin cobbled street and only really visible from within the street itself. Although it can be seen from the connecting road network, the main region for photographing it is on the actual street itself.
Edinburgh Castle is a magnificent site on top of a volcanic plug, overlooking the city. It is obvious from the visual exposure maps that this site can be viewed from much of the study region, and often a large portion of the site is visible. This is evident in the widespread locations of Flickr imagery including distant photo locations such as the North Bridge at 800 metres from the castle, and Calton Hill at just over 1 km. The exposure model and perceived area map both confirm these are sites which offer good views of Edinburgh Castle. It is also evident from the façade model output that the views from inside the Castle are often more limited, and there is even a gradient in the amount of the site visible (as can be seen on the esplanade to the East of the Castle). This occurs because inside the site some of the buildings occlude the view of the rest of the site, while in other places the open regions allow for much better views of the site itself. The model fails to show the good views from the roof top of the National Museum (since roof space was not modelled), indicated in the Flickr imagery map.
Princes Street Gardens is situated in the valley between the Old and New town, and is mainly visible from within the garden or the Castle. The south side of the gardens is on a steep slope and has had restricted access due to landslides, and closed paths which may have contributed to the lower count of photographs from this region.
4. Conclusion
Though qualitative in nature, the visual exposure maps and location of photographs make interesting comparison. Neither the façade area exposure nor the perceived area exposure metric alone can justify the photograph locations. However, jointly the two exposure maps can account for the majority of photograph locations for each target, where either the target is very dominant in a scene (high perceived area), or the extent of the target visible is high (high façade area) even if the object is at a greater distance. Good examples of this include the Edinburgh Castle where photographs are taken in the red zones of the façade area maps, even at great distances from the object. Currently, researchers have to deal with uncertainty in Flickr geotags – where it is unclear whether the location given is of the object photographed or the actual location of the photographer. Using the approach presented here, it is possible to discern the difference between the two. We argue that such visualisations have broader application in terms of modelling the visibility of the city and lend themselves to measures of city aesthetics.
Software
A Custom C#.NET application was developed for modelling visual exposure, with PostgreSQL (with PostGIS) and Quantum GIS used for data storage and analysis. The final map production was undertaken in Esri ArcGIS and Microsoft Visio for the final map layout of the OS Master Map.
Visual Exposure and Flickr photo locations for Selected Sites in Edinburgh (Scotland)
Download PDF (2.8 MB)Additional information
Funding
Related Research Data
References
- Bartie, P., & Mackaness, W. A. (2006). Development of a speech-based augmented reality system to support exploration of cityscape. Transactions in GIS, 10, 63–86. doi: 10.1111/j.1467-9671.2006.00244.x
- Bartie, P., Reitsma, F., Kingham, S., & Mills, S. (2010). Advancing visibility modelling algorithms for urban environments. Computers Environment and Urban Systems, 34, 518–531. doi: 10.1016/j.compenvurbsys.2010.06.002
- Benedikt, M. L. (1979). To take hold of space: Isovists and isovist fields. Environment and Planning, B: Planning and Design, 6, 47–65. doi: 10.1068/b060047
- Boring, E. (1964). Size constancy in a picture. American Journal of Psychology, 77, 494–498. doi: 10.2307/1421027
- Duckham, M., Winter, S., & Robinson, M. (2010). Including landmarks in routing instructions. Journal of Location-based Services, 4, 28–52. doi: 10.1080/17489721003785602
- Elias, B. (2003). Determination of landmarks and reliability criteria for landmarks. 5th Workshop on Progress in Automated Map Generalization, Paris, France.
- Llobera, M. (2003). Extending GIS-based visual analysis: The concept of visualscapes. International Journal of Geographical Information Science, 17, 25–48. doi: 10.1080/713811741
- Mackaness, W. A., & Chaudhry, O. (2013). Assessing the veracity of methods for extracting place semantics from Flickr tags. Transactions in GIS, 17, 544–562. doi: 10.1111/tgis.12043
- OS. (2014). OS master map. Retrieved October 4, 2014 from http://www.ordnancesurvey.co.uk/business-and-government/products/mastermap-products.html
- Palmer, T. C., & Shan, J. A. (2002). Comparative study on urban visualization using LIDAR data in GIS. URISA Journal, 14, 19–25.
- Richter, K.-F., & Winter, S. (2014). Landmarks: GIScience for intelligent services. Cham: Springer.
- Rottensteiner, F., & Briese, C. (2002). A new method for building extraction in urban areas from high-resolution LiDAR data. International Archives of Photogrammetry and Remote Sensing and Spatial Information Sciences, 34, 295–301.
- Schlosberg, H. (1950). A note on depth perception, size constancy, and related topics. Psychological Review, 57, 314–317. doi: 10.1037/h0062971
- Sorrows, M., & Hirtle, S. (1999). The nature of landmarks for real and electronic spaces. In C. Freksa & D. Mark (Eds.), Spatial information theory (pp. 37–50). Stade: Springer.
- Tandy, C. R. V. (1967). The isovist method of landscape survey. In A. Murray (Ed.), Symposium: Methods of landscape analysis (pp. 9–10). London: Landscape Research Group.
- Turner, A., Doxa, M., O'Sullivan, D., & Penn, A. (2001). From isovists to visibility graphs: A methodology for the analysis of architectural space. Environment and Planning B: Planning and Design, 28, 103–121. doi: 10.1068/b2684
- Winter, S. (2003). Route adaptive selection of salient features. In W. Kuhn, M. F. Worboys, & S. Timpf (Eds.), Spatial information theory (pp. 320–334). Berlin: Springer.