
Abstract
Glaciers are widely recognized as the best terrestrial indicators of climate change. Nevertheless, changes that have occurred since the end of the Little Ice Age (LIA) are often poorly understood. In Italy, glacier front variations in the last 100 years have been well documented, thanks to the efforts of the Italian Glaciological Committee (Comitato Glaciologico Italiano, CGI), which coordinates annual surveys on all glaciers, since 1927, in order to measure their front positions. However, although front variations are the easiest measurements to take in the field, they only partially describe changes that occur on the entire glacial mass. Moreover, the last national glacier inventory dates back to 1957–1958, which was promoted by the CGI on the occasion of the International Geophysical Year. Authors of the present work herein provide an updated inventory of present-day (2006) glaciers in the Western and South-Western Piedmont Alps (situated in the provinces of Turin and Cuneo). Along with the present-day glacial outlines, the map also includes a reconstruction of the extent of the glaciers during the Little Ice Age, inferred from morphological features such as LIA and post-LIA moraine ridges as well as the aid of historical archive data. Some basic glacier morphometric parameters (surface, length, width, mean slope, highest and lowest altitude, exposure) were computed for the two specified time periods (LIA and 2006). This study was carried out under the framework of the project ‘GlaRiskAlp – Glacial Risks in Western Alps’, project n.° 56 under the 2007–2013 ALCoTra programs.
1. Introduction
In the European Alps, glacier extent has dramatically changed since the end of the Little Ice Age (LIA) (around 1865; CitationPainter et al., 2013), with an overall decrease in ice coverage of about 50% (CitationZemp, Paul, Hoelzle, & Haeberli, 2008). Due to the specific physiographic and geographic settings, glacier shrinkage has been as much as 80% in the Western and South-Western Piedmont Alps, which are the focus of the current study (CitationFioraso, Bertotto, Lucchesi, Nigrelli, & Chiarle, 2013). The change in glacier extent is one of the most direct and easily recognizable terrestrial indicators of climate change (CitationHoughton et al., 2001). At the same time, the distribution and extent of present-day glaciers are relevant to a number of economic activities, such as tourism (CitationOrlove, 2009), freshwater resources and their management (in particular hydropower production; CitationKaser, Großhauser, & Marzeion, 2010; CitationVergara et al., 2007), along with agriculture (CitationBury et al., 2011). The location, extent and characteristics of recently deglaciated areas also have important consequences on catchment sediment budgets (CitationKoppes & Hallet, 2002; CitationStott & Mount, 2007), as well as on the initiation of instability processes such as debris and mud flows, which may also pose hazards to areas located much further downstream (CitationChiarle, Geertsema, Mortara, & Clague, 2011; CitationHolm, Bovis, & Jakob, 2004). In spite of these important implications, accurate maps of current and past glacier outlines are only available for a few areas of the Italian Alps (CitationBonardi et al., 2012), as the latest, nationwide and uniform cartographic data dates back to 1957–1958 (CitationComitato Glaciologico Italiano – Consiglio Nazionale delle Ricerche, 1961). In recent years, the GLIMS (Global Land Ice Measurements from Space) project has attempted to overcome the lack or inconsistency of worldwide data on glacier outlines by using images derived from optical satellite instruments, such as ASTER (CitationRaup et al., 2006). However, many Italian glaciers, such as those included in the Western and South-Western Piedmont Alps, cannot easily be detected on satellite images due to their size (58% of glaciers have an area less than 0.1 km2) and because they are often extensively covered by debris.
This contribution aims to partially fill this gap by providing an updated inventory of present-day glaciers of the Western and South-Western Piedmont Alps, and includes a reconstruction of the glacier extent at the peak of the LIA (around 1850).
The investigations were carried out under the framework of the GlaRiskAlp (Glacial Risks in Western Alps) project n.° 56 under the 2007–2013 ALCoTra (Alpi Latine Cooperazione Transfrontiera, Franco-Italian Transborder Alpine Cooperation) program (www.glariskalp.eu), as part of the activities of ‘Action 1A’, devoted to the localization and quantification of glaciated and post-LIA deglaciated terrains as potential sources of geohazards.
2. Geomorphological setting
The Western and South-Western Piedmont Alps are located at the South-Western end of the European Alps, which are part of the Alpine-Himalayan belt extending from South-Western Europe to Asia. This belt developed from the Cretaceous onwards by subduction of a Mesozoic ocean, and the subsequent collision between European and Adriatic continental margins (CitationDal Piaz, Bistacchi, & Massironi, 2003). The European Alps, about 1300 km long, are characterized by an arched shape, and are generally divided into Western, Central, and Eastern Alps, based on their orography. The Western Alps comprise peaks of different altitude, stretching from the Argentera Massif (Cima Sud dell'Argentera, 3297 m), which is just a few kilometers from the Mediterranean sea, to the Mont Blanc (4810 m). Italian glaciers are located on the Southern flank of the Alps, mainly in the Western and Central Alps, and the Italian Alps tend to have far fewer and smaller glaciers than the Northern and North-Western sides, due to exposure. Moreover, most Italian glaciers are situated at high elevations, but other factors, such as local climatic conditions (CitationFaletto, Prola, Acquaotta, Fratianni, & Terzago, 2013), related to the source and propagation of humid maritime air, also influence their size and distribution (CitationCalmanti, Motta, Turco, & Provenzale, 2007).
In the study area, the minimum altitude of present-day glaciers is reached by the snout of the Capra Glacier (2430 m), while the maximum altitude is attained by the Colle dell'Ape Glacier (3865 m). During the LIA, Italian glaciers reached a smaller extent compared to the other glaciers of the Western Alps, and at the end of the LIA underwent a more pronounced withdrawal. This was due to (i) the low mean altitude and latitude of the glaciated areas (between 44°06′43″N and 45°35′34″N), (ii) the local climatic factors (temperature and amount of precipitation) and (iii) the exposure (CitationMercalli & Cat Berro, 2005).
Glaciers of the Piedmont Alps have previously been investigated by CitationSacco (1925, Citation1927, Citation1928, Citation1932) and the Italian Glaciological Committee (CitationComitato Glaciologico Italiano; CGI, 1961); recently, accurate studies were carried out in the Maritime Alps by CitationFederici, Pappalardo, and Ribolini (2003) and CitationFederici and Pappalardo (2010), and in the Central Graian Alps by CitationMercalli and Cat Berro (2005).
The glaciated and recently deglaciated areas represented in the map are grouped into five main sectors, from North to South: Central Graian Alps (highest altitude Gran Paradiso, 4061 m), Southern Graian Alps (highest altitude Uia di Ciamarella, 3676 m), Northern Cottian Alps (highest altitude Pierre Menue, 3506 m), Central Cottian Alps (highest altitude Monviso, 3840 m) and Maritime Alps (highest altitude Cima Sud dell'Argentera, 3297 m).
3. Methods: map production
In order to produce the map of the LIA and current glacier extent, data available from different archives, as well as new data were considered.
3.1. Archive data
Data archives examined for this work were:
glacier front variations documented by the annual surveys of the volunteers of the Italian Glaciological Committee since 1927 (www.glaciologia.it);
the national glacier inventory promoted by the CGI on the occasion of the International Geophysical Year 1957–1958 (www.glaciologia.it);
the World Glacier Inventory (WGI) on glacier distribution from the 1980s onwards (www.nsidc.org);
official topographic maps of the Italian Military Geographical Institute (Istituto Geografico Militare Italiano, IGMI), at a scale of 1:25,000, dating from the end of the nineteenth century and the beginning of the twentieth century;
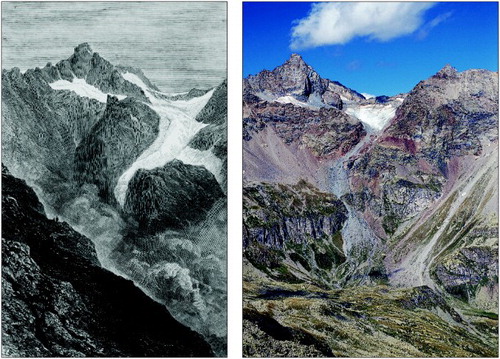
historical photos and images from glaciological publications and photographic archives (IGMI, CGI, Italian Alpine Club, etc.; ).
Figure 1. The Teleccio Glacier under the pyramidal peak of Torre del Gran San Pietro (3692 m), viewed looking North-East from the peak of Gran Carro (2961 m), in a drawing of 1850 by M. A. Relly (left) and in a 2003 photo by D. Cat Berro (right).
The information collected from these archives facilitated identification of the maximum extent of the glaciers at the peak of the LIA, reconstruction of the steps of glacial retreat, and detection of some glaciers not included in the previous inventories. Although data archives have proven to be discontinuous and lacking regarding several aspects, they have been redrawn and represented on the topographic map of the Regione Piemonte (Carta Tecnica Regionale – 1:10,000 scale).
A general limitation of the data derived from these archives relates to the locations of the morphological features (i.e. morainic ridges), which are difficult to map in detail. Furthermore, the 1:10,000 scale topographic map is not congruent with the old IGMI maps, also used as base maps for the CGI inventory. In addition, data derived from historical photos, images and text documents (such as the annual glaciological campaigns carried out by the CGI volunteers) are difficult to interpret, in many cases, for the purpose and the detail of this map. Archive data are therefore important mainly for qualitative comparison of different glacial configurations.
3.2. New data
In order to draw both present-day and LIA glacier outlines (see Main Map), detailed analyses and mapping of glacial landforms related to the glacial expansion during the LIA (moraines and glacial cirques) and of more recent glacial features (post-LIA moraines, current glacial boundaries, supraglacial morainic ridges, supraglacial and proglacial lakes and main crevasses) were carried out. Geomorphological analysis was performed for the entire study area (about 140 km2) through a detailed interpretation of traditional aerial photos and digital orthophotos, available at a variety of scales and for different years.
For this purpose, the following images were considered:
aerial photographs of the Regione Piemonte, produced in 2001, at a scale of approximately 1:20,000 (CGR-Parma and Rossi-Brescia);
aerial photographs and digital orthophotos of the Comunità Montana Valle Orco, produced in 2005, at a scale of approximately 1:20,000 (Alifoto-Torino), only available for the Central Graian Alps (A, B, C in the Main Map);
digital orthophotos, produced in 2006, at a scale of 1:10,000, accessible online on the Portale Cartografico Nazionale (Italian National Cartographic Web Portal, www.pcn.minambiente.it/GN/).
Traditional aerial photographs were analyzed using a classical stereoscope, while digital aerial photographs were analyzed using a digital stereo viewer.
Photo analysis led to the identification and mapping of glacial landforms and morphological features for the subsequent reconstruction of the current and LIA glacier extent; these data were stored in a spatial database.
Values of certain morphometric parameters (surface, length, width, mean slope, highest and lowest altitude, exposure) of the glaciers, for the LIA and 2006 time periods, were computed and associated with the glacial polygons through a geographical information system (GIS) dataset. With reference to surface parameters, only the planimetric values were taken into account because of the coarse-resolution of the digital terrain model (DTM; 50 m grid) and year of production (1991). In addition, topographic data related to the LIA were not available, and any attempt to convert the projected glacial areas into surface area would prove too unreliable. Finally, field surveys were carried out by the authors for the period 2010–2012 in order to check glacier boundaries and front positions, mainly in the most complex areas.
3.2.1. Reconstruction of peak LIA glacier extent
In order to define the maximum glacial expansion at the peak of the LIA, the main morphological features (moraines and glacial cirques) in the deglaciated areas were identified and mapped. Following this, the morainic ridges were interpolated to define lateral and frontal glacier boundaries and to reconstruct the glacier outlines. With the aid of archive data, glacier perimeters were then extrapolated to include areas where the morainic ridges were not formed or preserved.
The reliability of the reconstructed boundaries of LIA glaciers depends on the presence of evident morphological features, their spatial continuity and degree of preservation, sometimes conditioned by the presence of snow and debris cover. The accuracy of the mapping is also a function of the quality of the aerial imagery; the main obstacles to clear observations are the presence of shadows in steep slopes, cloud cover obscuring underlying areas, and the low resolution of some photos. In these cases, the interpretation was quite subjective, and the data acquired by photo analysis where possibly were integrated by means of field surveys. However, a systematic field check of the morphological data was beyond the objectives of the GlaRiskAlp project, given the extent of the study area, along with time constraints. Nevertheless, we tried to overcome any uncertainties related to photo interpretation by comparing different sets of aerial photos, and with the aid of the historical documentation.
3.2.2. Current glacier extent
For mapping the current glacier extent, the most recent available documentation was analyzed, and compared with the glacial boundaries drawn through the photo interpretation of the 2006 orthophotos. Glacial boundaries were also compared to the data of the annual glaciological campaigns of the CGI, and with field surveys carried out by the authors during the period 2010–2012. Other significant morphological features related to present-day glaciers, such as crevasses and lakes, were also included in the map.
A major uncertainty is introduced in the definition of glacier outlines when large portions of ice, especially at the lateral contact with slopes, are masked by snow or debris. Furthermore, dead ice and snowfields cannot always be clearly distinguished from glacier ice by means of photo interpretation. In these cases, we tried to use other morphological elements (such as crevasses and slope profiles), together with the surface appearance of snow cover, to identify glacial boundaries. In these cases, field observations were also useful to precisely locate the present-day glacier fronts.
3.3. The main map
The final document is a synthetic map at a scale of 1:25,000 containing the extent of 96 LIA glaciers and 36 current glaciers, related linear landforms (morainic ridges, crevasses and glacial cirques) and present-day lakes.
A progressive code number, from North to South, has been attributed to each LIA glacier; the same code also refers to the current glacier, if preserved. As some LIA glaciers were fragmented into smaller units, current glacial bodies (66) are identified by the codes of the original LIA glaciers, followed by a letter. This numbering was introduced by the authors for the specific needs of the GlaRiskAlp project: in , glacier project codes are associated with the national codes (CGI codes) as well as international ones (WGI codes). Nevertheless, in the morphometric analysis, glacial bodies coming from the fragmentation of the same LIA glacier were computed as a single glacier.
Table 1. Morphometric parameters of the LIA and 2006 glaciers. n.°: LIA and 2006 glacier codes. Hmax: highest altitude. Hmin: lowest altitude. S: surface. N.o: CGI and WGI codes.
Current linear landforms, current glaciers and lake polygons, along with LIA glacier polygons were digitized into three separate shapefiles. To compile the Main Map, vector layers were then exported (as .EPS files) into vector graphic editing software. As a topographic support, the digital map (1:50,000 scale) of the Regional Agency for the Protection of the Environment (ARPA Piemonte) (http://webgis.arpa.piemonte.it/geoportale/index.php/it/servizi-wms-wfs.html), published in 2011, was used.
4. Discussion and conclusions
To evaluate the changes in the glaciated areas over the last 150 years, the limits reached by glaciers in the Western and South-Western Piedmont Alps during the LIA, and in 2006, were mapped. Morphological analysis performed with interpretation of aerial photos, combined with field work and analysis of historical maps and images, made it possible to identify and trace the outline of the 96 LIA glaciers, and to carry out a preliminary analysis of their extent.
The glaciers are distributed as follows:
36 glaciers (n.° 1–36 in the Main Map) in the Central Graian Alps, including the Orco and the Soana Valleys, with an overall area of 23.12 km2;
20 glaciers (n.° 37–56) in the Southern Graian Alps, including the Lanzo Valleys, with an overall area of 15.92 km2;
9 glaciers (n.° 57–65) in the Northern Cottian Alps, including the Susa Valley, with an overall area of 4.61 km2;
11 glaciers (n.° 66–76) in the Central Cottian Alps, closest to the Monviso Massif (upper Po and Varaita Valleys) covering an area of 1.52 km2;
20 glaciers (n.° 77–96) in the Maritime Alps, including the Stura di Demonte and the Gesso Valleys, with an overall area of 3.27 km2.
The total area covered by ice during the peak of the LIA amounted to 48.45 km2, whereas individual glaciers extended over areas ranging between 0.03 km2 (Sella Glacier, n.° 71, in the Monviso Massif) and 3.99 km2 (Noaschetta Glacier, n.° 16, in the Gran Paradiso Massif). The minimum altitude reached by the glacier fronts ranged from 2175 m (La Madre di Dio Glacier, n.° 79, in the Maritime Alps) to 3600 m (Colle dell'Ape Glacier, n.° 18, in the Gran Paradiso Massif).
Most of the mapped LIA glaciers were cirque glaciers, sometimes resulting from the coalescence of several smaller cirque glaciers (e.g. Carro Occidentale and Nel Glaciers, n.° 31 and 32; ). In just a few cases, the volume and length of the glacial masses were sufficient to enable the development of valley glaciers, such as in the case of the Sea and Collerin d'Arnas Glaciers (n.° 44 and 46, in the Lanzo Valleys), with lengths of 2.8 km and 3.8 km, respectively.
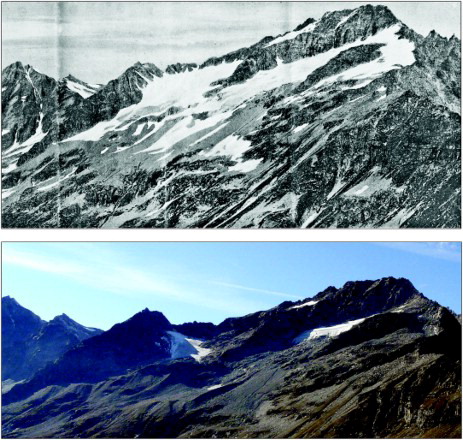
Figure 2. The Levanna Orientale Glaciers viewed looking West from Barrouard (2856 m). The upper photo was taken in 1902 by C. Grosso, the lower photo by F. Rogliardo in 2011 (source: CGI archives).
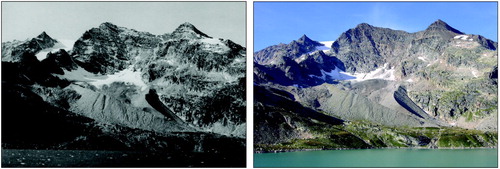
The maximum glacial advance reached at the end of the LIA is almost always evidenced by well-developed ice-marginal moraines, rising up to 40–50 m. Impressive terminal dump moraines (CitationBoulton & Eyles, 1979), up to one kilometer in length, are visible at the edges of the Capra Glacier, in the Orco Valley (), and along the left flank of the Bessanese Glacier in the Lanzo Valleys (n.° 47 in the Main Map). Currently, most of the nineteenth century moraines are irregularly colonized by pioneer herbaceous vegetation, mostly on slopes that are not subjected to intense rain-wash. In some terminal moraines, blocks and rock fragments are almost completely devoid of lichens, whereas in other cases an incipient lichen cover (thallus size <8–10 mm) is visible on rock surfaces.
Figure 3. The Capra Glacier viewed looking South-West from the Lago Serrù dam (2283 m). Left in a 1957 photo from CGI archives, right in a 2010 photo by G. Fioraso.
Since the end of the LIA, end-moraines have been affected by intense erosion, also favored by the absence of vegetation cover, which in some cases radically changed the original morphology of such glacial landforms. For instance, on 24 September 1993, after an intense rainstorm, a large portion (800,000 m3) of the frontal moraine of the Mulinet Glacier (n.° 40 in the map) was removed by a huge debris flow that traveled 4.5 km downstream (CitationMortara, Dutto, & Godone, 1995).
Between 1850 and 2006, the overall number of glaciers in the studied area has decreased by 63.5%. The 36 glaciers still present in 2006 are distributed as follows:
18 glaciers in the Central Graian Alps, covering an area of 6.72 km2;
13 glaciers in the Southern Graian Alps, with an overall area of 3.83 km2;
the Agnello Glacier in the Northern Cottian Alps (0.09 km2);
4 glaciers in the Monviso Massif (in total 0.13 km2).
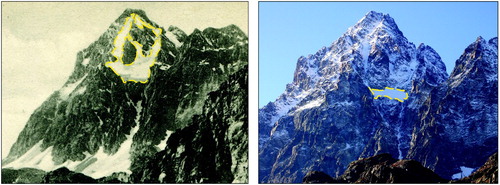
In 2006, the total surface area covered by ice in the studied area was 10.77 km2, which correspond to a reduction of 77.8% compared with the glacier extent during the LIA. The positive/negative interplay of factors such as altitude, aspect, solar radiation and relief morphology has been critical in the survival/melting of glaciers. In some cases, impressive recession of glaciers also involved their upper edges; for instance, the highest point of the Coolidge Superiore Glacier (n.° 68 in the Monviso Massif), has reduced from 3720 m during the LIA, to a current altitude of 3280 m (). Moreover, compared to the nineteenth century, in 2006 some glaciers (17) were subdivided into individual smaller parts (e.g. Sea and Rocciamelone glaciers, n.° 44 and 56).
Figure 4. Comparison of the Coolidge Superiore Glacier extent (yellow dashed line) between around 1925 (left, CGI archives) and 2012 (right, photo by G. Fioraso), viewed looking SSE from Pian del Re (2013 m).
Over the last 150 years, deglaciation was interrupted for short periods by a halt or readvance of glacier fronts (for instance from 1950 to 1980, as a consequence of a slight global cooling; CitationBiancotti & Motta, 2000; CitationCitterio et al., 2007; CitationZemp et al., 2008). Standstill and/or fluctuations of ice margins, in some cases (e.g. Capra Glacier, n.° 29), are documented by recessional moraines abandoned at the innermost edge of the LIA moraines; these moraines do not exceed 1–2 m in height, and are less continuous compared to those attributed to the LIA.
Software
Map design and database construction were carried out using ESRI ArcGIS 9.3. The final graphical production of the map was performed using Adobe Illustrator CS3.
Main Map: Map of Little Ice Age and Current Glacier Extent in the Western and South-Western Piedmont Alps
Download PDF (156.4 MB)Acknowledgments
The present study was carried out under the framework of the Alcotra 2007–13 Project n. 56 ‘GlaRiskAlp’. We acknowledge all the partners of the project (Fondazione Montagna Sicura, project leader, ARPA Valle d'Aosta, Université de Savoie – Laboratoire LISTIC, CNRS France – Laboratoires LGGE, GIPSA, EDYTEM), for fruitful discussions.
Special thanks go to Giovanni Mortara, Marco Giardino, Luigi Perotti, Franco Godone and Guido Nigrelli, for their valuable scientific and technical advice during the development of the project. Finally the Authors thank Matteo Spagnolo, Philip Deline and John Abraham for constructive reviews.
References
- Biancotti, A., & Motta, L. (2000). L'evoluzione recente ed attuale dei ghiacci italiani. Bollettino Geofisico, 23(3–4), 27–35.
- Bonardi, L., Rovelli, E., Scotti, R., Toffaletti, A., Urso, M., & Villa, F. (2012). I ghiacciai della Lombardia: Evoluzione e attualità. Servizio Glaciologico Lombardo, Hoepli, Milano, 328 pp.
- Boulton, G. S., & Eyles, N. (1979). Sedimentation by valley glaciers. A model and genetic classification. In C. Schluechter (Ed.), Moraines and varves; origin, genesis, classification. INQUA symposium on genesis and lithology of Quaternary deposits (pp. 11–23). Rotterdam: Balkema.
- Bury, J., Mark, B. G., Mckenzie, J., French, A., Baraer, M., In Huh, K., … Gómez López, R. J. (2011). Glacier recession and human vulnerability in the Yanamarey watershed of the Cordillera Blanca, Peru. Climatic Change, 105, 179–206.
- Calmanti, S., Motta, L., Turco, M., & Provenzale, A. (2007). Impact of climate variability on Alpine glaciers in Northwestern Italy. International Journal of Climatology, 27, 2041–2053. doi: 10.1002/joc.1500
- Chiarle, M., Geertsema, M., Mortara, G., & Clague, J. J. (2011). Impacts of climate change on debris flow occurrence in the Cordillera of Western Canada and the European Alps. In R. Genevois, D. L. Hamilton, & A. Prestininzi (Eds.), Proceedings of the 5th International Conference on debris-flow hazards mitigation, mechanics, prediction and assessment (pp. 14–17). Italy: Padova, June 2011, Università La Sapienza, Roma, 45–52.
- Citterio, M., Diolaiuti, G., Smiraglia, C., D'Agata, C., Carnielli, T., Stella, G., & Siletto, B. G. (2007). The fluctuations of Italian glaciers during the last century: A contribution to knowledge about Alpine glacier changes. Geografiska Annaler, 89(3), 164–182.
- Comitato Glaciologico Italiano – Consiglio Nazionale delle Ricerche. (1961). Catasto dei ghiacciai italiani. Anno geofisico 1957–1958, Vol. I. Torino, Italy: Comitato Glaciologico Italiano, 324 pp.
- Dal Piaz, G. V., Bistacchi, A., & Massironi, M. (2003). Geological outline of the Alps. Episodes, 26(3), 175–180.
- Faletto, M., Prola, M. C., Acquaotta, F., Fratianni, S., & Terzago, S. (2013). La neve sulle Alpi Piemontesi. Quadro conoscitivo aggiornato al cinquantennio 1961–2010. ARPA Piemonte, 97 pp.
- Federici, P. R., & Pappalardo, M. (2010). Glacier retreat in the Maritime Alps area. Geografiska Annaler, 92(3), 361–373. doi: 10.1111/j.1468-0459.2010.00401.x
- Federici, P. R., Pappalardo, M., & Ribolini, A. (2003). Geomorphological map of the ‘Maritime Alps’ Natural Park and surroundings (Argentera Massif, Italy). 1:25,000 scale. Firenze: Selca.
- Fioraso, G., Bertotto, S., Lucchesi, S., Nigrelli, G., & Chiarle, M. (2013). Changes of glaciers outlines in the last 150 years in the Western Italian Alps. Geophysical Research Abstracts, 15, 14077.
- Holm, K., Bovis, M. J., & Jakob, M. (2004). The landslide response of alpine basins to post-Little Ice Age glacial thinning and retreat in Southwestern British Columbia. Geomorphology, 57, 201–216. doi: 10.1016/S0169-555X(03)00103-X
- Houghton, J. T., Ding, Y., Griggs, D. J., Noguer, M., Van Der Linden, P. J., Dai, X., … Johnson, C. A. (2001). Climate change 2001: The scientific basis. Contribution of working group 1 to the third assessment report of the Intergovernmental panel on climate change. Cambridge University Press, Cambridge, United Kingdom and New York, NY, USA, 881 pp.
- Kaser, G., Großhauser, M., & Marzeion, B. (2010). Contribution potential of glaciers to water availability in different climate regimes. PNAS, 107(47), 20223–20227. doi: 10.1073/pnas.1008162107
- Koppes, M. N., & Hallet, B. (2002). Influence of rapid glacial retreat on the rate of erosion by tidewater glaciers. Geology, 30, 47–50. doi: 10.1130/0091-7613(2002)030<0047:IORGRO>2.0.CO;2
- Mercalli, L., & Cat Berro, D. (2005). Climi, acque e ghiacciai tra Gran Paradiso e Canavese. Società Meteorologica Subalpina, 755 pp.
- Mortara, G., Dutto, F., & Godone, F. (1995). Effetti degli eventi alluvionali nell'ambiente proglaciale. La sovraincisione della morena del Ghiacciaio del Mulinet. Geografia Fisica e Dinamica Quaternaria, 18(8), 295–304.
- Orlove, B. (2009). Glacier retreat: Reviewing the limits of adaptation to climate change. Environment, 51(3), 22–34. doi: 10.3200/ENVT.51.3.22-34
- Painter, T. H., Flanner, M. G., Kaser, G., Marzeion, B., VanCuren, R. A., & Abdalati, W. (2013). End of the little ice age in the Alps forced by industrial black carbon. PNAS, 110(38), 15216–15221. doi: 10.1073/pnas.1302570110
- Raup, B., Racoviteanu, A., Khalsa, S. J. S., Helm, C., Armstrong, R., & Arnaud, Y. (2006). The GLIMS geospatial glacier database: A new tool for studying glacier change. Global and Planetary Change, 56(1–2), 101–110. doi: 10.1016/j.gloplacha.2006.07.018
- Sacco, F. (1925). Il glacialismo nelle Valli Orco e Soana. Bollettino Comitato Glaciologico Italiano, 6, 35–64.
- Sacco, F. (1927). Il glacialismo nel Gruppo del Monviso. Bollettino Comitato Glaciologico Italiano, 7, 58–94.
- Sacco, F. (1928). Il glacialismo nelle Valli di Lanzo. Min. Lavori Pubblici, Serv. Idrogr., Pubbl. n. 10, 29 pp.
- Sacco, F. (1932). Il glacialismo delle Alpi Marittime Italiane. Min. Lavori Pubblici, Serv. Idrogr., Pubbl. n. 10, vol. 7, 42 pp.
- Stott, T. A., & Mount, N. J. (2007). Alpine proglacial suspended sediment dynamics in warm and cool ablation seasons: Implications for global warming. Journal of Hydrology, 332(3–4), 259–270. doi: 10.1016/j.jhydrol.2006.07.001
- Vergara, W., Deeb, A. M., Valencia, A. M., Bradley, R. S., Francou, B., Zarzar, A., … Haeussling, S. M. (2007). Economic impacts of rapid glacier retreat in the Andes. EOS, 88(25), 261–264. doi: 10.1029/2007EO250001
- Zemp, M., Paul, F., Hoelzle, M., & Haeberli, W. (2008). Glacier fluctuations in the European Alps 1850–2000: An overview and spatio-temporal analysis of available data. In B. Orlove, E. Wiegandt, & B. Luckman (Eds.), The darkening peaks: Glacial retreat in scientific and social context (pp. 152–167). Berkeley: University of California Press.