
Abstract
Land Use – Land Cover (LULC) maps have developed remarkably since the global community became aware of the importance of knowing where LULC change is taking place on the Earth's surface. The rapid evolution of geographic information data handling and the automation of satellite image interpretation through remote sensing techniques and algorithms is providing increasingly abundant and up-to-date information on LULC. In addition, at large detail scales, it is important to link LULC maps to available statistical information, such as census information and business activities, which allow land parcels to be more accurately classified. Though automated classification methods can produce useful maps at smaller detail scales, it is not usually possible to accurately map urban areas at large scales without considerable investment of human resources. The development of large-scale information for urban areas is very important, especially in urban areas with accelerated rates of urban change which may jeopardize natural resources and citizens’ quality of life. In this paper, the creation of a set of large detail scale LULC maps and accompanying geodatabase for one such dynamic urban change region, the Madrid Autonomous Community (AC), Spain, is discussed.
1. Introduction
Land Use – Land Cover (LULC) maps and geodatabases have developed remarkably owing to the fact that they have become one of the principal tools for monitoring environmental change. For the global change community, it is not sufficient to know that the human-environment will expand, shrink, or intensify a particular land use; they also need to know where these changes will take place (Turner, Citation2001). From this starting point, a great number of LULC maps and geodatabases have been developed for different spatial contexts (global, regional, local). These databases have been developed from similar perspectives but in different ways with most of them based on recent periods (Skokanová et al., Citation2012). Within the context of this paper land use refers to the human utilization of the land such as settlements, crops, pasture, recreation, and so on, while land cover denotes the physical state of the land, for example the quantity and type of surface vegetation, water, and Earth materials (Turner & Meyer, Citation1994).
Global examples of projects which involve LULC maps and geodatabases are the International Geosphere-Biosphere Programme (IGBP); the international Human Dimensions Programme on Global Environmental Change (IHDP); and the History Database of the Global Environment (HYDE). The last of these intends to obtain patterns of land use for the last 300 years (Goldewijk, Citation2001). The IGBP-IHDP project, aims, among other things, to explore LULC changes on the Earth's surface (e.g., desertification, biodiversity loss, soil loss) Turner et al. (Citation1990) cited in Goldewijk (Citation2001). In Europe, one remarkable initiative to gather LULC information has been CORINE Land Cover (CLC). CLC aims to coordinate and homogenize compatible data and environment information among European Member States and also with other International datasets.
Exploring a set of LULC maps and geodatabases (the previously mentioned IGBP-IHDP, HYDE, CLC; Deng, Huang, Rozelle, & Uchida, Citation2010; Diaz-Pacheco, Citation2013; Hansen, DeFries, Townshend, & Sohlberg, Citation2000; Ménard & Marceau, Citation2012; Romano & Zullo, Citation2012; Samat, Citation2006) we found that they could be classified by (1) the procedure employed to extract the LULC information (classification process); (2) the extent and mapping scale; and (3) the temporality (periodicity and number of available time periods). In more detail:
LULC Procedure: generally LULC maps and geodatabases are created through processes of classification of aerial or satellite imagery. This process could be automatic, computer-assisted, or based on photo-interpretation. The first usually corresponds to the methods employed in remote sensing processes for information acquisition; the second refers to classification methods where the information produced by the automatic procedure is checked later by expert technicians; and the last would principally employ human criteria to classify and interpret the images and LULC classes. Both, the global initiatives and the regional approaches to create LULC information usually employ automatic or computer-assisted methods, without these it would not be possible to manage such a large quantity of imagery information in a reasonable period of time. However, certain categories of LULC, for example urban areas, are almost impossible to map using only computer-assisted image classification methods (Loveland et al., Citation2000, p. 1315).
In terms of the extent and the mapping scale, as with any other cartographic or geographic information, LULC maps are useful abstractions of real phenomena. The attribute and positional accuracy of these maps and geodatabases with respect to the abstracted phenomena is strongly related to the mapping scale (Chrisman, Citation1991), and at the same time, the chosen mapping scale depends on the context and the extent of the phenomena which are mapped. Urban land growth, for example, can be considered as a human occurrence which must be modeled at high detail scale, because the urban land units can have small sizes (facilities, parks, residential parcels, etc.), but if we intend to model the urban land growth of Europe, the scale would need to be smaller in order to allow an overview of the process across the whole continent. In addition, other elements of LULC maps, such as the number of LULC classes and the minimum mapped unit, are not independent characteristics of the maps but are closely linked to the mapping scale.
Finally, the LULC maps and geodatabase usually include several information time periods. This is one of the most important functional pieces of information provided by the LULC map or geodatabase, since observing the difference between two or more time periods allows the LULC changes recorded during this period to be calculated. Every information time period portrays the land use configuration at a single reference date (usually 1 year). In practice this single reference date may be a composite of several adjacent time periods considered to represent approximately the land use configuration shown at the given reference date. The reliability with which changes observed across a particular time period using a LULC maps or geodatabase for two or more different dates is strongly linked to the similarity of the criteria followed to create each time period of information.
Siedentop and Meinel (Citation2004) point out that the sequence of maps which comprise an LULC geodatabase has to fulfill a set of requirements, so that (1) images used for all data periods are of uniform scale, resolution, and ideally, source, (2) data collection methodology and digitization rules are the same; (3) the LULC map for the first time period should be used to produce the second, the second for the third, and so on. These authors also call attention to the need to use an image resolution appropriate to the mapping scale, and remark that an LULC map should be ‘connectible with statistical data regarding population, employment, housing in order to analyze land use trends in relation to their socio-economic framework’.
In the following paragraphs we discuss the development of Madrid Land Use (MLU). MLU is a LULC set of maps and geodatabase created in order to capture land use configuration in Madrid region at high detail scale (1:10,000) for different time periods (2000, 2006, and 2009), following identical criteria throughout its development process. MLU has focused initially on urban land with the intention of improving the attribute and position accuracy provided by the European CLC dataset. MLU and CLC datasets were then compared and their differences were analyzed (Diaz-Pacheco, Citation2013). Subsequently, MLU was improved by adding non-artificial LULC information by introducing another LULC map from a different source. Finally, MLU was further developed to allow connection to statistical data (e.g., population data such as income, age ratios, nationality, etc.).
2. Study area
The mapped region corresponds to the Madrid Autonomous Community, an administrative region of Spain equivalent to the NUTS-2 European statistical units (). Over the last 10 years, the Madrid region has developed in an extraordinarily dynamic way. Between 2000 and 2009, the population increased by almost 1.18 million, from 5.2 to 6.38 million inhabitants, representing demographic growth of 2.5% per year.
The expansion of urban land use in the Madrid metropolitan area during the 1990s was spectacular. Previous studies which used CLC as the LULC information source showed that urban land increased by more than 30,000 ha, an annual growth rate of 4.77%, when at this time, the population grew scarcely 0.8% a year. Furthermore, in these years the surface area under construction grew by 200% (Hewitt & Escobar, Citation2011; Rocha, Delgado, & Sendra, Citation2009). This growth of urban land, in a situation of demographic stability, a result of the increase in the available built-up area per person, transforming in only 5 years (de 1996 a 2001) from 153 to 179 m2 per inhabitant (de Lucio, Citation2003). In Spain, only some coastal cities, such as Alicante or Murcia, have had greater rates of urban land growth than Madrid.
MLU was recently compared with CLC in order to explore its limitations for monitoring urban land use dynamics (Diaz-Pacheco, Citation2013). This exploration noted high rates of error in the urban land use change location, fundamentally because of the scale. According to MLU, in the Madrid Autonomous Community between 2000 and 2009, the area of land dedicated to urban use grew 19.4%, at an annual rate of 2.2%. This increment has occurred at a time of population growth. In fact, the population has grown at a faster pace than the urban land use (2.5% annually) (See ).
Table 1. Evolution of the population and urban land in Madrid Region (2000-2006-2009).
The mentioned urban expansion of Madrid has been accentuated by the implementation of a metropolitan model at every stage that is more dispersed and of lower density; this is contrary to traditional patterns of urban growth in Mediterranean cities, which are more concentrated, denser and monocentric. Today (2013), however, in comparison with the strong dynamics of the preceding decades, the situation is quite different. The property crash has resulted in the paralysis of the majority of new residential developments, now mostly confined to small-scale urban transformations in the interior of cities. For these reasons Madrid region has become a laboratory for the observation of land use dynamics. It is crucial that robust LULC maps and geodatabases are available if past land use change in Madrid is to be properly understood. Without a proper record of past land use dynamics, it will be difficult to put in place effective and sustainable land planning policies to avoid undesirable over-development and future real estate bubbles.
3. Methods
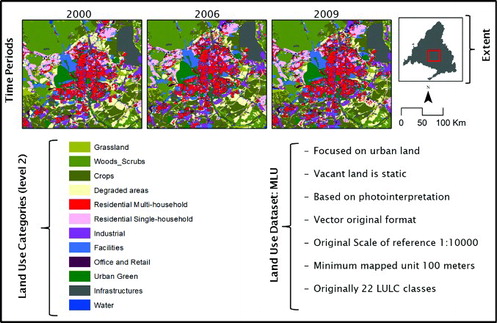
MLU, a set of sequential LULC maps of Madrid for the years 2000, 2006, and 2009, has been created following the same criteria for the construction of each map. The LULC maps were initially developed for urban land uses; however ‘non-artificial’ LULC categories from an existing cartographic source available for 1997 were added and combined. For this reason, urban land was captured dynamically for every time period of LULC while the non-urban land (non-artificial) is static (year 1997). The LULC maps include 3 levels and 43 categories of maximum disaggregation ().
Table 2. LULC categories of Madrid land use.
MLU has been developed up to the present time for three time periods (2000, 2006, and 2009) with a nominal reference scale of 1:10,000 and a minimal mapping unit of 100 meters ().
Figure 1. Location of Madrid region.
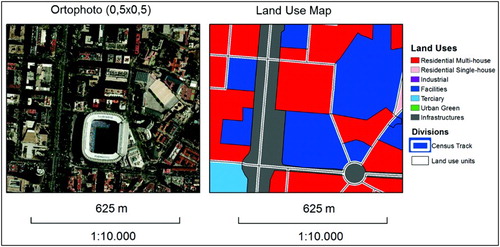
The mapping process was carried out in two stages. In the first stage an urban land use map was built by classifying a mosaic of high-resolution orthorectified aerial images (0.5 × 0.5 m) for the year 2000. Subsequently, urban land changes during the following two periods (2006, 2009) were incorporated using the previous urban land use map in each case (2000, 2006).
Figure 2. Characteristics of the MLU maps (level 2).
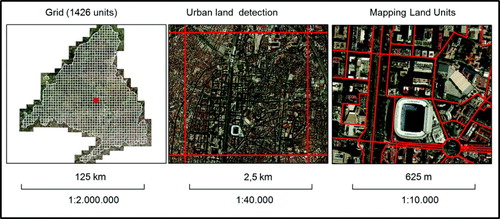
Urban land use information was captured on the basis of visual detection of the urban shapes in the images, reviewing one by one the 1436 units (each unit is a square of 6.25 × 6.25 km2) of a lattice extended over the polygon which represents the study area ().
Figure 3. Procedure for land use data capture from orthophotos.
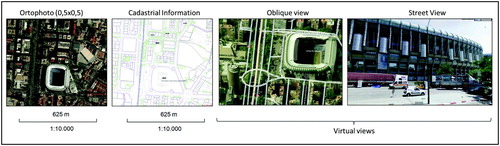
The classification of the land use units was carried out by visual analysis undertaken by experts (photo-interpretation), who designed the classification decision system, also supported by field observation and the use of other local and regional cartography such as national cadastral information and local urban planning maps. Virtual sources were also employed to identify land use, such as Google StreetView (https://maps.google.es/) and the oblique views provided by Bing maps (http://www.bing.com/maps/) ().
Figure 4. Support to urban land use classification.
MLU urban land use units were connected with statistical units (census tracts), which allowed urban land use units to be divided even where they had the same land use category. This aspect notably increases the usefulness of these maps () for land planning since land use is in many cases an important indicator which must be combined with statistical data referenced according to census tract (population density, transport accessibility, diversity of land uses etc.). The operation to link up the statistical information is simple, and consists of considering the borders of the census tracts as the borders of the land use units. It means that the census tracts borders are always respected when the land use unit limits are traced ().
Figure 5. Land use units overlapping census tract units.
In the second phase, LULC cartographic information was linked to the urban land use information to shape the final set of MLU maps. For this phase an existing LULC map developed by the Centre of Environmental Research (Centro de Investigaciones Ambientales, CIAM) of Madrid Community was used. This map had been created for the year 1997, with a reference scale of 1:50,000, and focused specifically on vegetation cover, including land uses such as crops, pasture, mineral extraction sites, etc.
The procedure employed to combine the information from both map sources comprised extraction of all the urban information from the LULC and CIAM maps. Subsequently the urban land use information created at the first stage was joined to the previous by means of overlay techniques ().
Figure 6. Sample of final composition and details at 1:50.000 of MLU (2009).
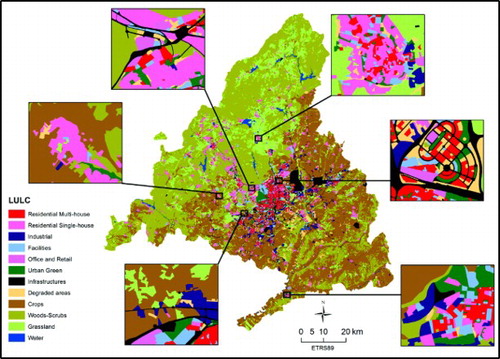
The LULC information of CIAM was available for only one time period (1997). For this reason, in the resulting MLU-CIAM combined map urban (non-artificial land) is static while urban land is dynamic. Therefore the changes not related to urban or artificial land, i.e., forest to agriculture, a type of crop for another, a type of vegetation for another, etc. are not represented. This was not considered a problem, since the principal objective of the work was to obtain some background information about initial non-urban land use contributors to urban change, not to monitor non-urban changes over a series of time periods, as was the case for the urban land uses.
4. Discussion and conclusions
A geographical dataset comprising a set of LULC has been developed for three time periods for the Autonomous Community of Madrid. These maps can be used for analytical geographical applications (e.g. transport, population density or census-based analyses) but also can be useful for land use modeling purposes where the configuration and distribution of land use in the Madrid region needs to be known at successive time periods.
This dataset has two important characteristics: (1) the highly detailed mapping scale (1:10,000) and (2) the connectivity between the land use information and a set of statistical units (census tracts). The large-scale employed increases the attribute and positional accuracy available for urban land use in Madrid, since the only other LULC information available for a series of time periods for Madrid is the European CLC dataset (scale 1:100,000). It has not been the intention of this work to substitute the CL as its robustness comes from the coordination of comparable information between European countries, but rather to supply more detailed information necessary to understand the land use dynamics of this region that has seen explosive urban expansion during the mapped period. In addition, these maps aim to satisfy the needs of the Madrid region to link land use information with statistical units such as census tract.
The MLU maps and geodatabase give direct information on land occupation, and LULC evolution between 2000, 2006, and 2009, and are able to supply very useful representations of urban land use beyond the municipal (local) scale. They are at an appropriate scale and level of detail for making planning decisions. They can support any kind of study on the environment related to land use, for example, land occupation, urban growth, and diversity of land uses. Through the use of GIS MLU also allows the use of a range of spatial analytical operations, for example, to compute dasimetric population densities or urban spatial metrics, or to carry out accessibility analysis.
MLU can also be used as a basis for dynamic models of urban LULC change such as cellular automata models (Barredo, Demicheli, Lavalle, Kasanko, & McCormick, Citation2004; Batty, Xie, & Sun, Citation1999; White & Engelen, Citation1993), or agent-based models (Brown, Page, Riolo, Zellner, & Rand, Citation2005; Veldkamp & Verburg, Citation2004).
Future work is likely to include the incorporation of LULC information for new neighboring regions that are usually considered to fall under the influence of the Madrid metropolitan region, such as Toledo, Segovia and Guadalajara. It is also planned to update the land use map series by adding more recent time periods of LULC information.
Software
The construction of the maps and the treatment of the land use data and images was performed using Esri ArcGIS 10.1.
Main Map: Madrid Land Use and Land Cover: 2000, 2006, 2009
Download PDF (29.4 MB)Acknowledgements
The authors want to gratefully acknowledge the collaboration of the researcher Richard Hewitt for the revision and recommendations done on this research.
References
- Barredo, J. I., Demicheli, L., Lavalle, C., Kasanko, M., & McCormick, N. (2004). Modelling future urban scenarios in developing countries: An application case study in Lagos, Nigeria. Environment and Planning B, 31(1), 65–84. doi: 10.1068/b29103
- Batty, M., Xie, Y., & Sun, Z. (1999). Modeling urban dynamics through GIS-based cellular automata. Computers, Environment and Urban Systems, 23(3), 205–233. doi: 10.1016/S0198-9715(99)00015-0
- Brown, D. G., Page, S., Riolo, R., Zellner, M., & Rand, W. (2005). Path dependence and the validation of agent-based spatial models of land use. International Journal of Geographical Information Science, 19(2), 153–174. doi: 10.1080/13658810410001713399
- Chrisman, N. (1991). The error component in spatial data. Geographical Information Systems, 1, 165–174.
- Deng, X., Huang, J., Rozelle, S., & Uchida, E. (2010). Economic growth and the expansion of urban land in China. Urban Studies, 47(4), 813–843. doi: 10.1177/0042098009349770
- Diaz-Pacheco, J. (2013). Exploring the Limitations of CORINE Land Cover for Monitoring Urban Land use Dynamics in Metropolitan Areas. Journal of Land Use Science (ahead of print), 1–17. doi:10.1080/1747423X.2012.761736
- Goldewijk, K. K. (2001). Estimating global land use change over the past 300 years: The HYDE database. Global Biogeochemical Cycles, 15(2), 417–433. doi: 10.1029/1999GB001232
- Hansen, M. C., DeFries, R. S., Townshend, J. R. G., & Sohlberg, R. (2000). Global land cover classification at 1 km spatial resolution using a classification tree approach. International Journal of Remote Sensing, 21(6–7), 1331–1364. doi: 10.1080/014311600210209
- Hewitt, R., & Escobar, F. (2011). The territorial dynamics of fast-growing regions: Unsustainable land use change and future policy challenges in Madrid, Spain. Applied Geography, 31(2), 650–667. doi: 10.1016/j.apgeog.2010.11.002
- Loveland, T. R., Reed, B. C., Brown, J. F., Ohlen, D. O., Zhu, Z., Yang, L., et al. (2000). Development of a global land cover characteristics database and IGBP DISCover from 1 km AVHRR data. International Journal of Remote Sensing, 21(6–7), 1303–1330. doi: 10.1080/014311600210191
- de Lucio, R. L. (2003). Transformaciones territoriales recientes en la región urbana de Madrid. Urban, 1(8), 124–161.
- Ménard, A., & Marceau, D. J. (2012). Exploration of spatial scale sensitivity in geographic cellular automata. Environment and Planning B: Planning and Design, 32(5), 693–714. doi: 10.1068/b31163
- Rocha, W. P., Delgado, M. G., & Sendra, J. B. (2009). Cambios de usos del suelo y expansión urbana en la Comunidad de Madrid (1990–2000). Scripta Nova. Revista Electrónica de Geografía y Ciencias Sociales, 13, 281–309.
- Romano, B., & Zullo, F. (2012). Land Urbanization in Central Italy 50 years of evolution. Journal of Land Use Science (ahead-of-print), 1–22. doi:10.1080/1747423X.2012.754963
- Samat, N. (2006). Characterizing the scale sensitivity of the cellular automata simulated urban growth: A case study of the Seberang Perai Region, Penang State, Malaysia. Computers, Environment and Urban Systems, 30(6), 905–920. doi: 10.1016/j.compenvurbsys.2005.11.002
- Siedentop, S., & Meinel, G. (2004). CORINE Land Cover 2000 in nation-wide and regional monitoring of urban land use and land consumption. Paper presented at the Berlin, UBA-Texte Workshop CORINE Land cover.
- Skokanová, H., Havlíček, M., Borovec, R., Demek, J., Eremiášová, R., Chrudina, Z., et al. (2012). Development of land use and main land use change processes in the period 1836–2006: case study in the Czech Republic. Journal of Maps, 8(1), 88–96. doi: 10.1080/17445647.2012.668768
- Turner, B. L., Clark, W. C., Kates, R. W., Richards, J. F., Mathews, J.T., and Meyer, W. B. (1990). The earth as transformed by human action: Global and regional changes in the biosphere over the past 300 years. CUP Archive.
- Turner, B. (2001). Land-use and land-cover change: Advances in 1.5 decades of sustained international research. GAIA-Ecological Perspectives in Science, Humanities, and Economics, 10(4), 269–272.
- Turner, B. L., & Meyer, W. B. (1994). Global land-use and land-cover change: An overview. Changes in Land Use and Land Cover: A Global Perspective, 4, 3.
- Veldkamp, A., & Verburg, P. H. (2004). Modelling land use change and environmental impact. Journal of Environmental Management, 72(1), 1–3. doi: 10.1016/j.jenvman.2004.04.004
- White, R., & Engelen, G. (1993). Cellular automata and fractal urban form: A cellular modelling approach to the evolution of urban land-use patterns. Environment and Planning A, 25, 1175–1175. doi: 10.1068/a251175