
Abstract
This work aimed at setting up a multivariate and geostatistical methodology to map viticultural terroirs at the province scale (1:125,000). The methodology is based upon the creation of a GIS storing all the viticultural and oenological legacy data of experimental vineyards (1989–2009), long-term climate data, digital elevation model, soilscapes (land systems) and legacy data of soil profiles.
Environmental parameters related to viticulture, selected by an explorative PCA, were: elevation, mean annual temperature, mean soil temperature, annual precipitation, clay, sand and gravel content of soils, soil water availability, redoximorphic features and rooting depth.
The variables interpolated using geostatistical methods, were used for a k-means clustering aimed to map the Natural Terroir Units (NTU). Vineyards of the province of Siena was subdivided into 9 NTU.
Both the historical DOCG (Chianti Classico, Brunello di Montalcino and Nobile di Montepulciano) and other DOCs were characterized by three or four NTU, whereas the wider Chianti and Chianti Colli senesi DOCG was mainly constituted by seven NTU.
Keywords:
1. Introduction
The terroir concept possesses many definitions, all based on the interaction between soil, geology, climate, agro-ecosystems landscape, historical and sociological aspects (Carbonneau, Citation2002; Deloire, Vaudour, Carey, Bonnardot, & Van Leeuwen, Citation2005; Vaudour, Citation2003). Terroir can be loosely defined as ‘taste of territory,’ embodying certain characteristic qualities, which are the sum of the effects that the territory has on the final product. Man has geared agricultural husbandry and processing technologies to the particular natural environmental conditions to maximize the quality of food and confer it peculiarity and exclusivity (Costantini & Bucelli, Citation2008). This concept has been applied as the Geographical Typical Indication and the Protected Appellations of Origin (D.O.P. in Europe) for many agricultural products, or ‘Appelation d'Origine Contrôlée’ (AOC, France), ‘Denominacíon de Origen’ (DO, Spain) and ‘Denominazione di Origine Controllata’ (DOC and DOCG, Italy) in the case of wine. However most appellation boundaries have been established based on administrative borders.
The current official definition of viticultural terroir (O.I.V., Citation2010) states: ‘terroir is a concept which refers to an area in which collective knowledge of the interactions between the identifiable physical and biological environment and applied vitivinicultural practices develops, providing distinctive characteristics for the products originating from this area’. Terroir includes specific soil, topography, climate, landscape characteristics and biodiversity features.
Laville (Citation1993) introduced the concept of the ‘Natural Terroir Units’ as ‘a volume of the Earth's biosphere that is characterized by a stable group of values relating to the topography, climate, substrate and soil’.
Methods to study the association between soil-climate-vines are numerous (Carey, Saayman, Archer, Barbeau, & Wallace, Citation2008; Jones, Snead, & Nelson, Citation2004; Martínez-Vidaurre, Pérez-Álvarez, Martín, Peregrina, & García-Escudero, Citation2012; Tomasi, Belvini, Pascarella, Silviotti, & Giulivo, Citation2006; Van Leeuwen et al., Citation2004), but the main questions are always: which variables are actually important for the quality and the typicality of grapevines, and then wine? How many terroir units can describe a territory?
Environmental functional parameters for grapevines vary according to the territory scale of the evaluation (Van Leeuwen, Bois, De Resseguier, Pernet, & Roby, Citation2010; Vaudour, Citation2002). The choice of mapping scale depends on environmental and viticultural data availability, but also on the objective pursued. In practice, the scale of terroir mapping is a compromise between the required precision and the available data.
In this work, we present a map of the Natural Terroir Units (NTU) of the province of Siena, based on a multivariate and geostatistical approach at province scale (1:125,000 scale). The NTU mapping shows the variability of the environments and soilscapes within the DOC and DOCG territories.
2. Materials and methods
2.1. Study area
The study area was the province of Siena, situated in Tuscany (Central Italy), which produces many of the most important DOC (Denominazione di Origine Controllata) and DOCG (Denominazione di Origine Controllata e Garantita) wines. The province extends for 3821 km2 in central-southern Tuscany (Central Italy) and has about 250,000 inhabitants. Agricultural lands cover about 55% of the territory, whereas woodlands are about 30%. Viticulture is the most important agricultural activity. Five DOCG districts are placed in the province: ‘Vernaccia di San Gimignano’ (the only DOCG white wine), ‘Chianti Classico’, ‘Chianti Colli Senesi’, ‘Vino Nobile di Montepulciano’, ‘Brunello di Montalcino’ (). Twelve DOC are also situated in the province (Terre di Casole, Grance Senesi and Orcia among others).
Figure 1. Topographic sketch of the province of Siena, with red wines DOC (ORC, Orcia; GRS, Grance senesi; CAS, Terre di Casole) and DOCG areas (BRU, Brunello di Montalcino; NOB, Nobile di Montepulciano; ChS, Chianti and Chianti Colli Senesi; ChC, Chianti Classico). The area of Chianti Colli Senesi DOCG included the areas of Brunello di Montalcino DOCG and a large part of the Nobile di Montepulciano DOCG.
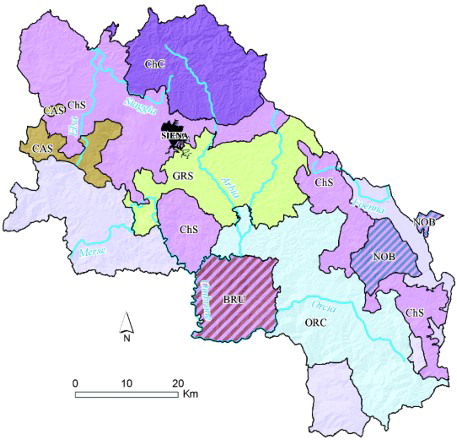
The most important grapevine cultivar of the province is Sangiovese, which represents about 67% of the total vineyards (Calò, Gaeta, Zavaglia, & Antoniazzi, Citation2008). Moreover, Sangiovese is the main, or in some cases the unique, cultivar for all the red wine DOC-DOCG of the province. Other important cultivars are Merlot (9.5%) and Cabernet Sauvignon (9.3%). The most important white grape cultivars are Vernaccia di San Gimignano (0.9%), Trebbiano Toscano bianco (0.8%) and Malvasia Bianca (0.5%).
The climate, typically Mediterranean, is strongly influenced by the variable topography, with elevation ranging from ∼100 m a.s.l. (alluvial plains) to 1700 m a.s.l. (Mount Amiata), with the Chianti and Cetona mountains at nearly 1000 m a.s.l. The mean elevation varies between 160 and 600 m a.s.l. in a hilly landscape.
The lower mean annual temperature is located around Mount Amiata (9–12°C), whereas the higher mean annual temperatures (14–14.5°C) are located in the Elsa, Arbia, Ombrone and Orcia river valleys. Long-term annual precipitation ranges between 630 (Orcia and Arbia rivers valleys) to 1275 mm (Mount Amiata).
The landscape is characterized by two NW-SE ridges; the Montagnola Senese ridge to the west and the Chianti-Rapolano-Mount Cetona ridge to the east. The ridges are separated by a large basin with scarce relief which separates the major basin into three sub-basins; the Elsa river basin, Casino basin and Siena-Radicofani basin. Two other basins, the Valdichiana and Chiusdino basins, are located in the south-eastern part of the Chianti ridge and on the western part of the Montagnola Senese ridge.
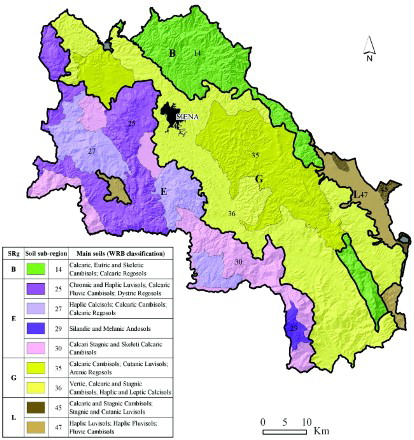
According to Costantini et al. (Citation2013), the province is subdivided into four soil regions (SRg, ): SRg B, soils of the Appennines with temperate climate (Calcaric, Eutric and Skeletic Cambisols, Calcaric Regosols, Calcaric Leptosols), in the Chianti hills; SRg E, soils of the central and southern Appennines (Chromic and Haplic Luvisols, Calcaric Fluvic Cambisols, Dystric and Calcaric Regosols, Silandic and Melanic Andosols) in the western part of the province; SRg G, soils of the hills of central and southern Italy formed on Neogene marine deposits and limestones (Vertic, Calcaric and Stagnic Cambisols, Arenic Regosols, Cutanic Luvisols, Leptic Calcisols), along the central basin; SRg L, soils of the plains and low hills of central and southern Italy (Calcaric, Stagnic and Fluvic Cambisols, Haplic and Cutanic Luvisols, Haplic Fluvisols), in the Valdichiana basin.
Figure 2. Soil regions and sub-regions of the province of Siena (Costantini et al., Citation2013, modified).
The main map derived from legacy data of the previous studies of Costantini, Pellegrini, Vignozzi, and Barbetti (Citation2006a; Costantini et al., Citation2006b), aimed at viticultural zoning of the province of Siena and soil suitability for the Sangiovese cultivar grapevine.
2.2. Multivariate approach of the experimental vineyards features
Legacy viticultural data of 55 experimental sites, with the Sangiovese cultivar, within the province of Siena were collected. These data belong to several projects of viticultural zoning at different scales and date between 1989 and 2009 (Costantini et al., Citation1996, Citation2006b, 2010; Priori et al., Citation2013); they monitored a minimum of 3 vintages. The selected viticultural parameters were: (a) Brix, must sugar content in degrees Brix.; (b) Brix/day, sugar accumulation rate from veraison to harvest; (c) Tacid, Must titratable acidity as tartaric acid g L−1; (d) GYV, Grape yield per vine in kg; (e) nBV, number of bunches for vine; (f) MBW, mean bunch weight in g; and (g) 100 bW, mean weight of 100 berries in g.
Each experimental site had morphological characterization (elevation, slope, curvature and aspect) and pedological information of the reference profile. Each reference profile was described and sampled by a soil profile or, in several cases, by a soil augering. The soil samples were analyzed following Italian standard methods (Mi.P.A.F, 1997, 2000).
The climatic data of the experimental sites were obtained from the maps of mean annual temperature (MAT), annual precipitation (AP), Winkler index (WI) and mean soil temperature (MST). The interpolation of the climatic data was performed by Costantini et al. (Citation2006b).
To investigate the relationships between soil, morphology, climate, pedoclimate and viticultural features, a multivariate approach was chosen. Two exploratory Principal Component Analyses (PCA) were performed: the first relating climate, pedoclimate and morphological features with the viticultural data; the second between the main soil features and viticultural data. The factors chosen for the data processing were the factors that explained more than 10% of the total variance. The two PCAs demonstrated which environmental features were better related to the viticultural parameters of the experimental farms. The variables with a factor loading higher than 0.5 (in absolute value) were selected as explanatory variables for the terroir mapping model.
2.3. Geostatistical analysis
The maps of slope and topographic wetness index (TWI) were calculated from a digital elevation model (DEM; 20 × 20 m) of the Tuscany region. TWI is a compound terrain attribute calculated from the DEM, using the algorithm of Böhner et al. (Citation2001). Several studies validate the usefulness of the index, which was not only used to study hydrological processes, but also to estimate soil attributes such as texture (Moore, Gessler, Nielsen, & Peterson, Citation1993), soil chemistry (Johnson, Méndez, & Lawrence, Citation2000) and organic matter (Moore et al., Citation1993; Tao et al., Citation2010). In this work, TWI was used as an auxiliary variable during the interpolation modelling of pedological parameters, as reported later. With respect to elevation and slope data, these indices summarize information about the local morphology, such as curvature, concavities, steps, flat surfaces, etc.
A Geographic Information System (GIS), storing different thematic layers, was set up for the whole province. A geodatabase of the soils of the province was built using 1425 soil observations (724 profiles) and the ‘Land Systems’ of the Tuscany region. The soil observations had field description and laboratory data.
The land units of the ‘Land Systems’ are polygons delineated by photo-interpretation and represents a particular association of land elements, the smallest landscape components classified according to lithology, geomorphology and land use. The land elements are characterized by one or more Soil Typological Units (STU).
As reported later, the maps of soil features, selected by the previous exploratory PCA, were: clay, sand, coarse fragments content, available water capacity (AWC), rooting and redoximorphic mottles depths.
The interpolation of soil features was performed based on the land systems polygons (1:100,000), the information of the soil observations database (1425 observations) and the TWI. The spatial structures of the pedological variables were modelled using a linear model of coregionalization (LMC; Journel and Huijbregts, Citation1978), which considers all the studied variables and their spatial correlation, as described by Castrignanò, Costantini, Barbetti, and Sollitto (Citation2009).
The data used for the interpolation were normalized by Gaussian anamorphosis modelling, to apply parametric geostatistics. Gaussian anamorphosis is a polynomial function that transforms a variable Z in to a new variable Y with a Gaussian distribution (Chilès & Delfiner, Citation1999). Three geostatistical methods were tested for the interpolation of the selected pedological parameters: regression kriging (RK) using TWI as the predictive variable (Hengl et al., 2004), simple kriging with varying local means (SKLM) using the mean values of the land systems as a secondary variable (Castrignanò et al., Citation2009) and multicolocated simple cokriging with varying local mean (MSCLM), using both TWI and the mean values of land systems (Rivoirard, Citation2001). The RK method was more influenced by the TWI grid, SKLM did not take in account any grid, but only the land systems polygons, MSCLM was influenced both by the TWI and the land systems polygons. The geostatistical methods, chosen on the basis of the lowest mean error (ME), were:
- RK to interpolate rooting depth;
- SKLM, to interpolate coarse fragments and redoximorphic mottles depth;
- MSCLM, to interpolate AWC, clay and sand content;
The map of viticultural areas within the province was extracted from the Corine Land Cover 2006. The viticultural areas grouped the polygons with the following land uses: vineyards, olive tree groves and complex cultivation patterns. The latter is common in the province and depicts mixed cultivation of olive trees, vineyards, orchards and small arable lands of the smaller farms. Olive tree groves were included in the viticultural areas because this cultivation is often mixed with vinegrapes and sometimes replaced vineyards.
2.4. K-means clustering and NTU mapping
A k-means cluster analysis was performed in the viticultural areas, using the selected variable maps (mean annual temperature, mean annual precipitation, mean annual soil temperature, elevation, clay, sand, coarse fragment content, available water capacity, rooting and redoximorphic mottles depths) standardized from 0 to 1. The maps of the soil features and of the climatic, pedoclimatic and morphological data were clipped to the viticultural areas map. The clipped maps were used in the k-means clustering to determine the Natural Terroir Units. The right number of clusters was set after a V-fold cross-validation, using the smallest percentage decrease of cost function in the scree plot >2%. The squared Euclidean distance, which is a geometric distance in multidimensional space, was calculated between the NTU to determine their similarity.
3. Results and discussion
The soil features () showed high variance, especially for texture, gravel content and CaCO3. In particular, the pedo-hydrological features, namely AWC, redoximorphic mottles depth and rooting depth showed high standard deviation and high CV%. These data demonstrated the strong soil variability of the vineyards within the province.
Table 1. Descriptive statistics of the experimental vineyards (n = 55).
The results of the PCA are presented in . The two exploratory PCA demonstrated that, using a multivariate approach, the variables more correlated with the mean viticultural parameters were sand, clay, gravel content, AWC, rooting depth and redoximorphic mottles depth for the soil, and elevation (H), annual precipitation (AP), mean annual temperature (MAT), mean annual soil temperature (MST) and Winkler index (WI) for the climate, pedoclimate and morphology. These last two variables (MAT and WI) were very strongly correlated (r = 0.96), therefore we decided to select just the mean annual temperature.
Table 2. Exploratory PCA factor loadings and explained variance. The factor loadings positive and >0.5 are highlighted in dark grey, the negative <−0.5 in pale grey.
The pedological variables selected by the PCA related to physical and hydrological soil features. Clay, sand and gravel content constitute the physical characteristics of the soil, AWC the maximum available water for the plant and rooting depth the volume of the soil that is explorable by the roots. Redoximorphic mottles depth is inversely related to drainage, since, in general, shallower mottles leads to slower drainage and more frequent waterlogging. All the interpolated maps show high precision and low errors, as reported in .
Figure 3. Maps of the pedological variables used for the NTU mapping. Each map showed the interpolation method (MSCLM, Multicollocated Simple Cokriging with varying Local Means; SKLM, Simple Kriging with varying Local Mean; RK, Regression Kriging) and the errors (ME, Mean error and MSSE, Mean Standardize Squared Error).
The six maps of soil features (clay, sand, gravel content, AWC, redoximorphic mottles and rooting depths) and the four maps of climatic, pedoclimatic and morphological data (MAT, MST, AP and H), masked for the viticultural areas, were used for the k-means clustering, (). According to the V-fold cross validation, the maximum number of cluster groups significantly differentiated was 9. The mean values of the variables in the 9 NTU are presented in . NTU numbers are related to elevation, with NTU 1 and 2 the lowest terroirs, with NTU 8 and 9 at a higher altitude. Clearly, the MAT and MST reflected the altitude trend, therefore NTU 1 and 2 are the warmest and 8 and 9 the coldest. NTU 3, 6 and 9 show the highest annual precipitation (>800 mm), whereas the others have an AP of about 700–750 mm.
Figure 4. Maps used for the k-means clustering to obtain the Natural Terroirs Units (NTU) map of the province of Siena.
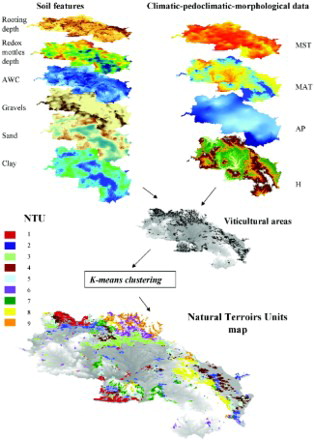
Figure 5. Mean values of the variables used for the clustering in each NTU.
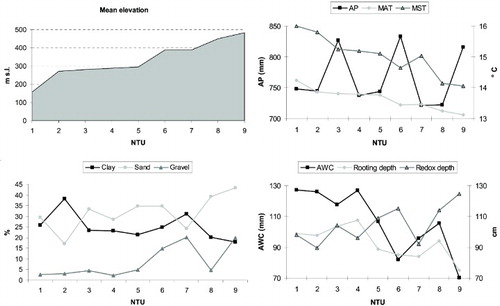
From a pedological perspective, NTU 2 and 7 have the highest clay content and the lowest internal drainage (redoximorphic mottles depth of about 90 cm). The most sandy soils are in NTU 8 and 9, whereas the more gravelly are in NTU 6, 7 and 9. The highest soil AWC are NTU 1, 2, 3 and 4, the lowest in NTU 6 and 9. NTU 9 also has the shallowest soils (rooting depth <75 cm) and the highest internal drainage. The Squared Euclidean distances between the NTU showed that the lowest differentiations between the NTU in multidimensional space were between NTU5–NTU7 (0.35), NTU4–NTU7 (0.39) and NTU4–NTU5 (0.45). Therefore terroirs NTU4, NTU5 and NTU7 were less differentiated between themselves than with respect to the others.
The pie-charts () show the NTU distribution within the four red wines DOCG of the province of Siena (Chianti Classico, Chianti - Chianti Colli Senesi, Brunello di Montalcino and Nobile di Montepulciano), as well as the red wines DOC and non-DOC areas, and demonstrate the variety of their terroirs.
Figure 6. Distribution in percentage of the NTUs in the main DOC and DOCG of the province of Siena. The dark grey polygons of the map show the viticultural areas. The area of Chianti & Chianti Colli Senesi includes the area of Brunello di Montalcino and Nobile di Montepulciano.
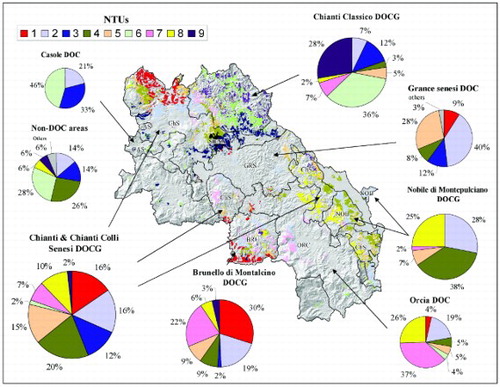
The historical DOCG areas, namely ‘Chianti Classico’, ‘Nobile di Montepulciano’ and ‘Brunello di Montalcino’ were characterized by 2 or 3 main NTU (). Chianti Classico DOCG was mainly characterized by NTU6 and 9, which filled 64% of the total viticultural area (about 13,700 ha). In Brunello di Montalcino territory, NTU1, 2 and 7 filled 71% of the total area (about 5700 ha), whereas Nobile di Montepulciano was mostly characterized by NTU2, 4 and 8, which was about 90% of the area (about 5200 ha).
Chianti and Chianti Colli Senesi DOCG, which were widespread in many areas of the province and included the territory of Brunello di Montalcino and Nobile di Montepulciano, showed all the NTU, but the most common were NTU1, 2, 3, 4 and 5.
The other DOC, namely Terre di Casole, Grance senesi and Orcia, showed a good typicality, as long as they were mainly characterized by 3 NTU. On the other hand, the viticultural areas of these DOC are much less wide and span between 500 ha (Casole DOC) to 4000 ha (Orcia DOC). The non-DOC areas were poorly characterized by typical terroirs, although the most common were NTU2, 3, 4 and 6.
4. Conclusions
The 1:125,000 viticultural zoning of the province of Siena showed 9 Natural Terroir Units (NTU), discriminated on the basis of elevation, mean annual temperature, mean soil temperature, annual precipitation, clay, sand and gravels content, soil water availability, soil internal drainage (redoximorphic mottles depth) and rooting depth. The multivariate statistical analysis (PCA) demonstrated the relationships between these environmental variables and the viticultural features.
The historical DOCG, namely Chianti Classico, Brunello di Montalcino and Nobile di Montepulciano, and the DOC Casole, Grance Senesi and Orcia showed 2 or 3 terroirs for more than 70% of the total viticultural areas. Chianti and Chianti Colli Senesi DOCG, which were widespread in the province showed six main terroirs.
Identification and mapping of terroir diversity within the DOC and DOCG at the province scale suggest the adoption of viticultural subzones. The subzones, based on the NTU, could highlight different wine-production systems that enhanced the peculiarities of the terroir. Although the NTU map was at province scale, it could be also used by the larger wineries, to understand and value the heterogeneity of their own vineyards.
Software
The statistical exploratory analysis was performed using StatSoft Statistica 10. The identification of soil features was performed using Geovariances Isatis 9.0. Raster grid calculations including Topographic Wetness Index (TWI), Principal Component Analysis (PCA) and the k-means cluster analysis were performed using the SAGA (System for Automated Geoscientific Analyses). The final map and other reference grids were produced using Esri ArcGIS 10.
Main Map: Natural Terroir Units, Siena Province, Tuscany
Download PDF (3.9 MB)References
- Böhner, J., Koethe, R., Conrad, O., Gross, J., Ringeler, A., & Selige, T. (2001). Soil regionalisation by means of terrain analysis and process parameterisation. In E. Micheli, F. Nachtergaele, & L. Montanarella (Eds.), Soil classification 2001 (pp. 213–222). European Soil Bureau, Research Report No. 7, EUR 20398 EN, Luxembourg.
- Calò, A., Gaeta, D., Zavaglia, C., & Antoniazzi, M. (2008). Evoluzione del vigneto in Italia, volume II. Ministero delle Politiche Agricole e Forestali – CRA, Centro di Ricerca per la Viticoltura, Conegliano (TV), ed. Tipse (TV), 407 pp.
- Carbonneau, A. (2002). Méthodes de zonage relatives à la plante. Une introduction. In: Proc. 4° Int. Symp. ‘Viticultural zoning’, June 2002, Avignon (France).
- Carey, V. A., Saayman, D., Archer, E., Barbeau, G., & Wallace, M. (2008). Viticultural terroirs in Stellenbosch, South Africa. The identification of natural terroir units. Journal International des Sciences de la Vigne et du Vin, 42(4), 169–183.
- Castrignanò, A., Costantini, E. A. C., Barbetti, R., & Sollitto, D. (2009). Accounting for extensive topographic and pedological secondary information to improve soil mapping. Catena, 77(1), 28–38. doi: 10.1016/j.catena.2008.12.004
- Chilès, J. P., & Delfiner, P. (1999). Geostatistics: Modelling spatial uncertainty. New York: Wiley.
- Costantini, E. A. C., Barbetti, R., Bucelli, P., Cimato, A., Franchini, E., L'Abate, G., … Vignozzi, N. (2006b). Zonazione viticola ed olivicola della provincia di Siena. Grafiche Boccacci editor, Colle Val d'Elsa, Siena (Italy), 224 pp.
- Costantini, E. A. C., & Bucelli, P. (2008). Suolo, vite ed altre colture di qualità: l'introduzione e la pratica dei concetti ‘terroir’ e ‘zonazione’. Italian Journal of Agronomy, 1(Suppl.), 23–33.
- Costantini, E. A. C., Campostrini, F., Arcara, P. G., Cherubini, P., Storchi, P., & Pierucci, M. (1996). Soil and climate functional characters for grape ripening and wine quality of Vino Nobile di Montepulciano. Acta Hort. ISHS, 427, 45–55.
- Costantini, E. A. C., L'Abate, G., Barbetti, R., Fantappié, M., Lorenzetti, R., & Magini, S. (2013). Carta dei suoli d'Italia, scala 1:1.000.000. http://abp.entecra.it/soilmaps/download
- Costantini, E. A. C., Pellegrini, S., Bucelli, P., Barbetti, R., Campagnolo, S., Storchi, P., … Perria, R. (2010). Mapping suitability for Sangiovese wine by means δ13C and geophysical sensors in soils with moderate salinity. European Journal of Agronomy, 33, 208–217. doi: 10.1016/j.eja.2010.05.007
- Costantini, E. A. C., Pellegrini, S., Vignozzi, N., & Barbetti, R. (2006a). Micromorphological characterization and monitoring of internal drainage in soils of vineyards and olive groves in central Italy. Geoderma, 131, 388–403. doi: 10.1016/j.geoderma.2005.03.029
- Deloire, A., Vaudour, E., Carey, V., Bonnardot, V., & Van Leeuwen, C. (2005). Grapevine responses to Terroir: a global approach. Journal International des Sciences de la Vigne et du Vin, 39–44, 149–162.
- Hengl, T., Heuvelink, G.B.M., Stein, A. (2004). A generic framework for spatial prediction of soil variables based on regression-kriging. Geoderma, 120(1–2), 75–93.
- Johnson, C. E., Méndez, J. J. R., & Lawrence, G. B. (2000). Forest soil chemistry and terrain attributes in a catskills watershed. Soil Science Society of America Journal, 64, 1808–1814.
- Jones, G. V., Snead, N., & Nelson, P. (2004). Geology and wine 8. Modeling viticultural landscapes: a GIS analysis of terroir potential in the Umpqua Valley of Oregon. Geoscience Can, 31, 167–178.
- Journel, A. G., & Huijbregts, C. J. (1978). Mining geostatistics. New York: Academic Press.
- Laville, P. (1993). Unités de terroir naturel et terroir. Une distinction nécessaire pour redonner plus de cohérence au système d'appellation d'origine. Bull. O.I.V., 745–746, 227–251.
- Martínez-Vidaurre, J. M., Pérez-Álvarez, E. P., Martín, I., Peregrina, F., & García-Escudero, E. (2012). Terroir characterization according to soil influence in Uruñela vine growing area (AOC Rioja, Spain): influence on acidity components in musts and wines. Proceedings of IXe International Terroirs Congress, Bourgogne-Dijon-Champagne-Reims, France 25–29 June 2012, 4/51–4/58.
- Mi.P.A.F, Osservatorio nazionale pedologico e per la qualità del suolo. (1997). Metodi di analisi fisica del suolo. Franco Angeli editor, Milan, Italy, booklet.
- Mi.P.A.F, Osservatorio nazionale pedologico e per la qualità del suolo. (2000). Metodi di analisi chimica del suolo. Franco Angeli editor, Milan, Italy, booklet.
- Moore, I. D., Gessler, P. E., Nielsen, G. A., & Peterson, G. A. (1993). Soil attribute prediction using terrain analysis. Soil Science Society of American Journal, 57(2), 443–452. doi: 10.2136/sssaj1993.03615995005700020026x
- O.I.V. (2010). Definition of viticultural ‘terroir’. Resolution OIV/Viti 333/2010.
- Priori, S., Martini, E., Andrenelli, M. C., Magini, S., Agnelli, A. E., Bucelli, P., … Costantini, E. A. C. (2013). Improving wine quality through harvest zoning and combined use of remote and soil proximal sensing. Soil Science Society of American Journal, 77(4), 1338–1348. https://www.soils.org/publications/search?search[-3]=&searchType[-3]=Any&search[-2]=priori&searchFields[-2][Author]=Author&searchType[-2]=Phrase&search[-1]=&searchFields[-1][Title]=Title&searchType[-1]=Phrase&volume=&issue=&year=&first-page=&journal[sssaj]=sssaj&search[0]= doi: 10.2136/sssaj2012.0376
- Rivoirard, J. (2001). Which models for collocated cokriging. Mathematical Geology, 33, 117–131. doi: 10.1023/A:1007530600152
- Tao, P., Cheng-Zhi, Q., A-Xing, Z., Lin, Y., Ming, L., Baolin, L., & Chenghu, Z. (2010). Mapping soil organic matter using the topographic wetness index: A comparative study based on different flow-direction algorithms and kriging methods. Ecological Indicators, 10(3), 610–619. doi: 10.1016/j.ecolind.2009.10.005
- Tomasi, D., Belvini, P., Pascarella, G., Silviotti, P., & Giulivo, C. (2006). Performance of cabernet sauvignon, cabernet franc and merlot as affected by soil characteristics. Vignevini, 33, 59–65.
- Van Leeuwen, C., Bois, B., De Resseguier, L., Pernet, D., & Roby, J. P. (2010). New methods and technologies to describe the environment in terroir studies. Proceedings of VIII International Terroirs Congress, June 14–18th 2010, Soave, Verona (Italy).
- Van Leeuwen, C., Friant, P., Choné, X., Tregoat, O., Koundouras, S., & Dubourdieu, D. (2004). The influence of climate, soil and cultivar on terroir. Am. J. Enol. Vitic., 55(3), 207–217.
- Vaudour, E. (2002). The quality of grapes in relation to geography: Notions of terroir at various scales. Journal of Wine Research, 132, 117–141. doi: 10.1080/0957126022000017981
- Vaudour, E. (2003). Les terroirs viticoles. Paris: Dunond, pp. 295.