
Abstract
This paper presents a glacial geomorphological map of the landforms created by five large ice lobes that extended eastwards from the southernmost reaches of the Patagonian Ice Sheet during the Quaternary period. The study is focussed on Tierra del Fuego, but also updates previous mapping of the Skyring and Otway lobes, and the resulting level of detail and extent is a significant advance on previous work in the region. The map has been created as the necessary precursor for an improved understanding of the glacial history of the region, and to underpin a programme of dating glacial limits in the region. It was produced using Landsat ETM+ and ASTER satellite imagery and vertical aerial photography, supplemented by Google Earth™ imagery and field-checking. Eleven landform types were mapped: moraine ridges, subdued moraine topography, kettle-kame topography, glacial lineations, irregular and regular hummocky terrain, irregular dissected ridges, eskers, meltwater channels, former shorelines and outwash plains. The map reveals three important characteristics of the glacial geomorphology. First, the geomorphic systems are largely dominated by landforms associated with meltwater (channels, outwash plains and kettle-kame topography). Second, there is a difference in the nature of landforms associated with the northern three ice lobes, where limits are generally marked by numerous clear moraine ridges, compared to those to the south, where hummocky terrain and drift limits prevail. Finally, cross-cutting landforms offer evidence of multiple advances, in places, which has implications for the timing of limit deposition, and thus for the design and interpretation of a dating programme.
1. Introduction
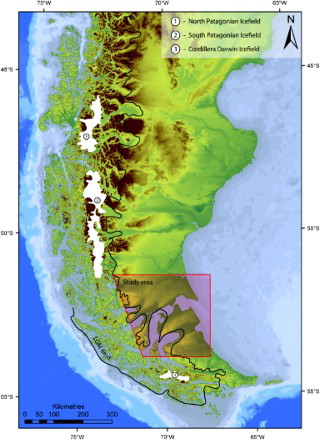
Patagonia contains some of the longest and best-preserved records of glaciation in the world (Clapperton, Citation1993). Contemporary glaciation in the region is restricted to three ice caps: the North and South Patagonian and Cordillera Darwin Icefields (). However, it has been demonstrated that these advanced and coalesced at various times during the Quaternary, as part of an extensive Patagonian Ice Sheet (PIS) centred on the southern Andes (Caldenius, Citation1932; Coronato, Martínez, & Rabassa, Citation2004; Glasser, Jansson, Harrison, & Kleman, Citation2008; Meglioli, Citation1992; Rabassa, Citation2008). Given its location in a region heavily influenced by important atmospheric and oceanic circulation systems, such as the Southern Westerly Winds and the Antarctic Circumpolar Current, Patagonia has received increasing attention in recent decades because it may yield insight into the mechanisms of climatic change in the southern hemisphere (Ackert et al., Citation2008; Boex et al., Citation2013; Kaplan et al., Citation2008; Moreno et al., Citation2009; Murray et al., Citation2012; Strelin Denton, Vandergoes, Ninnemann, & Putnam, 2011) and help in understanding interhemispheric glacial (a)synchrony (García et al., Citation2012; Moreno, Jacobson, Lowell, & Denton, Citation2001; Sugden et al., Citation2005). Combined with the numerous palaeoenvironmental records that now exist across Patagonia, the timing and pattern of glacial changes may be used to infer changes in past climate (Kilian & Lamy, Citation2012; Moreno, Villa-Martínez, Cárdenas, & Sagredo, Citation2012; Sugden et al., Citation2005).
Figure 1. Location of the study area in southernmost Patagonia (topography shown using shaded SRTM and ETOPO data). Also shown are the present day icefields (numbered) and the Last Glacial Maximum (LGM) limit according to Caldenius (Citation1932); adapted from Singer et al. (Citation2004a).
Extending these investigations beyond the Last Glacial Maximum (LGM), however, has thus far proven problematic for the southernmost parts of the region. This is partly due to the lack of a comprehensive mapping of glacial landforms at an appropriate scale (>30 m resolution) and coverage (regional rather than local), and partly due to uncertainties in existing chronological data (Kaplan et al., Citation2007). As such, the aim of this study is to produce a comprehensive map of the glacial geomorphology deposited by the southernmost ice lobes of the PIS that builds on and extends previous work in terms of detail and coverage (Section 1.1.1). The map (see Main Map in Supplementary Material) is designed to enable a refined reconstruction of the glacial history of the region using glacial inversion techniques (Kleman et al., Citation2006) and will be used as the foundation for dating glacial limits in the area, particularly the enigmatic pre-LGM limits that have thus far proven contentious (Section 1.1.2).
1.1. Study area and previous work
1.1.1. Previous mapping
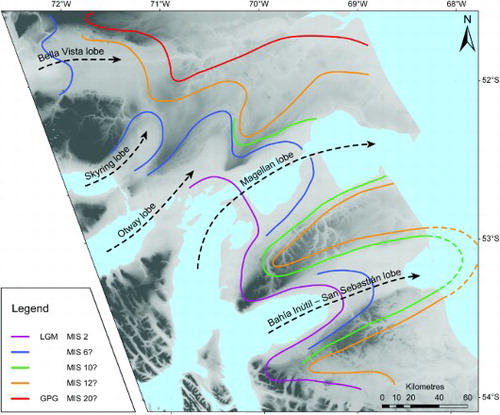
This mapping focuses on an area into which the five southernmost ice lobes (the Bahía Inútil-San Sebastián (BI-SSb), Magellan, Otway, Skyring and Río Gallegos lobes; ) advanced from the main PIS. Previous work suggests that these lobes were substantially more extensive compared to others in Patagonia (Caldenius, Citation1932). Early work by Nordenskjold (Citation1899) and Bonarelli (Citation1917) suggested that Patagonia had been previously glaciated – possibly several times – but it was the seminal work of Caldenius (Citation1932) that first extensively mapped the glacial geomorphology of the region and suggested that several different stages of glaciation were recorded by the nested nature of the geomorphological limits.
Figure 2. The location and previously hypothesised Marine Isotope Stage (MIS) chronology of drift limits within the study area (Meglioli, Citation1992; Rabassa et al., Citation2000; Singer et al., Citation2004a).
Subsequently, there have been several studies that have built upon this early mapping. Raedecke (Citation1978) produced a geomorphological map of the Chilean side of the BI-SSb lobe. It highlighted the complex nature of the geomorphology, describing thrust and en echelon moraines as well as bands of drift deposits, but the extent of mapping was limited to the central depression of the BI-SSb lobe. In contrast, Meglioli (Citation1992) mapped the surface features of the southernmost ice lobes at a much broader scale. The study focussed on drift and soil characterisation rather than glacial landforms, resulting in a map which could be considered a representation of surficial properties, rather than depicting glacial landforms. Nonetheless, this work established the current conceptual model for the pattern and timing of glaciations in the region using both relative and absolute dating techniques () and was summarised in Coronato et al. (Citation2004). More recently, Glasser and Jansson (Citation2008) produced an extensive geomorphological map of the whole Patagonian region. However, the nature of such large-scale mapping meant that the resolution was necessarily coarse and some of the subtle complexity in the geomorphology of individual ice lobes was not recorded.
In contrast to Glasser and Jansson's (2008) map, small regions of the hypothesised LGM geomorphology in the study area have been mapped in detail by Clapperton, Sugden, Kaufman, and McCulloch (Citation1995), McCulloch and Bentley (Citation1998), Benn and Clapperton (Citation2000), Bentley, Sugden, Hulton, and McCulloch (Citation2005) and Sagredo et al. (Citation2011). Bujalesky, Coronato, and Isla (Citation2001) also mapped an area of older glaciofluvial fans to the south of Bahía San Sebastián and Coronato, Ercolano, Corbella, and Tiberi (Citation2013) described the geomorphology surrounding the Aike maar, east of the Río Gallegos lobe. Additionally, Ercolano, Mazzoni, Vazquez, and Rabassa (Citation2004) described a drumlinised area within the Río Gallegos valley of the Río Gallegos lobe.
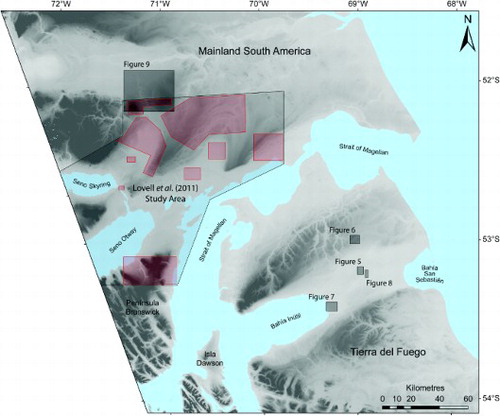
Lovell, Stokes, and Bentley (Citation2011) produced a map of the glacial geomorphology within the Otway and Skyring lobes region (area shown in ). It was the most detailed map produced of the area and was subsequently used to interpret the glacial dynamics of the ice lobes, including surge-like advances and the development of pro-glacial lakes during retreat (Lovell, Stokes, Bentley, & Benn, Citation2012).
Figure 3. Overview of the study area showing the locations of other figures. Also shown is the area mapped by Lovell et al. (Citation2011), with red boxes highlighting the key areas that have been updated.
1.1.2. Chronology of glacial limits
There is a widely adopted conceptual model for the pattern and timing of glaciations both across Patagonia and for the southernmost ice lobes. Caldenius (Citation1932) first proposed a series of progressively less-extensive, ‘nested’ limits across Patagonia, attributed to recession of ice following the LGM. Generally, this model of progressive retreat has withstood falsification by numerous studies. However, the outermost limit, now attributed to the Greatest Patagonian Glaciation (GPG), has been shown to be much older than the LGM, with 40Ar/39Ar dating of interbedded volcanic deposits giving ages of around 1100 ka at numerous locations within the former PIS (Meglioli, Citation1992; Mercer, Citation1976; Ton-That, Singer, Morner, & Rabassa, Citation1999; Singer et al., Citation2004a). Recent cosmogenic dating of outwash depth-profiles at Lago Pueyrredón, east of the North Patagonian icefield, further supports these old ages (Hein, Dunai, Hulton, & Xu, Citation2011). The inner nested limits have been attributed to advances during intervening glaciations prior to the LGM, largely using cosmogenic dating (Hein et al., Citation2009; Hein et al., Citation2010; Hein et al., Citation2011; Glasser et al., Citation2011; Kaplan, Douglass, Singer, & Caffee, Citation2005; Singer et al., Citation2004a; Singer et al., Citation2004b; Wenzens, Citation2006).
Work on the southern ice lobes has predominantly focussed on dating of the GPG and LGM limits and is framed within the conceptual model of Meglioli (Citation1992). The mapping of ‘drift’ characteristics, argon-dating and relative dating of clast weathering-rinds led Meglioli (Citation1992) to hypothesise that three further glaciations were recorded in the region between the GPG and the LGM (). Argon-dating suggested the outer of these was deposited between 1070 and 450 ka, whilst the two subsequent limits were not dated (Meglioli, Citation1992).
The LGM has been generally well-constrained using radiocarbon, amino-acid racemisation, optically stimulated luminescence and cosmogenic exposure dating (Blomdin et al., Citation2012; Clapperton et al., Citation1995; McCulloch, Fogwill, Sugden, Bentley, & Kubik, Citation2005; Meglioli, Citation1992; Porter, Citation1990; Rutter et al., Citation1989; Sagredo et al., Citation2011). However, studies focussing on the intervening glaciations have proven problematic (Evenson et al., Citation2009; Kaplan et al., Citation2007), likely due to the exhumation and erosion of erratic boulders used for cosmogenic dating. Future investigations of these processes will be informed by a better understanding of the glacial history of the region, based on geomorphological mapping rather than solely drift characterisation.
2. Map production
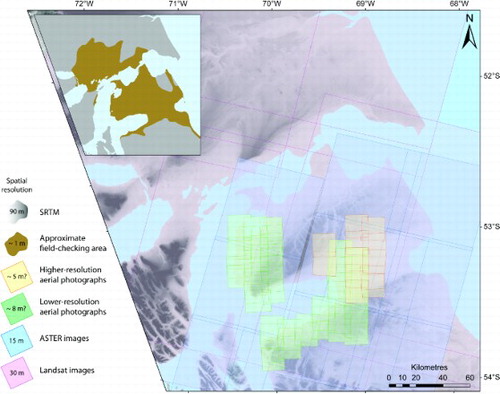
This map was produced using a combination of remote sensing analysis and field-checking, with multiple types (and resolutions) of imagery consulted to provide the most rigorous interpretation of the glacial geomorphology (). The central BI-SSb area is shown in an enlarged inset to help improve the clarity of the geomorphology in this lobe, which is substantially more complex than in the other lobes.
Figure 4. The spatial coverage of different imagery used during mapping. Inset shows the approximate area in which field-checking was conducted. Spatial (pixel) resolution of the different imagery is given in the key.
2.1. Imagery
Across the region, Landsat ETM+ scenes from the Global Land Cover Facility (GLFC; http://www.landcover.org) were used for mapping. These cover an area of 185 × 185 km and have a spatial resolution of 30 m (or 15 m in band 8). Landsat imagery was supplemented by Google Earth™ imagery (version 7, available from http://www.earth.google.com), consisting of 2013 Cnes/SPOT images and 2013 DigitalGlobe images (up to ∼5–15 m resolution). ASTER images from the NASA Land Processes Distributed Active Archive Centre (http://lpdaac.usgs.gov) were also used. These cover an area of 60 × 60 km, with a spatial resolution of 15 m.
Aerial photographs were used in preference to satellite imagery, where available, and revealed significant complexity that had been missed from some previous maps. A total of 76 vertical aerial photographs were used (12 digital with ∼5 m resolution; and 64 scanned hard copies with ∼8 m resolution; both from the Servicio Aerofotométrico del la Fuerza Aérea de Chile; ). Where aerial photographs were not available, Google Earth™ often provided imagery of only slightly lower resolution.
Shuttle Radar Topographic Mission (SRTM) data (3 arcsec data, 90 m resolution) from the GLFC depository were used to identify some features only visible as subtle changes in topography and to provide topographic context as a shaded relief greyscale background to the map.
Field seasons during 2012 and 2013 allowed cross-checking of features mapped from remote imagery, although it was not possible to cover the entire area in detail (∼80,000 km2) so fieldwork focused on key mapping elements ().
The study area includes an area around Seno Skyring and Seno Otway that was previously mapped by Lovell et al. (Citation2011; ), and their mapping is included and updated here for two reasons. Firstly, not doing so would leave a large gap in the final geomorphological map, making it difficult to assess the complete geomorphology across the region. Similar mapping criteria and styles have been adopted here as in Lovell et al. (Citation2011) to maintain consistency across the entire area. Secondly, extensive field-seasons in 2012 and 2013 have allowed field-checking of the previous work for the first time, and we have updated the mapping based on this ().
2.2. Geomorphological mapping
In total, 11 different glacial features were mapped as line and/or polygon symbols using ArcMap 10 software: moraine ridges, subdued moraine topography, kettle-kame topography, glacial lineations, irregular hummocky terrain, regular hummocky terrain, irregular dissected ridges, eskers, meltwater channels, former shorelines, and outwash plains. Lakes and prominent volcanic craters were also mapped to provide landscape context and because these systems have been used in previous dating studies in the region.
3. Glacial geomorphology
The glacial geomorphological features mapped in this study are summarised in in terms of their morphology, appearance and any uncertainties.
Table 1. Summary of the morphology, appearance and possible errors in mapping geomorphological features.
3.1. Moraine ridges
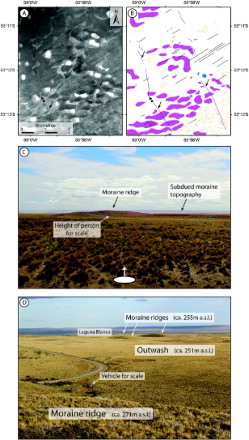
Moraine ridges are linear or curvilinear, elongate features exhibiting positive relief. They may be level-crested or undulating, continuous or fragmentary, but are distinguished by their linearity and consistency with formerly expanded ice margins. In places, they may overprint lineations (Section 3.4) and subdued moraine topography (Section 3.2; ), and can coincide with areas of kettle-kame topography (Section 3.3) and irregular hummocky terrain (Section 3.5). Ridges are often discontinuous, and it is rare to find complete lateral-terminal moraine systems, with the exception of the Otway lobe, where continuous ridges run for tens of kilometres. These features range from small, fragmentary crested ridges, often up to a few hundred metres long and less than 10 metres high (only visible on aerial photography and in the field in the BI-SSb and Magellan lobes; ), up to larger, continuous or semi-continuous hilly ridges, which are up to tens of kilometres long and tens of metres high, such as those delineating the Skyring and Otway lobes.
Figure 5. (A) Aerial photograph and (B) the mapped features in the central depression of the BI-SSb lobe. Thin, low moraine ridges (mapped as purple lines) are indicated by the black arrows and drape across the subdued moraine topography (mapped as pink polygons) and lineations (black lines). Locations shown in . (C) Field photograph of one of these moraine ridges draped over subdued moraine topography; location shown in (A) and (B) by black circle with arrow. (D) Field photograph of the larger moraines in the Skyring lobe, separated by expansive outwash. Heights in metres above sea level (a.s.l.) are shown for the moraines and outwash plain.
Much of what Glasser and Jansson (Citation2008) mapped as moraine ridges in the BI-SSb and Magellan lobes, we map as hummocky terrain or kettle-kame topography because they form wide areas of hilly terrain rather than narrow elongate ridges. This is likely due to a difference in mapping criteria and resolution of imagery used, which may also help explain differences in mapping between Glasser and Jansson (Citation2008) and Lovell et al. (Citation2011). There is generally good agreement between our mapping and that of Clapperton (1995), McCulloch and Bentley (Citation1998), Benn and Clapperton (Citation2000), Bentley, Sugden, Hulton, and McCulloch (Citation2005) and Coronato et al. (Citation2013) who all worked at a higher spatial resolution.
3.2. Subdued moraine topography
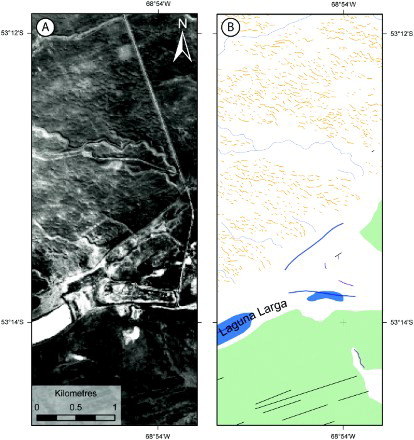
These are somewhat elusive features, occurring mainly in the BI-SSb lobe, but also in the Río Gallegos lobe. They exist as subtle changes in relief, generally not more than 10 metres high and up to a kilometre wide, which are parallel to the orientation of moraine ridges. The features are distinguished as vegetation changes in some places on Landsat imagery and/or very low-relief changes on SRTM data and field-observations helped to confirm their existence. North of Laguna Larga, in the BI-SSb lobe, the moraines exhibit regular fragmentation ().
The subdued moraines are significantly broader than moraine ridges and are not sharp-crested. Likewise, they are very low relief and low gradient, and are thus unlike hummocky terrain. It is suggested that both moraine ridges and hummocky terrain may be overprinted on the subdued moraines (). These features do not seem to have been mapped previously.
3.3. Kettle-kame topography
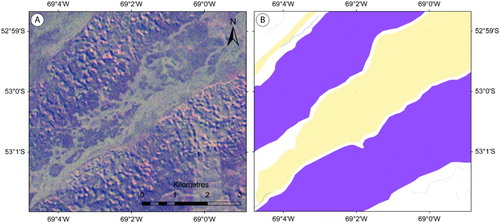
Kettle-kame topography is common within the BI-SSb and Magellan lobes. Unlike moraine ridges, the drift constitutes wide bands (often >2 km) of an irregular mixture of hills and hollows, some containing small kettle-lakes. The kame hills can be greater than 10 m high and rarely show any regularity in their arrangement. Other studies have depicted these deposits as moraine ridges (Bentley et al., Citation2005; Clapperton et al., Citation1995; Glasser & Jansson, Citation2008; McCulloch & Bentley, Citation1998), which is understandable given that the drift and ridges both record ice advance limits. However, we here follow Raedecke (Citation1978) and Benn and Clapperton (Citation2000) in mapping the drift as a distinct feature given its clarity in imagery and on the ground. It is particularly prominent as two large, distinctive belts within the BI-SSb lobe (), forming the Rio Cullen and San Sebastian drift limits of Meglioli (Citation1992; previously mapped by Caldenius, Citation1932).
Figure 6. Kettle-kame topography on the northern edge of the BI-SSb lobe. (A) Landsat ETM+ (bands 4, 3, 1) showing the characteristic pock-marked appearance of the drift. (B) Mapped bands of drift (purple polygons), separated by outwash surfaces (yellow polygons). Location shown in .
3.4. Glacial lineations
Glacial lineations form beneath an ice sheet and are aligned with ice flow direction (Clarhäll & Jansson, Citation2003). They occur frequently throughout the study area, from scattered and subdued flutings (<1 m high) to tightly constrained clusters of classic oval-shaped drumlins tens of metres high (). Where the break of slope could be readily identified, lineations were mapped as polygons, but this was only possible in localised, well-defined drumlinised areas, centred around the Skyring and Otway lobes (Lovell et al., Citation2011). Elsewhere, and particularly in the BI-SSb lobe, the lineations are mapped as lines.
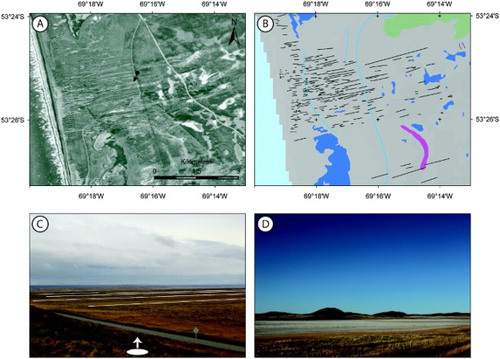
Figure 7. Glacial lineations in the study area. (A) Aerial photograph showing a tightly clustered field of low-relief flutings on the coast of Bahía Inútil and (B) the flutings mapped as black lines. Shorelines are also shown running parallel to the coast (light blue lines). The circle and arrow in (A) show the direction of the field photograph in (C), looking across the flutings which have been highlighted with white lines; locations shown in . At the other end of the scale, (D) shows a field photograph of the much larger, sharp-crested drumlins in the Laguna Cabeza del Mar field of the Otway lobe (see map).
Raedecke (Citation1978), Benn and Clapperton (Citation2000), and Glasser and Jansson (Citation2008) also mapped lineations but identified fewer features. For example, we map a significant number of lineations within the BI-SSb lobe, which overlie subdued moraine topography and are cross-cut by moraine ridges. Ercolano et al. (Citation2004) noted a swath of elongated drumlins within the Río Gallegos lobe geomormorphology, but did not map them individually.
3.5. Irregular hummocky terrain
We present two forms of hummocky terrain in the study area (irregular and regular), and opt for this nomenclature rather than hummocky moraine (Graham et al., Citation2007; Lukas, Citation2005, Citation2007) or controlled moraine (Evans, Citation2009) to avoid genetic inference. In the field, the hummocky terrain appears as patches of small, semi-rounded hills, rarely more than five metres high (and often less) and 10 metres across. Irregular hummocky terrain is significantly more extensive than the regular version (Section 3.6) and lacks an organised pattern (). Raedecke (Citation1978) mapped these features in some parts of the BI-SSb lobe as kettle-kame deposits, forming semi-lobate areas in the centre of the depression. We distinguish hummocky terrain from kettle-kame topography (Section 3.3) on the basis of a significant difference in scale, highlighted by the difference in visible resolution () and a general lack of obvious kettle-holes. Similarly to Raedecke (Citation1978), we also mapped a semi-lobate pattern, and we also note that the feature is exclusive to the BI-SSb lobe.
Figure 8. (A) Aerial photograph and (B) mapped equivalent of the regular (yellow lines) and irregular (green polygons) hummocky terrain. Due to their ordered-nature and visibility on higher resolution aerial photographs, the regular hummocky terrain can be mapped as individual line features rather than grouped polygons. Location shown in .
3.6. Regular hummocky terrain
Regular hummocky terrain is rare in the study area and consists of two or three small interconnected hills, forming ridges transverse to ice-flow (). These features are distinguished from irregular hummocky terrain on the basis of their ridge-like nature and clear orientation. They differ from moraine ridges because the interconnected hills are very short and discontinuous, not marking a clear ice-marginal limit. The main location of the features is north of Laguna Larga (). It should be noted that both forms of hummocky terrain could only be mapped from aerial photographs, and may have been missed in areas where aerial photography was unavailable (). This makes it difficult to ascertain whether the features are inherently related to the dynamics of the BI-SSb lobe, explaining its prevalence there, or whether this is due to differences in imagery coverage. This may also explain why these features have not been mapped previously.
3.7. Irregular dissected ridges
Lovell et al. (Citation2011) mapped features to the north of the Skyring lobe which they described as irregular dissected ridges (IDR), similar to features mapped by Storrar and Stokes (Citation2007) and Greenwood and Clark (Citation2008). Lovell et al. (Citation2011) noted that these features tend to be characterised by interweaving meltwater channels. This is clearly the case in some settings, but extended mapping of the IDR reveals that channels are not always present (). Like the subdued moraine ridges (Section 3.2), the IDR are identifiable on Landsat and Google Earth™ imagery due to changes in vegetation, but their low relief means that, in the field, they are clearest where meltwater channels have flowed between them.
Figure 9. (A) Landsat ETM+ image (bands 4, 3, 1) and (B) mapped equivalent showing the intersection between lineations (black lines) and irregular dissected ridges (brown polygons) between the Skyring (to the south) and Río Gallegos (to the north and west) lobes. Also shown are moraine ridges as purple lines, meltwater channels as blue lines and outwash as yellow polygons. Location shown in .
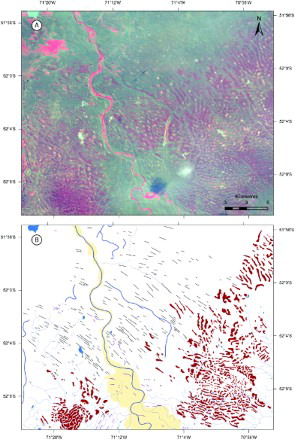
Mapping of the Río Gallegos geomorphology highlights the presence of a large swath of lineations to the north of the IDR, oriented south-easterly, which were just beyond the mapping limit of Lovell et al. (Citation2011). Consequently, it is now clear that the IDR sit in the junction between lineations of the Río Gallegos lobe and moraines of the Skyring lobe ().
3.8. Esker
We found no further evidence of eskers in the study site beyond the one mapped by Clapperton (Citation1989) and Lovell et al. (Citation2011) to the north east of Laguna Cabeza del Mar. In the field, this feature was consistent with the sinuous ridge-like form of an esker, but a lack of sedimentary exposures prevented further investigation.
3.9. Meltwater channels
A large number of meltwater channels are mapped in the study area. We identify these features as routes following previous ice-marginal positions, and sometimes flowing across the topographic slope, or issuing from a former ice margin and often – though not exclusively – containing no contemporary drainage. Some of these, particularly in northern Tierra del Fuego are more than 600 m wide and contain narrow outwash corridors. It is suggested that much of the meltwater associated with the BI-SSb lobe occupied pre-existing drainage channels, probably re-shaping them to some degree. Throughout the study area, much of the contemporary drainage naturally follows the numerous larger meltwater channels, which do not exclusively run laterally, appearing as meandering mis-fit streams. Like Bentley et al. (Citation2005), we also find that meltwater channels are clearer and better-preserved than much of the other geomorphology, often forming better indications of former ice-limits than moraines.
3.10. Former shorelines
Shorelines show a stepped, terrace-like change in relief and often run parallel to contemporary coastlines and lakes (). Though roads or moraine ridges may be misidentified as shorelines from remote imagery, particularly where resolution is poor, they are generally clear in the field. In addition to shorelines within the Skyring lobe (Lovell et al., Citation2011), further examples of this feature have been mapped within the Río Gallegos lobe and around the coast of Bahía Inútil, supporting previous mapping (Bentley et al., Citation2005; Glasser & Jansson, Citation2008; Sagredo et al., Citation2011).
3.11. Outwash plains
The eastern part of the study area is dominated by glaciofluvial outwash plains. These are expansive surfaces of sands and gravels which gently grade away from former ice limits. The plains are identifiable on Landsat imagery as smooth, featureless surfaces, often emerging from the downstream ends of large meltwater channels (). Coronato et al. (Citation2013) highlighted the presence of differing terrace levels in outwash associated with the Río Gallegos lobe, and our fieldwork suggests that similar terraces, indicating multiple stages of outwash development, exist in parts of all four other lobes. However, given the difficulty in mapping different outwash terraces from imagery, the features have been mapped as single units. This has the benefit of simplifying the representation of outwash, but should be taken into consideration when using the mapping to reconstruct glacial history. Where clear meltwater channels can be identified within the outwash, these have been mapped separately.
4. Summary and conclusions
This paper presents a new, comprehensive map of unprecedented detail of the glacial geomorphology in an area once covered by the five southernmost ice lobes of the former Patagonian Ice Sheet. Mapped features include moraine ridges, subdued moraine topography, kettle-kame topography, glacial lineations, irregular hummocky terrain, regular hummocky terrain, irregular dissected ridges, an esker, meltwater channels, former shorelines, and outwash plains, many of which have not been previously recorded. This map will underpin further work on the glacial history of the ice lobes and will provide the necessary context for robust dating of the glacial limits. It also provides a useful test for numerical ice-sheet modelling in the region.
Preliminary conclusions highlight three important characteristics of the glacial geomorphology:
The glacial geomorphology is dominated by landforms associated with meltwater (channels and outwash plains) and possibly indicative of deposition in a slow-moving or stagnant outlet (kettle-kame topography and hummocky terrain). This contrasts with discrete areas of large, well-defined lineations within the inner reaches of the Magellan and Otway lobes, hypothesised to result from more active ice-streaming (Lovell et al., Citation2012).
Moraines to the north differ markedly from those to the south. In the Otway, Skyring and Río Gallegos lobes, limits are generally marked by numerous clear moraine ridges, which are continuous or semi-continuous and relatively sharp-crested. By contrast, the BI-SSb and Magellan lobes are characterised and delimited by hummocky terrain and kettle-kame topography.
Cross-cutting landforms offer clear evidence of multiple advances in places, which may have implications for the timing of limit deposition, and thus the dating programme. This is clearest in the BI-SSb lobe, where lineations and moraine ridges overlie and cross-cut subdued moraine topography; indicating at least two stages of advance at that location.
Software
Image processing and mapping was carried out using ESRI ArcMap 10. Some image processing, such as layer-stacking and mosaicking, was conducted using ERDAS Imagine 9.3. The final geomorphological map was produced in Adobe Illustrator CS4.
Data
The paper is supplied with the shapefile data used in the production of the geomorphological map. These data can be downloaded from the link within the online version.
Main Map: A Glacial Geomorphological Map of the Southernmost Ice Lobes of Patagonia
Download Zip (41.7 MB)Acknowledgements
This research was funded by a NERC PhD studentship awarded to CMD at Durham University. Fieldwork was also supported by an Explorers Club Exploration Grant, Quaternary Research Association NRW Award, Santander Mobility Grant, the Durham University Faculty of Social Sciences and Health and Durham University Geography Department. CMD would like to thank William Christiansen, Mark Hulbert and Paul Lincoln for their assistance and companionship in the field. We also thank the many people who helped us during fieldwork, notably Jorge Rabassa and Andrea Coronato at CADIC-CONICET in Ushuaia, Juan-Carlos Aravena at CEQUA in Punta Arenas, the Fernandez family of Estancia San Clemente, the Vilamera family of Estancia Sara, Juan Robertson of Estancia Tres Hermanos and Pedro Illanes of Estancia Domenica.
References
- Ackert, R. P., Becker, R. A., Singer, B. S., Kurz, M. D., Caffee, M. W., & Mickelson, D. M. (2008). Patagonian glacier response during the late glacial–holocene transition. Science, 321, 392–395. doi:http://www.sciencemag.org/content/321/5887/392.abstract. doi: 10.1126/science.1157215
- Benn, D. I., & Clapperton, C. M. (2000). Pleistocene glacitectonic landforms and sediments around central magellan strait, southernmost chile: Evidence for fast outlet glaciers with cold-based margins. Quaternary Science Reviews, 19, 591–612. doi: 10.1016/S0277-3791(99)00012-8
- Bentley, M. J., Sugden, D. E., Hulton, N. R. J., & McCulloch, R. D. (2005). The landforms and pattern of deglaciation in the strait of magellan and bahia inútil, southernmost south america. Geografiska Annaler Series a-Physical Geography, 87A, 313–333. doi: 10.1111/j.0435-3676.2005.00261.x
- Blomdin, R., Murray, A., Thomsen, K. J., Buylaert, J.-P., Sohbati, R., Jansson, K. N., & Alexanderson, H. (2012). Timing of the deglaciation in southern patagonia: Testing the applicability of k-feldspar irsl. Quaternary Geochronology, 10, 264–272. doi: 10.1016/j.quageo.2012.02.019
- Boex, J., Fogwill, C., Harrison, S., Glasser, N. F., Hein, A., Schnabel, C., & Xu, S. (2013). Rapid thinning of the late pleistocene patagonian ice sheet followed migration of the southern westerlies. Sci. Rep., 3, 1–6. doi: 10.1038/srep02118
- Bonarelli, G. (1917). Tierra del fuego y sus turberas, Anal. Del min. De agric. De la nacion, Buenos Aires.
- Bujalesky, G., Coronato, A., & Isla, F. (2001). Ambientes glacifluviales y litorales cuaternarios de la region del rio chico, tierra del fuego, argentina. Revista de la Asociación Geológica Argentina, 56, 73–90.
- Caldenius, C. C. z. (1932). Las glaciaciones cuaternarias en la patagonia y tierra del fuego. Geografiska Annaler, 14, 1–164. doi: 10.2307/519583
- Clapperton, C. M. (1989). Asymmetrical drumlins in patagonia, chile. Sedimentary Geology, 62, 387–398. doi: 10.1016/0037-0738(89)90127-9
- Clapperton, C. M. (1993). Quaternary geology and geomorphology of south america. Elsevier Science Publishers B.V., Amsterdam, 779 pp.
- Clapperton, C. M., Sugden, D. E., Kaufman, D. S., & McCulloch, R. D. (1995). The last glaciation in central magellan-strait, southernmost chile. Quaternary Research, 44, 133–148. doi: 10.1006/qres.1995.1058
- Clarhäll, A., & Jansson, K. N. (2003). Time perspectives on glacial landscape formation—Glacial flow chronology at lac aux goélands, northeastern québec, canada. Journal of Quaternary Science, 18, 441–452. doi: 10.1002/jqs.763
- Coronato, A., Ercolano, B., Corbella, H., & Tiberi, P. (2013). Glacial, fluvial and volcanic landscape evolution in the laguna potrok aike maar area, southern patagonia, argentina. Quaternary Science Reviews, 71, 13–26. doi: 10.1016/j.quascirev.2012.06.019
- Coronato, A., Martínez, O., & Rabassa, J. (2004). Glaciations in argentine patagonia, southern south america. In J. Ehlers & P. L. Gibbard (Eds.), Developments in quaternary sciences (pp. 49–67). Elsevier. doi:http://dx.doi.org/10.1016/s1571-0866(04)80111-8.
- Ercolano, B., Mazzoni, E., Vazquez, M., & Rabassa, J. (2004). Drumlins and drumlinoid forms of the lower pleistocene in southern patagonia, province of santa cruz. Rev. Asoc. Geol. Argent., 59, 771–777.
- Evans, D. J. A. (2009). Controlled moraines: Origins, characteristics and palaeoglaciological implications. Quaternary Science Reviews, 28, 183–208. doi: 10.1016/j.quascirev.2008.10.024
- Evenson, E. B., Burkhart, P. A., Gosse, J. C., Baker, G. S., Jackofsky, D., Meglioli, A., Dalziel, I., Kraus, S., Alley, R. B., & Berti, C. (2009). Enigmatic boulder trains, supraglacial rock avalanches, and the origin of “darwin's boulders,” tierra del fuego. GSA Today, 19, 4–10. doi: 10.1130/GSATG72A.1
- García, J. L., Kaplan, M. R., Hall, B. L., Schaefer, J. M., Vega, R. M., Schwartz, R., & Finkel, R. (2012). Glacier expansion in southern patagonia throughout the antarctic cold reversal. Geology, 40, 859–862. doi: 10.1130/G33164.1
- Glasser, N., & Jansson, K. (2008). The glacial map of southern south america. Journal of Maps, 4, 175–196. doi: 10.4113/jom.2008.1020
- Glasser, N. F., Jansson, K. N., Goodfellow, B. W., de Angelis, H., Rodnight, H., & Rood, D. H. (2011). Cosmogenic nuclide exposure ages for moraines in the lago san martin valley, argentina. Quaternary Research, 75, 636–646. doi: 10.1016/j.yqres.2010.11.005
- Glasser, N. F., Jansson, K. N., Harrison, S., & Kleman, J. (2008). The glacial geomorphology and pleistocene history of south america between 38 degrees s and 56 degrees s. Quaternary Science Reviews, 27, 365–390. doi: 10.1016/j.quascirev.2007.11.011
- Graham, D. J., Bennett, M. R., Glasser, N. F., Hambrey, M. J., Huddart, D., & Midgley, N. G. (2007). ‘A test of the englacial thrusting hypothesis of “hummocky” moraine formation: Case studies from the northwest highlands, scotland’: Comments. Boreas, 36, 103–107. doi:http://dx.doi.org/10.1111/j.1502-3885.2007.tb01184.x.
- Greenwood, S. L., & Clark, C. D. (2008). Subglacial bedforms of the irish ice sheet. Journal of Maps, 4, 332–357. doi: 10.4113/jom.2008.1030
- Hein, A. S., Dunai, T. J., Hulton, N. R. J., & Xu, S. (2011). Exposure dating outwash gravels to determine the age of the greatest patagonian glaciations. Geology, 39, 103–106. doi: 10.1130/G31215.1
- Hein, A. S., Hulton, N. R. J., Dunai, T. J., Schnabel, C., Kaplan, M. R., Naylor, M., & Xu, S. (2009). Middle pleistocene glaciation in patagonia dated by cosmogenic-nuclide measurements on outwash gravels. Earth and Planetary Science Letters, 286, 184–197. doi: 10.1016/j.epsl.2009.06.026
- Hein, A. S., Hulton, N. R. J., Dunai, T. J., Sugden, D. E., Kaplan, M. R., & Xu, S. (2010). The chronology of the last glacial maximum and deglacial events in central argentine patagonia. Quaternary Science Reviews, 29, 1212–1227. doi: 10.1016/j.quascirev.2010.01.020
- Kaplan, M. R., Coronato, A., Hulton, N. R. J., Rabassa, J. O., Kubik, P. W., & Freeman, S. P. H. T. (2007). Cosmogenic nuclide measurements in southernmost south america and implications for landscape change. Geomorphology, 87, 284–301. doi: 10.1016/j.geomorph.2006.10.005
- Kaplan, M. R., Douglass, D. C., Singer, B. S., & Caffee, M. W. (2005). Cosmogenic nuclide chronology of pre-last glacial maximum moraines at lago buenos aires, 46 degrees s, argentina. Quaternary Research, 63, 301–315. doi: 10.1016/j.yqres.2004.12.003
- Kaplan, M. R., Fogwill, C. J., Sugden, D. E., Hulton, N., Kubik, P. W., & Freeman, S. P. H. T. (2008). Southern patagonian glacial chronology for the last glacial period and implications for southern ocean climate. Quaternary Science Reviews, 27, 284–294. doi: 10.1016/j.quascirev.2007.09.013
- Kilian, R., & Lamy, F. (2012). A review of glacial and holocene paleoclimate records from southernmost patagonia (49–55°s). Quaternary Science Reviews, 53, 1–23. doi: 10.1016/j.quascirev.2012.07.017
- Kleman, J., Hättestrand, C., Stroeven, A. P., Jansson, K., De Angelis, H., & Borgström, I. (2006). Reconstruction of palaeo-ice sheets - inversion of their glacial geomorphological record. In P. Knight (Ed.), Glaciology and earth's changing environment (pp. 192–198). Blackwell.
- Lovell, H., Stokes, C. R., & Bentley, M. J. (2011). A glacial geomorphological map of the seno skyring-seno otway-strait of magellan region, southernmost patagonia. Journal of Maps, 7, 318–339. doi: 10.4113/jom.2011.1156
- Lovell, H., Stokes, C. R., Bentley, M. J., & Benn, D. I. (2012). Evidence for rapid ice flow and proglacial lake evolution around the central strait of magellan region, southernmost patagonia. Journal of Quaternary Science, 27, 625–638. doi: 10.1002/jqs.2555
- Lukas, S. (2005). A test of the englacial thrusting hypothesis of ‘hummocky’ moraine formation: Case studies from the northwest highlands, scotland. Boreas, 34, 287–307. doi:http://dx.doi.org/10.1111/j.1502-3885.2005.tb01102.x. doi: 10.1080/03009480510013042
- Lukas, S. (2007). ‘A test of the englacial thrusting hypothesis of “hummocky” moraine formation: Case studies from the northwest highlands, scotland’: Reply to comments. Boreas, 36, 108–113. doi:http://dx.doi.org/10.1111/j.1502-3885.2007.tb01185.x.
- McCulloch, R. D., & Bentley, M. J. (1998). Late glacial ice advances in the strait of magellan, southern chile. Quaternary Science Reviews, 17, 775–787. doi: 10.1016/S0277-3791(97)00074-7
- McCulloch, R. D., Fogwill, C. J., Sugden, D. E., Bentley, M. J., & Kubik, P. W. (2005). Chronology of the last glaciation in central strait of magellan and bahia inutil, southernmost south america. Geografiska Annaler Series a-Physical Geography, 87A, 289–312. doi: 10.1111/j.0435-3676.2005.00260.x
- Meglioli, A. (1992). Glacial geology and chronology of southernmost patagonia and tierra del fuego, argentina and chile, Geology. Lehigh.
- Mercer, J. H. (1976). Glacial history of southernmost south america. Quaternary Research, 6, 125–166. doi: 10.1016/0033-5894(76)90047-8
- Moreno, P. I., Jacobson, G. L., Lowell, T. V., & Denton, G. H. (2001). Interhemispheric climate links revealed by a late-glacial cooling episode in southern chile. Nature, 409, 804–808. doi: 10.1038/35057252
- Moreno, P. I., Kaplan, M. R., Francois, J. P., Villa-Martinez, R., Moy, C. M., Stern, C. R., & Kubik, P. W. (2009). Renewed glacial activity during the antarctic cold reversal and persistence of cold conditions until 11.5 ka in southwestern patagonia. Geology, 37, 375–378. doi:http://dx.doi.org/10.1038/35057252. doi: 10.1130/G25399A.1
- Moreno, P. I., Villa-Martínez, R., Cárdenas, M. L., & Sagredo, E. A. (2012). Deglacial changes of the southern margin of the southern westerly winds revealed by terrestrial records from sw patagonia (52°s). Quaternary Science Reviews, 41, 1–21. doi: 10.1016/j.quascirev.2012.02.002
- Murray, D. S., Carlson, A. E., Singer, B. S., Anslow, F. S., He, F., Caffee, M., Marcott, S. A., Liu, Z., Otto-Bliesner, B. L. (2012). Northern hemisphere forcing of the last deglaciation in southern patagonia. Geology, 40, 631–334. doi: 10.1130/G32836.1
- Nordenskjold, O. (1899). Geologie, geographie und anthropologie. Schwedischen expedition nach den magellanslandern. Stockholm: Norstedt and Soner.
- Porter, S. C. (1990). Character and ages of pleistocene drifts in a transect across the strait of magellan. Quaternary of South America and Antarctica Peninsula, 7, 35–49.
- Rabassa, J. (2008). Late cenozoic glaciations in patagonia and tierra del fuego. In J. Rabassa (Ed.), Developments in quaternary sciences (pp. 151–204). Elsevier. .
- Rabassa, J., Coronato, A., Bujalesky, G., Salemme, M., Roig, C., Meglioli, A., Heusser, C., Gordillo, S., Roig, F., Borromei, A., & Quattrocchio, M. (2000). Quaternary of tierra del fuego, southernmost south america: An updated review. Quaternary International, 68–71, 217–240. doi: 10.1016/S1040-6182(00)00046-X
- Raedecke, L. D. (1978). Formas del terreno y depositos cuaternarios tierra del fuego central, chile. Revista geológica de Chile, 5, 3–31.
- Rutter, N., Schnack, E. J., Rio, J. d., Fasano, J. L., Isla, F. I., & Radtke, U. (1989). Correlation and dating of quaternary littoral zones along the patagonian coast, argentina. Quaternary Science Reviews, 8, 213–234. doi: 10.1016/0277-3791(89)90038-3
- Sagredo, E. A., Moreno, P. I., Villa-Martinez, R., Kaplan, M. R., Kubik, P. W., & Stern, C. R. (2011). Fluctuations of the ultima esperanza ice lobe (52 degrees s), chilean patagonia, during the last glacial maximum and termination 1. Geomorphology, 125, 92–108. doi: 10.1016/j.geomorph.2010.09.007
- Singer, B. S., Ackert, R. P., & Guillou, H. (2004a). 40ar/39ar and k-Ar chronology of pleistocene glaciations in patagonia. Geological Society of America Bulletin, 116, 434–450. doi: 10.1130/B25177.1
- Singer, B., Brown, L. L., Rabassa, J., & Guillou, H. (2004b). 40ar/39ar ages of late pliocene and early pleistocene geomagnetic and glacial events in southern argentina. Agu Geophysical Monograph Timescales of the Internal Geomagnetic Field.
- Storrar, R., & Stokes, C. R. (2007). A glacial geomorphological map of victoria island, canadian arctic. Journal of Maps, 3, 191–210. doi: 10.1080/jom.2007.9710838
- Strelin, J. A., Denton, G. H., Vandergoes, M. J., Ninnemann, U. S., & Putnam, A. E. (2011). Radiocarbon chronology of the late-glacial puerto bandera moraines, southern patagonian icefield, argentina. Quaternary Science Reviews, 30, 2551–2569. doi: 10.1016/j.quascirev.2011.05.004
- Sugden, D. E., Bentley, M. J., Fogwill, C. J., Hulton, N. R. J., McCulloch, R. D., & Purves, R. S. (2005). Late-glacial glacier events in southernmost south america: A blend of ‘northern'and ‘southern' hemispheric climatic signals?. Geografiska Annaler Series a-Physical Geography, 87A, 273–288. doi: 10.1111/j.0435-3676.2005.00259.x
- Ton-That, T., Singer, B., Morner, N. A., & Rabassa, J. (1999). Datacion por el metodo 40ar/39ar de lavas basalticas y geologia del cenozoico superior en la region del lago buenos aires, provincia de santa cruz, argentina. Asociacion Geologica Argentina, Revista, 54, 333–352.
- Wenzens, G. (2006). Comment on: Cosmogenic nuclide chronology of pre-last glacial maximum moraines at lago buenos aires, 46°s, argentina (quaternary research 63/3, 2005, 301–315). Quaternary Research, 66, 364–366. doi: 10.1016/j.yqres.2006.06.001