
Abstract
Detailed maps, appropriate for decision making at the local level are outdated or currently not available in Mozambique. The community map presented in this paper is built on participatory mapping and Participatory GIS practices (especially photo mapping) and links to advanced spatial analysis in the context of disaster risk reduction and flood hazard assessment. Based on a very high-resolution satellite imagery, community members mapped different features such as the community boundary, settlement areas and their names, agricultural areas, important infrastructure and most importantly ‘low’ and ‘high risk’ zones for floods. It has been for the first time that a community was mapped in Mozambique in such a way integrating local knowledge. The identification of hazard zones in a participatory manner was seen as one way to overcome the bottleneck of limited available data for a proper GIS-based hazard modeling. Next to the digitization of the community mapped features, an image classification on land use, settlement areas (houses), and the integration of GPS collected points (infrastructure, photos) was carried out. In a final step the map was printed and handed-over to the community members. In the applied methodology it has been demonstrated that the assessment of risks through the integration of community knowledge and paper-based satellite images is valid. Next to the result of deriving a community-based hazard map, the process of mapping is understood as essential to sensitize and learn about local flood hazard risk.
1. Introduction
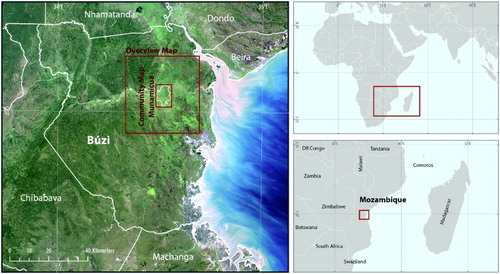
The assessment of natural hazard risks and its spatial representation is essential for effectively targeting disaster risk reduction measures at the local level. In the District of Búzi, located downstream at the river Búzi and at the shores of the Indian Ocean in Central Mozambique (), a community-based flood early warning system has been established, where local disaster risk committees have been formed to support disaster mitigation, response and relief activities in their community (CitationFerguson, 2005). This early warning system was established after major flood events in the years 2000 and 2001, which affected large areas of the district along the river Búzi and Pungue (see also CitationChristie & Hanlon, 2001).
Figure 1. Location map of the Munamicua flood hazard and community map as well as the overview map.
The major aim of the developed mapping approach is to provide community members, and specifically the disaster risk committees, with the appropriate decision support and awareness tools to identify and reduce their own vulnerabilities and exposures to floods, and to assist them with their responsibilities as disaster risk reduction committees. Additionally, the participatory mapping exercise enables communities through learning and sensitization to get a better understanding of their environment. Answering the central questions of ‘where’ and ‘what’, is essential in dealing with challenges in a general community planning context, and especially in the case of disaster risk reduction. However, a ‘map’ is not a solution on its own, as it also requires certain structures, commitments and technical expertise. Therefore, the applied methodology can contribute significantly to the support of community-based disaster risk reduction measures, but has to be embedded in the context of an integral disaster risk reduction program.
2. Methods
2.1. Assessing risk, hazard and vulnerabilities in Búzi – the larger context
The community mapping exercise presented here integrates participatory mapping (as a tool of Participatory Rural Appraisal (PRA), CitationChambers, 1994) and Participatory GIS (PGIS) practices (especially photo mapping) and links to advanced spatial analysis. CitationRambaldi, Kyem, McCall, and Weiner (2006) define PGIS ‘as emergent practice in its own right’. They see the practice as a spontaneous merger of PRA and GIS. The use and application of different tools and methods are used “to represent peoples’ spatial knowledge [ … ] for spatial learning, discussion, information exchange, analysis, decision making and advocacy” (ibid.). Furthermore, a strong focus is seen on disadvantaged groups which are somehow ‘empowered’ through the capacity to generate, analyze, manage and communicate spatial information.
The above mentioned early warning system specifically targets the community level, in addition to several policies in Mozambique which empower the district level to implement and carry out spatial planning and disaster risk reduction activities. Therefore, the community mapping not only represents the spatial knowledge in terms of flood hazard zonations for improved decision making at the very local level, but also integrates a component to identify relevant vulnerability factors through group discussions and weighting exercises, which further helped to develop appropriate vulnerability indicators at the district level (for further details see CitationKienberger, 2012, CitationKienberger, 2013).
In summary, the specific objectives for the community mapping have been (a) the compilation and design of a community hazard map which should assist the community members within their disaster risk reduction activities, (b) to map the community according to the needs of the communities in a participatory manner, (c) to define, analyze and prioritize the driving forces of vulnerability according to the perception of the communities and (d) to enhance the ‘maps’ through spatial analysis results for different community characteristics related to disaster risk reduction.
2.2. Workflow for a spatial hazard and vulnerability mapping
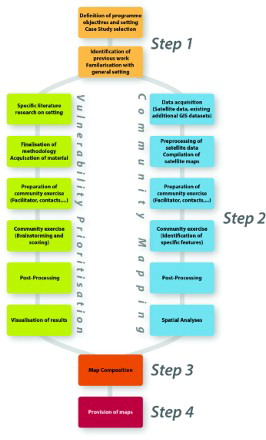
The overall workflow is shown in and comprises four major steps, whereas the step 2 – community mapping and vulnerability prioritization – are described in more detail below. The workflow itself has also been compiled in a toolbox for field practioners (CitationKienberger, 2009)
Figure 2. Workflow of the developed approach to assess the vulnerability at the community level (Kienberger, Citation2013).
The initial common steps included the definition of project objectives and the identification of the case study area, with the subsequent identification of previous work and familiarization with the general setting.
The ensuing process included two parallel steps where community maps are produced and vulnerability factors identified and weighted. These steps are on the same level with respect to their importance and are somewhat independent from each other. In the best case the mapping is carried out first, for instance on the first afternoon, and the prioritization exercise subsequently, e.g., on the second day.
The method for the specific hazard mapping consisted of two major steps: First, a very high-resolution satellite imagery (such as a Quickbird image with a resolution of ∼0.7 m) was acquired and presented to community members as a ‘blank’ map to facilitate discussion and mapping of specific features. In a second step, these results were integrated in a GIS and enhanced through additional spatial analysis.
After an orientation phase and the identification of key landmarks, committee members identified and marked different features on the paper map with different colored pens ().
Figure 3. Different phases during the community mapping.
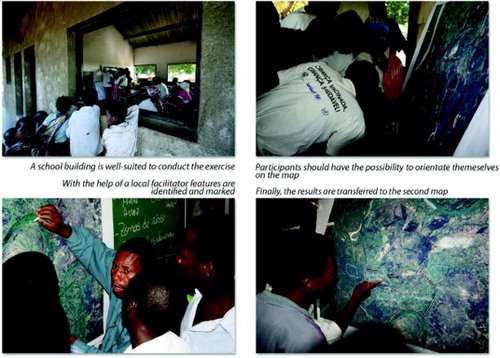
This included (a) the community boundary (requires most of the time, as this is an often heavily discussed issue, as it has never been documented before), (b) names of neighboring communities, (c) flood hazard zones (high-risk/low-risk/safe areas … ; past flood affected areas), (d) lower and higher elevated areas and areas close to the river, (e) agricultural zones, (f) special infrastructure of the community (such as wells, markets, schools, assembly points, accommodation centers etc.; sacred places should only be mapped if community members agree), (g) the settlement areas and (h) the naming of areas and natural features. It was recommended that people draw directly on the paper as transparencies might be inconvenient (see also ). In an additional step locations of specific community sites were collected through GPS measurements and/or georeferenced photographs.
After agreeing on the mapped features, a second copy of the final map was made, whereas one was left with the community as a first reward and the second one was used to integrate the results in a GIS environment (digitization) for further analysis. Additional data deriving from National Spatial Data Infrastructures (NSDI) or other sources (if available) were collected and integrated into a database and the map.
Next to the (digital) representation of the features identified and mapped during the community mapping exercise, a strong emphasis was on the application of spatial analysis tools/methods. These analysis results are seen as reflecting the ‘conditions of vulnerability’ and as an analysis of exposure to flood hazards.
The following spatial analysis elements were implemented:
Spatial queries: To estimate the amount of people living within a certain area (e.g. how many houses/people are within the high-risk zone) spatial queries (e.g. ‘are located within’) were applied
Buffer zones/Distance analysis were added to the map (e.g. distance to disaster risk kit/safe areas etc … ) and statistics were calculated to provide additional information about distances to specific areas (e.g. the estimated amount of people living in flood hazard zones)
Density analysis: To estimate the density of the settlement area ‘Kernel’ functions were applied. This additionally helped to delineate the settlement area. Kernel density calculates the density of features in a neighborhood around those features. It has been originally described by CitationSilverman (1986) and conceptually a smoothly curved surface is fitted over the different points. The value is higher close to the points (such as houses) and diminishes with increasing distance.
Land use/land cover (LULC) classification: Not directly related to spatial analysis, a LULC map was produced using the Quickbird satellite imagery. This result was used to enhance the final cartographic product. However, the integration of information needs to be chosen carefully as the LULC are more complex and already represent an abstraction of reality as compared to a true color satellite image and could then be perceived as not useful for community members in the final map product. However, a quantification of LULC classes was carried out to characterize the natural environment of the community. The methodology applied is not discussed in detail here, but builds on the approaches of object-based image analysis (CitationBlaschke, 2010). In this case the classes of agriculture, bare soil, burned-off areas, meadow, trees, shrub, water and shadow have been derived from the Quickbird satellite image.
In a second parallel step (see ) the issue of vulnerability to natural hazards was addressed together with the community members. The main objective of this part was to understand the perception of vulnerability as seen from the community perspective and to identify the importance of different factors. Additionally, the exercise aimed to stimulate a discussion among the community members on their susceptibility to different triggers of vulnerability. First the question of ‘What are the factors which define your vulnerability to floods’ was expressed to the committee members. Feedback and specific factors where then noted on paper cards for the flood and drought hazards. Once all factors have been discussed and agreed upon, a pre-defined amount of peanuts (40) – as representative of points and weights – was given to the community members. Committee members then distributed the peanuts according to the importance of each factor. As shortly outlined above, this exercise helped to discuss vulnerability issues with the communities and get a clearer understanding of their perception. Next to this learning component, the results were later used for the establishment of an appropriate indicator framework for the district vulnerability assessment (Kienberger, Citation2013; CitationKienberger, 2012).
2.3. Map elements
The results from the community hazard mapping and vulnerability prioritization were compiled in the step ‘map composition’ (see ). As mentioned above, it was assumed that in addition to the learning process initiated with the mapping and vulnerability prioritization, maps should support the communities in their activities with respect to disaster risk reduction. Therefore, a final laminated copy was handed over to the community members.
The community hazard map includes the following elements:
Land Use and Land Cover classification (based on Quickbird satellite imagery)
Community infrastructure (houses, school, location of the flood response kit, health facilities, water wells, market, accommodation centers, paths). Data were collected through various sources and with additional community input during the mapping exercises, as well as GPS collections.
Community boundary (community derived)
Houses and settlement area (partly community derived, enhanced through digitization and kernel function)
Flood hazard zones (community derived)
Additional flooded zones for the overview map (based on a satellite derived water mask of the floods 2000)
Results of vulnerability identification (as a list and as a treemap, photographs of the scoring results and a short textual interpretation). A treemap is a visualization of hierarchical data with nested rectangles. The size of the rectangles displays the weight of the representing factor. This type of visualization allows for easy capturing of the structure and the weight of the different factors (see CitationSlingsby, Dykes, and Wood (2008) for a discussion on the spatio-temporal use of treemaps).
Buffer zones indicating the distance to the safe areas (GIS analysis)
Analysis of exposure (spatial analysis and distance queries; number of houses in risk zones, distance to safe areas, statistical data on the community and an estimation on people living in risk zones)
3. Conclusions
It has been the first time that a community was mapped in such a way in Mozambique and local knowledge was integrated through PGIS practices. The identification of hazard zones in a participatory manner was seen as one way to overcome the bottleneck of limited data (e.g. appropriate elevation models) to conduct GIS-based hazard delineation. In the applied methodology it has been demonstrated that the assessment of risks through the integration of community knowledge and paper-based satellite images is valid and can be easily transferred to other natural hazards, preferably with a clear spatial extent (e.g. landslides, forest fires, river bank erosion, … ). For community members it was easy to orientate themselves on the maps and to draw and highlight the essential features related to hazards in the community. It is clear that such mapping approaches, which include a representative group of a community, has to be seen as a snapshot. It has to be noted that such assessments of course to some extent reflect fuzzy boundaries which also underlie different accuracy levels than a sophisticated risk delineation based on numerical and physical models.
As it never can be assured that a map is 100% correct, the possibility of updates has to be ensured. The decision on the integration of maps as a central decision making tool has to involve the possibility for feedback loops, continuous updates and the strengthening of capacities at all levels. Therefore a process was started which involves different actors on different levels. The process does actually not end with the handing over of the map. Continuous support, updates and evaluation of the ‘success’ and usability of the maps are necessary. It is essential the appropriate integration within a project design which commits itself to the use of maps as a decision support tool in communities, and maintains the transfer and integrity from traditional sketch mapping toward real-world coordinate based PGIS maps.
Software
Pre-processing of the satellite imagery (pan-sharpening, mosaicking, improved georeferencing) was carried out in ERDAS Imagine 9.3. Final cartography, but also the spatial analysis was implemented in ArcGIS 9.3 (with the Spatial Analyst extension). The treemaps were designed with the software HiDE v1.0 and later improved in Adobe Illustrator CS3. Microsoft Excel was used to design the different diagrams.
Funding
The research leading to these results has received funding through the Munich Re Foundation, where I would like to express my sincere gratitude to Thomas Loster. Special thanks go to INGC in Mozambique (especially Sr. Gomez for facilitating), CIG-UCM and the community members providing their time to participate in this research. The author would also like to thank the reviewers for providing helpful feedback and comments to the paper and map.
TJOM_891265_supplemental_material.pdf.pdf
Download PDF (4.7 MB)Related Research Data
References
- Blaschke, T. (2010). Object based image analysis for remote sensing. ISPRS Journal of Photogrammetry and Remote Sensing, 65(1), 2–16. doi: 10.1016/j.isprsjprs.2009.06.004
- Chambers, R. (1994). The origins and practice of participatory rural appraisal. World Development, 22(7), 953–969. doi: 10.1016/0305-750X(94)90141-4
- Christie, F., & Hanlon, J. (2001). Mozambique & the Great Flood of 2000. African Issues.
- Ferguson, J. (2005). Disaster risk management along the Rio Búzi – Case study on the background, concept and implementation of disaster risk management in the context of the GTZ-programme for rural development (PRODER). GTZ.
- Kienberger, S. (2009). Toolbox & Manual: Mapping the vulnerability of communities – Example from Búzi, Mozambique. Retrieved December 21, 2011, from http://projects.stefankienberger.at/vulmoz/wp-content/uploads/2008/08/Toolbox_CommunityVulnerabilityMapping_V1.pdf.
- Kienberger, S. (2012). Spatial modelling of social and economic vulnerability to floods at the district level in Búzi, Mozambique. Natural Hazards, 64(3), 2001–2019. doi: 10.1007/s11069-012-0174-9
- Kienberger, S. (2013). Mapping vulnerability – Integration of GIScience and participatory approaches at the local and district levels. In J. Birkmann (Ed.), Measuring Vulnerability to Natural Hazards (2nd ed., pp. 401–422). New York: United Nations University.
- Rambaldi, G., Kyem, P. A. K., McCall, M., & Weiner, D. (2006a). Participatory spatial information management and communication in developing countries. Electronic Journal on Information Systems in Developing Countries, 25(1), 1–9.
- Silverman, B. W. (1986). Density estimation for statistics and data analysis. New York: Chapman and Hall.
- Slingsby, A., Dykes, J., & Wood, J. (2008). Using treemaps for variable selection in spatio-temporal visualisation. Information Visualization, 7(3–4), 210–224. doi: 10.1057/palgrave.ivs.9500185