
Abstract
Geographically referenced faunal surveys are essential for land managers, conservation biologists, and entomologists to understand the distribution and diversity of organisms in the landscape. Further, the provision of faunal surveys through online and interactive mapping tools may generate new insights into species occurrence and location, ultimately leading to better informed decisions about how best to manage these species and their habitats. With these considerations in mind, we developed Weevil Viewer, an online, interactive mapping application for displaying the results of a faunal survey conducted on the four primitive weevil families found in Wisconsin. Design of Weevil Viewer was informed by Shneiderman's information seeking mantra, providing a pair of map overviews that can be filtered or zoomed iteratively by species, location, and time to glean new insights into the faunal distribution and diversity as well as to identify potential sites for future surveys. Weevil Viewer continues to be populated with new survey information and serves as a proof-of-concept application that can be extended to support the visual exploration of other biodiversity surveys.
1. Introduction
Systematic entomology is a subfield of entomology that focuses on the evolutionary relationships and classification of the various taxa of insects and related arthropods. Many of us deem insects as little more than a nuisance, but there are many positive aspects that come with insects and they can be beneficial in many ways. To list a couple, insects play important roles in sustaining ecosystems and numerous insect species can serve as biological control agents for invasive plant populations. Understanding the life histories and the geographic and phenological distributional patterns of insects therefore is essential for understanding and maintaining ecosystems.
Faunal surveys are the primary method for establishing baseline knowledge regarding the distribution and diversity of insect species. When geographically referenced, these surveys support land managers in making better informed management decisions and enable conservation biologists to assess the conservation values of the surveyed areas. Geographically referenced survey information are also essential for research in biogeography, metapopulation studies, and habitat modeling. While important, the geographic and temporal components of these surveys are commonly underutilized, in part due to the lack of training in geographical information system (GIS) concepts and tools by the domain experts who collect and analyze data associated with the surveys.
We introduce and describe Weevil Viewer, an online and interactive mapping application describing the diversity, distribution, phenology, and natural history of four taxa of primitive weevils, a group of beetles most easily recognizable by the presence of a snout with straight antennae (; main map: http://www.geography.wisc.edu/maps/WeevilViewer/). This particular weevil survey is part of a larger effort by the Young Lab of the UW – Madison Entomology Department, investigating the systematics of various insect taxa over the past 30 years.
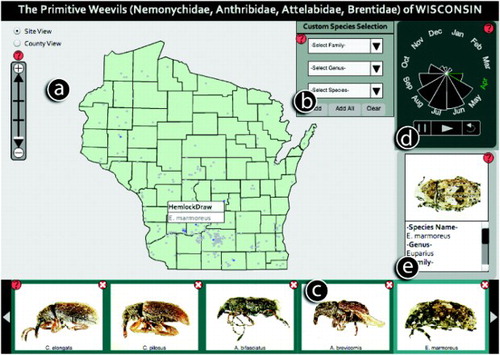
Figure 1. Weevil viewer (Main map: http://www.geography.wisc.edu/maps/WeevilViewer/) consists of five coordinated panels: (a) the map panel (shown when Site View is selected), (b) the custom species selection panel, (c) the selected species panel, (d) the nightingale temporal clock panel, and (e) the information panel.
The purpose of this paper is to describe the design and development of a set of interactive mapping tools powerful enough to support exploration and analysis of space–time patterns in the weevil survey information, but usable by individuals without expertise in GIS. Weevil Viewer serves as a proof-of-concept application that can be expanded to other biodiversity surveys that incorporates both geographical and temporal data.
2. Background
2.1. Interactive mapping of faunal and floral surveys
Several existing online, interactive mapping applications depicting faunal or floral surveys are discussed within the framing of ecological informatics, or the use of information technology to support ecology. Best et al. (Citation2007) developed an online application for indexing and mapping the geographically referenced OBIS-SEAMAP marine animal biogeographical database. The resulting OBIS-SEAMAP information system – which leveraged a variety of geospatial web technologies – improved both the access to the survey data and the accessibility to higher-level analytics (e.g. statistical models, scientific workflows) for interpreting the survey data. McGuire, Gangopadhyay, Komlodi, and Swan (Citation2008) developed an online ecological data warehouse, which includes a suite of geoprocessing tools for the analysis and visualization of faunal and floral distributions in the context of their environmental and habitat conditions. Interestingly, the authors followed a user-centered approach to inform the design and development of the online data warehouse and associated interactive mapping tools. Finally, Auer, Maceachren, Mccabe, Pezanowski, and Styker (Citation2011) developed an online, interactive mapping application called HerbariaViz that supports space–time exploration and analysis of a floral survey maintained by the Consortium of California Herbaria. HerbariaViz leverages best practices in cartographic design and interactive geovisualization, topics highly relevant to the design and development of Weevil Viewer.
2.2. Faunal survey of primitive weevils
The superfamily Curculionoidea, or weevils, is a mega-diverse taxon of beetles with over 60,000 species that include both primitive and true weevils. Four primitive weevil families occur in Wisconsin: Nemonychidae, Anthribidae, Attelabidae and Brentidae. These primitive weevils are phylogenetically basal to true weevils (family Curculionidae) and can be distinguished by their straight antennae, as opposed to the geniculate antennae found in the true weevils. A faunal survey of these four families of primitive weevils was conducted to characterize the geographic (space) and phenological (time) distribution of all primitive weevil species in Wisconsin, including their associated habitats, host plants, and general diversity.
The geographic dataset mapped in Weevil Viewer includes information on about 70 different species of primitive weevils from over 100 survey sites across Wisconsin. Both historical and original survey information were included in the mapped dataset. First, historical species occurrence records were compiled from published Wisconsin records. These published historical records were appended with unidentified or unpublished material from museum and private collections to expand the included list of species. Second, additional sites were identified based on weevil habitat types, with original survey information collected over two seasons to improve the number and distribution of survey sites. The resulting survey dataset is loaded into Weevil Viewer as a flat .csv file to provide a straightforward way for domain experts to update and append the survey dataset after the deployment of Weevil Viewer. The .csv file is structured to list the geographic units as rows and the species by month as columns; the geographic linework and species images are loaded dynamically when the application initializes.
2.3. User-centered design and development of weevil viewer
Design and development of Weevil Viewer was informed by three key concepts important to user-centered design: (1) the target user group, (2) the application's utility, and (3) the application's usability (Roth, Maceachren, & Mccabe, Citation2009). Targeted users of Weevil Viewer include land managers, conservation biologists, ecologists, and entomologists; the targeted users therefore have a high degree of expertise in the application domain, but relatively minimal experience using GIS or mapping tools. The primary goals of the targeted user group were the exploration and analysis of the faunal survey in space and time (MacEachren, Citation1994); the end goal was to generate and confirm new insights about the distribution and diversity of primitive weevils in Wisconsin.
Once the target user group was identified and articulated, we addressed the application's utility and usability. In practice, system utility and usability often result in a tradeoff (Robinson, Roth, & Maceachren, Citation2011). To balance this tradeoff, we first identified a small set of core requirements for Weevil Viewer based on the primary needs of the targeted user group (described below); we limited the core requirements due to the aforementioned unfamiliarity with GIS and mapping tools by the target user group. We then worked through static mockups of the interface to identify potentially usable designs implementing this functionality. While informal feedback was collected throughout design and development of Weevil Viewer, we did not complete a formal usability assessment due to limitations in project resources. Weevil Viewer was built using Adobe Flash and was deployed in May 2012 after three months of design and development.
3. Application description
Weevil Viewer consists of five coordinated panels (): (a) a central Map Panel, displaying the distribution and diversity of species in the faunal survey, (b) a Custom Species Selection Panel, which allows users to filter the map by species, (c) a Selected Species Panel, which provides feedback to the user about the species contained within the filter criteria, (d) a Nightingale Temporal Clock Panel (Auer et al., Citation2011), which allows users to filter the map by time, and (e) an Information Panel, which provides details to the user about a single, selected species. The navigation of Weevil Viewer across these panels was designed in accordance with Shneiderman's (Citation1996, p. 337) information seeking mantra of ‘overview first, zoom and filter, then details on demand’, a well-established design philosophy for revealing new insights into voluminous datasets. As described below, the user can reexpress the Map Panel between two visually isomorphic overviews, or different representations of the same information set (Dou et al., Citation2010): a Site View and a County View. From the overviews, the user then can filter the information by species or month using the Custom Species Selection (attributes) and Nightingale Temporal Clock (time) Panels respectively. The user also can zoom to a site or county of interest (space) within the Map Panel. The ability to filter or zoom in space, time, and attribute follows Peuquet's (Citation1994) TRIAD model of spatiotemporal information. Finally, additional details are available in the Information Panel when the user selects specific species, sites, or counties. A description of each coordinated panel is provided below.
The Map Panel can be displayed as two different isomorphic overviews: a Site View that presents the individual survey sites and a County View that aggregates the survey sites by county. The Site View plots the sites as points atop a vector basemap of Wisconsin. Sites containing survey data that match the user's filter criteria (e.g. species and month) are highlighted in bright blue, while sites that do not match the filter criteria are deemphasized visually in gray. Flexible map browsing (i.e. panning and zooming) is supported in the Map Panel (Roth & Harrower, Citation2008), allowing the user to zoom to a site of interest through direct manipulation of the map itself (e.g. double-click) and through a zoom slider widget. Brushing a site activates an information window containing the site's name and the list of the species identified at the site that match the filter criteria. The user then can select a species from the list to retrieve details about the given species in the Information Panel.
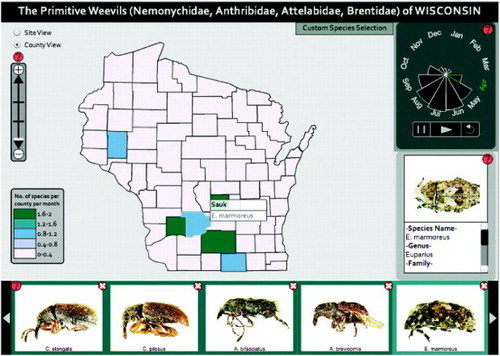
The County View () has similar functionality as the Site View, but is presented as a choropleth map in which the county is the enumeration unit and the color scheme is associated with the number of species that are found in each county that match the filter criteria (Slocum et al., Citation2009). The County View primarily supports meta-analysis of the weevil survey, allowing for examination of the existing coverage of state and county records by weevil species. Although it is recommended to standardize enumerated information when portrayed in a choropleth map, the County View depicts raw number counts due to the low number of the survey sites (Krygier & Wood, Citation2011) and feedback from the targeted user group. As with the Site View, brushing a county activates an information window containing the county's name and the list of the species within the county that match the filter criteria.
Figure 2. The county view.
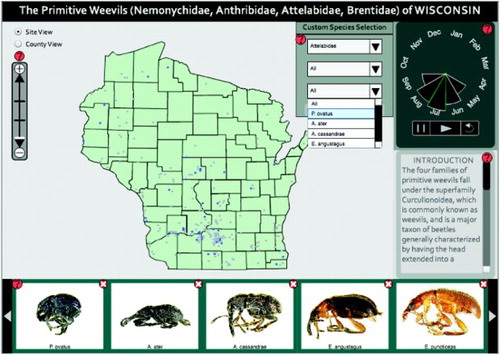
The Custom Species Selection Panel allows the user to filter information by family, genus, or species, an important hierarchical structure in systematics. By default, all four families of primitive weevils are included in the Map Panel. The three dropdown menus included in the Custom Species Selection Panel are dynamically linked such that selection of a family (the top dropdown) updates the available selection parameters in the genus and species dropdown menus (). The Selected Species Panel then provides feedback to the user about which species have been selected and are currently displayed in the Map Panel, providing a dorsal image of each species included within the filter criteria (). Brushing a species image in the Selected Species Panel highlights the site or county containing the given species in the Map Panel and provides additional details about the species in the Information Panel. The user can further refine their species filter criteria using the close buttons included with each species image in the Selected Species Panel.
Figure 3. The custom species selection panel, allowing filtering by family, genus, and species. Parameters of the dropdown menus update according to prior selections. In this case, the family Nemonychidae and genus Cimberis have been selected.
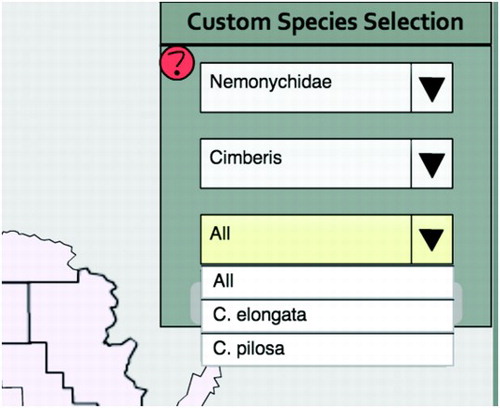
Figure 4. The selected species panel, updating content according to the user's filter criteria in the custom species selection panel.
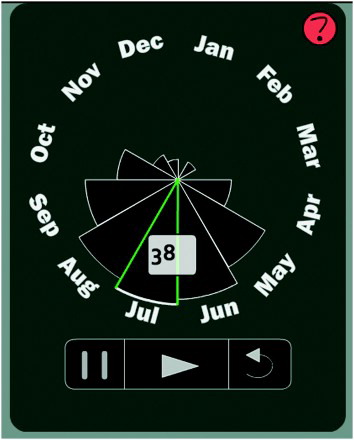
The Nightingale Temporal Clock Panel () provides an overview of the phenological information contained within the weevil survey, aggregated by month of the year. The size of each slice of the Nightingale Temporal Clock represents the relative number of species identified within that month, regardless of year, and thus provides an impression of seasonal variation. The Nightingale Temporal Clock Panel also allows the users to filter the Map Panel by time through direct manipulation of the Nightingale Temporal Clock itself or through the provided set of video cassette recorder sequence controls.
Figure 5. The nightingale temporal clock panel, which updates according to filter criteria in the selected species panel.
Finally, the Information Panel is populated with details about a selected weevil species, displaying a ventral image of the species and information about its family, genus, habitat, and host plant. A ‘how-to’ feature is provided for every panel to improve the usability of the application (Harrower & Brewer, Citation2003). Upon selecting the how-to button within a panel, the map activates an information panel containing a set of instructions for using the given panel.
4. Conclusion
Weevil Viewer is an online, interactive mapping application that depicts a faunal survey of primitive weevils of Wisconsin. The application supports the visual exploration and analysis tasks of land managers, conservation biologists, and entomologists. Following Shneiderman's information seeking mantra, users are able to generate a pair of overview maps, filter or zoom by space, time, and attribute, and retrieve details about individual species of interest, ultimately enabling the generation of new insights. We have continued to populate Weevil Viewer with new weevil records since its deployment in 2012. Weevil Viewer is a proof-of-concept application with potential extension to other biodiversity surveys. Future work includes evaluation of and refinement to the Weevil Viewer interface and transition of the Weevil Viewer concept to other insect taxa under study at the UW – Madison Young Lab.
Software
Weevil Viewer was built using Adobe Flash.
Acknowledgements
We wish to acknowledge the UW – Madison Young Lab for supporting the field collection of the survey dataset, as well as input and feedback on the Weevil Viewer application, and the Wisconsin Insect Research Collection for providing the historical information included in the survey dataset.
Related Research Data
References
- Auer, T., Maceachren, A., Mccabe, C., Pezanowski, S., & Styker, M. (2011). HerbariaViz: A web-based client-server interface for mapping and exploring flora observation data. Ecological Informatics, 6, 93–110. doi: 10.1016/j.ecoinf.2010.09.001
- Best, B., Halpin, P., Fujioka, E., Read, A., Qian, S., Hazen, L., & Schick, R. (2007). Geospatial web services within a scientific workflow: Predicting marine mammal habitats in a dynamic environment. Ecological Informatics, 2, 210–223. doi: 10.1016/j.ecoinf.2007.07.007
- Dou, W., Ziemkiewicz, C., Harrison, L., Jeong, D. H., Ryan, R., Ribarsky, W., Wang, X. and Chang, R. (2010). Comparing different levels of interaction constraints for deriving visual problem isomorphs. Visual Analytics Science and Technology (VAST), 2010 IEEE Symposium on, 195–202.
- Harrower, M., & Brewer, C. A. (2003). ColorBrewer.org: An online tool for selecting colour schemes for maps. The Cartographic Journal, 40(1), 27–37. doi: 10.1179/000870403235002042
- Krygier, J., & Wood, D. (2011). Making maps: A visual guide to map design for GIS. Guilford Press. New York, USA.
- Maceachren, A. M. (1994). Visualization in modern cartography: Setting the agenda. In A. M. Maceachren & D. R. F. Taylor (Eds.), Visualization in modern cartography (pp. 1–12). Oxford, England: Pergamon.
- Mcguire, M., Gangopadhyay, A., Komlodi, A., & Swan, C. (2008). A user-centered design for a spatial data warehouse for data exploration in environmental research. Ecological Informatics, 3, 273–285. doi: 10.1016/j.ecoinf.2008.08.002
- Peuquet, D. J. (1994). It s about time: A conceptual framework for the representation of temporal dynamics in geographic information systems. Annals of the Association of American Geographers, vol. 84, no. 3, pp. 441–461.
- Robinson, A., Roth, R., & Maceachren, A. (2011). Designing a web-based learning portal for geographic visualization and analysis in public health. Health Informatics, 17, 191–208. doi: 10.1177/1460458211409718
- Roth, R. E., & Harrower, M. (2008). Addressing map interface usability: Learning from the lakeshore nature preserve interactive map. Cartographic Perspectives, 60(Spring), 46–66.
- Roth, R. E., Maceachren, A. M., & Mccabe, C. A. (2009). A workflow learning model to improve geovisual analytics utility. In 24th international cartographic conference, Santiago, Chile, 1–10.
- Shneiderman, B. (1996). The eyes have it: A task by type taxonomy for information visualization. in Conference on Visual Languages, Boulder, CO, pp. 336–343, 1996.
- Slocum, T. A., Mcmaster, R. B., Kessler, F. C., & Howard, H. H. (2009). Thematic cartography and geovisualization (Third Edition). Prentice Hall Series in Geographic Information Science. Prentice Hall.