
Abstract
Hydrogeological research lacks a standard methodology for supporting the management of groundwater resources in territory planning. The mapping of geological units in terms of their hydrogeological properties (such as permeability, effective infiltration, hydro-capacity) may provide a propaedeutical tool for calibration and validation of regional scale hydrogeological components (aquifer, aquiclude, aquitard). This work presents a hydrolithological map based on analysis of the 1:100,000 official cartography (provided by the Italian Geological Survey). The study area includes three distinct administrative regions (Tuscany, Latium and Umbria) and is a part of the central Apennines (Italy), an orogenic segment with distinctive tectono-stratigraphic sequences characterized by different degrees of permeability. A methodological approach is described that revises the geological information from the original cartography and builds a multicriteria database. The results are schematized in the attached map (at 1:100,000 scale) where the ‘hydrolithological complex’ (i.e. complex grouping lithologies with genetic and tectonic affinities and showing internal textural and compositional similarities that produce a comparable behaviour regarding groundwater flow and storage) is used as the key unit. Thematic maps illustrating permeability variation in the area and ‘macro-complexes’ are also included. The information is presented to outline the importance of revising, updating, and homogenizing geological cartography for providing direct multiscalar analysis suitable for territory planning.
1. Introduction
The characterization and evaluation of groundwater resources in wide areas is a necessary step to defining geo-environmental criteria necessary for decision-making in territory planning. Researchers continuously assess hydrogeological guidelines for developing and updating the source water management plans, and providing accurate and updated cartographic support (e.g. CitationBrown, Lloyd, & Jacobson, 1990; CitationDesiderio, Folchi Vici D'Arcevia, Nanni, & Rusi, 2012; CitationTeixeira, Chaminé, Carvalho, Pérez-Alberti, & Rocha, 2013). Although the assessment of the hydrogeological scenario typically integrates a large spectrum of data sources, spanning engineering prospecting and monitoring to direct field surveys, it still lacks a standard methodology for the mapping of geological units in terms of their hydrogeological properties. In Italy, different hydrogeological approaches have been proposed for classifying geological units on the basis of their common hydrogeological features, such as permeability (CitationCelico, De Vita, Monacelli, Scalise, & Tranfaglia, 2005), effective infiltration (CitationBoni, Bono, & Capelli, 1986), and hydro-capacity (CitationCapelli et al., 2012). Independently from the classification scheme, it is necessary to aggregate the geological units into appropriate complexes with hydrological affinities. The preparation of a hydrogeological map needs an adequate geological cartography illustrating the geometry and inherent lithological properties of the units outcropping in a study area. The better the geological information supplied, the better the hydrogeological interpretations. As a result, policies concerning regional groundwater extraction and preservation can then be based on critical geoscience information.
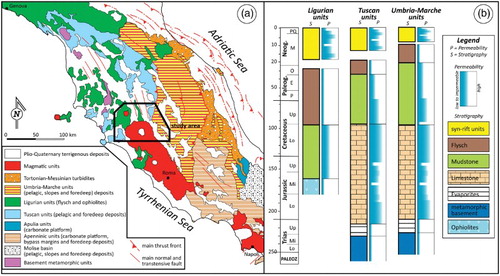
This work presents a hydrolithological map at a scale of 1:100,000 of a portion of central Italy pertaining to the inner sector of the orogenic chain of the Apennines (a) and includes the administrative regions of Tuscany, Latium and Umbria (see the Main map). The selected area constitutes an appropriate case study for illustrating the complexities that result from regional geological mapping with a focus upon hydrogeology, because: (i) it belongs to an orogenic sector that experienced polyphase evolution (e.g. CitationBonini et al., 2014; CitationButler et al., 2004; CitationCarmignani et al., 2001; CitationJolivet et al., 1998; CitationMassoli et al., 2006; CitationPauselli et al., 2006); (ii) it includes three main paleogeographic domains (named Ligurian Domain, Tuscan Domain, Umbria-Marche Domain; e.g. CitationBarchi, Minelli, & Pialli, 1998; CitationBrogi & Fabbrini, 2009; CitationCarmignani et al., 1994; CitationCarmignani, Conti, Cornamusini, & Pirro, 2013; CitationElter, Grasso, Parlotto, & Vezzani, 2003; CitationGhisetti & Vezzani, 1997; CitationParotto & Praturlon, 1975) characterized by peculiar tectono-stratigraphic sequences (b); (iii) the tectono-stratigraphy of each paleogeographic domain can be interpreted in terms of lithologies with different hydrogeological behaviours and hydrodynamics (e.g. CitationMastrorillo & Petitta, 2010; CitationNanni & Vivalda, 2005); (iv) the region contains distinctive major aquifers (the carbonate sequences and the volcanic deposits) that are partitioned into separate hydrodynamic compartments by sedimentary basins; and (v) the available geological cartography needs revision and homogenization. A geographical information system (GIS) has been used for acquiring, managing and visualizing the geological information. The GIS-based workflow enabled use of a database supporting multiscalar and multicriteria analysis. The paper emphasizes the methodological approach used for collecting cartographic materials, building a geological database and providing original cartography considering the ‘hydrolithological complex’ as the key unit at regional scale.
Figure 1. (a) Simplified geological map of the central Apennines showing the distribution of the main paleogeographic domains (modified and adapted from CitationBigi et al., 1990); (b) schematic relationship between palaeographic domains, lithological composition and permeability attitude. Note the width of boxes illustrating the permeability is expressed in chronostratigraphic terms and does not reflect the thickness of the lithological complexes. Stratigraphy of paleogeographic domains are obtained and adapted from CitationCarmignani et al. (1994), CitationJolivet et al. (1998), CitationBrogi and Fabbrini (2009), CitationMastrorillo and Petitta (2010).
2. Existing geological maps
The size of the investigated area (about 9,000 km2) and the importance of developing a multiscale synthetic hydrogeological model require two different cartographic scales:
– local model: 1:5,000–1:10,000;
– regional model: 1:50,000–1:100,000;
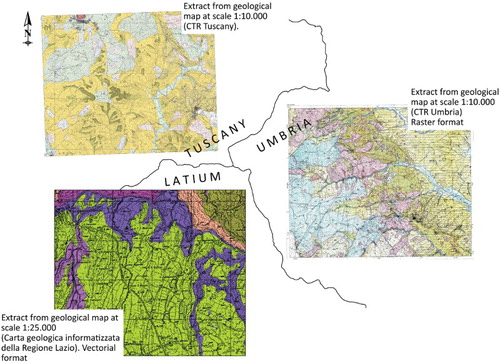
For the study area, available geological maps at large scale (e.g. at a scale of 1:10,000 or 1:5,000, or higher) are provided by the local administration (cadastre, municipality and province). Unfortunately, all these cartographic products are based on different and highly heterogeneous mapping criteria (i.e. lithological classification, hierarchical subdivision of units) that make their assembly unrealistic (). The Italian Geological Survey is currently providing geological maps at a scale of 1:50,000 within the CARG project. The CARG (Geological CARtography) is a ‘work-in-progress’ project aimed at producing geological and geothematic sheets at a scale of 1:50,000 covering the entire Italian national area. However, the 1:50,000 map collection does not provide complete coverage of the study area. The official cartography at a scale of 1:100,000 provided by the Italian Geological Survey covers the whole Italian national territory with a total of 277 sheets and was chosen as the basis for the classification of hydrogeological formations. This cartography is available both in raster and vector formats. Six sheets (named n° 128, 129, 130, 135, 136, 137) cover the area considered in this work. Additional information about the cartographic design is reported in the Appendix.
Figure 2. Examples of available geological cartography for three different administrative regions, showing heterogeneous mapping criteria. CTR: Regional technical cartography. The extracted frames are from: CitationRegione Toscana (2006; http://www.regione.toscana.it), for Tuscany region; CitationRegione Umbria (1999; http://www.territorio.regione.umbria.it/), for Umbria region; CitationCosentino and Pasquali (2012), for Latium.
3. Methodology
schematizes the adopted rationale used for (i) collating the geological information from existing paper maps at a scale of 1:100,000, (ii) developing the procedure for map digitization and (iii) compiling the final map for the hydrolithological complexes.
Figure 3. Flow chart illustrating the methodology adopted for hydrolithological complex mapping in the study area.
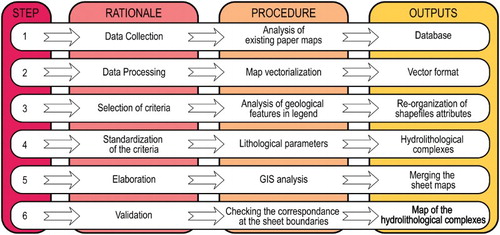
Each step of this approach is characterized by a specific procedure that includes creation of the database, data processing and the final map.
A series of preparatory steps has been done:
– collection of the official cartography (original products) both in paper and in vector formats;
– validation of the vector products by comparing with the original paper maps;
– re-organization and validation of shapefile attributes associated with the digital products;
– selection and standardization of criteria used for classifying the geological units in terms of lithological properties and hydrogeological behavior (hydrolithological complexes).
The major difficulty encountered in this process was due to the lack of a homogeneous cartographic legend for defining unequivocal geological units, due to different criteria used by the geological surveyors. This heterogeneity made it impossible to have available a uniform geological database for the entire Italian territory. The standardization of criteria has been based on the lithological features of the geological units obtained through a critical review of the cartographic legends. For each geological unit, information about chronostratigraphy, genetic environment, structural-stratigraphic setting, compositional and textural properties has been extrapolated. This process allowed us to homogenize the geological information and so produced a lithological classification with a hydrogeological focus.
4. Hydrolithological Complexes
The hydrolithological legend consists of the redistribution of the original geological units within a three-order hierarchical classification ():
– class: identifying the main lithological groups on the basis of the lithogenetic criteria (sedimentary, magmatic and metamorphic classes);
– macro-complex: grouping geological units having lithogenetic and chronostratigraphic affinities;
– complex: grouping lithologies with genetic and tectonic affinities, showing internal textural and compositional similarities that produce similar behaviour regarding groundwater flow and storage.
Figure 4. Hierarchical classification used for the redistribution of the geological units. The qualitative permeability attributed are also shown.
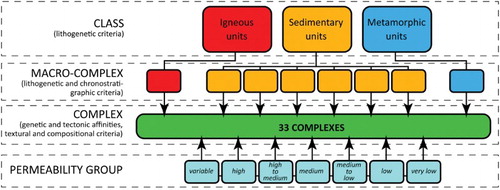
A qualitative evaluation of the permeability (from very low to high rate) has been attributed to each complex. This produced 3 classes, 8 macro-complexes and 32 complexes, the latter distributed in 7 permeability groups. The hierarchical classification is presented in , where the details on the lithological and hydrological properties of each complex are reported.
Table 1. The hydrolithological complexes obtained for the study area.
5. GIS Analysis
A GIS has been used to implement a hierarchical and multiscalar cartographic database for representing the spatial distribution of the hydrolithological complexes at different scales. The following GIS operations were used to achieve the above classification:
– for each shapefile (corresponding to a single geological sheet at scale 1:100,000), an unequivocal code was assigned to each record corresponding to the geological units;
– the original polygons (geological units) were aggregated into new polygons (complexes);
– new shapefiles were merged to a single uniform thematic layer;
– editing operations were used for modifying polygonal features at the boundaries between adjacent sheets, on the base of topological criteria.
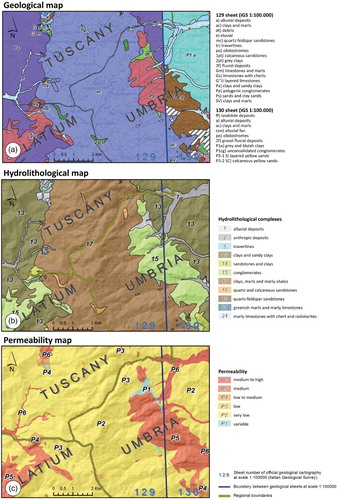
The shapefile of the obtained hydrolithological map (see example in ) has an attribute table composed of both original and edited records. Starting from the original geological map (a), the attributes allow us to visualize the map in terms of hydrolithological features (b). The hydrolithological map constitutes the source map supporting production of thematic maps. The other subsequent maps can be derived by coupling base information provided by the hydrological maps with different themes, e.g., effective precipitation, piezometry, land cover. c illustrates an example of thematic map obtained by assigning the hydrolithological complexes into different, qualitatively determined, groups of permeability.
Figure 5. (a) An extract of the official geological cartography at a scale of 1:100,000 (Italian Geological Survey), including the administrative boundaries. Note the dissimilarity between legends of each sheet; (b) extract of the hydrolithological map of the study area and (c) the derivative permeability distribution map.
6. Conclusions
The hydrolithological map presented in this study is based on the revision (production, interpretation and merging) of the original geological cartography at scale of 1:100,000 provided by the Italian Geological Survey. By reprocessing the geological information in a multicriteria database performed using a GIS, the map illustrates the spatial distribution of different hydrolithological complexes regulating the regional hydrogeological setting in this portion of the central Apennines.
Assessment of this GIS-based hydrolithological map provides the following considerations:
The hydrolithological complex (grouping lithologies with genetic and tectonic affinity, and showing similar hydrological behaviour on the basis of their lithological properties) can represent the reference cartographic key for supporting hydrogeological study. The results from this study point out the importance of defining a standard method for grouping the geological units into appropriate complexes with hydrological affinities for the assessment of an official hydrolithological map.
The approach used here outlines that hydrogeology requires the collation and revision of criteria used for geological cartography. Dissimilarities between legends of each 1:100,000 sheet (Italian Geological Survey) do not allow the organization of a uniform geological database for the entire Italian territory. Consequently, it is not possible to build a GIS-based geological map, but only thematic maps derived from the input, interpretation and merging of geological units. Despite various limitations in homogenizing the geological database in terms of hydrolithologies, the regional-scale approach constitutes a preliminary, but necessary, step for assessing the hydrogeological scenario.
The hydrolithological map provides basic geo-environmental information directly supporting the regional-scale management of groundwater. Identification and validation of the main hydrogeological components (aquifer, aquiclude, aquitard), as well as the planning of groundwater exploration activities, can be extracted from the spatial distribution of the hydrolithological complexes. With regard to territory planning, it is worth noting that this GIS-based hydrolithological map is an example of digital product that can be easily upgraded, combined and integrated with further geo-environmental database (e.g. seismicity, distribution of anthropogenic activities, land use, etc.) in order to extract derivative products.
In the case of local territory planning, it is necessary to produce hydrolithological maps derived from original geological cartography at scale higher than 1:10,000. The maps at larger scale are based on heterogeneous cartographic criteria provided by the individual local administrations. This heterogeneity does not provide a direct GIS multiscalar analysis for territory planning.
Main Map: Hydrolithological Map for the Area between Tuscany, Latium, and Umbria Regions (Italy)
Download PDF (142.5 MB)Software
ESRI ArcGIS 10.1 was used for production of the original shapefiles provided by the Italian Geological Survey and for map visualization. Further images shown in the map were produced using Adobe Illustrator CS and Coreldraw X3. Final editing of the map was performed using Photoshop CS4.
Acknowledgements
This work benefited of constructive reviews by Alexandra Vieira Suhogusoff, Chris Orton and José Augusto Alves Teixeira. We thank the Editor, Mike J. Smith, and his staff for the careful editorial work.
Related Research Data
References
- Barchi, M. R., Minelli, G., & Pialli, G. (1998). The CROP 03 profile; A synthesis of resultson deep structures of the Northern Apennines. Memorie della Società Geologica Italiana, 52, 383–400.
- Bigi, G. et al. (1990). Structural model of Italy, in Progetto Finalizzato Geodinamica, SELCA, Florence.
- Boni, C., Bono, P. & Capelli, G. (1986). Schema idrogeologico dell'Italia Centrale. Memorie della Società Geologica Italiana, 35, 991–1012.
- Bonini, M., Sani, F., Stucchi, E. M., Moratti, G., Benvenuti, M., Menanno, G. & Tanini, C. (2014). Late Miocene shortening of the Northern Apennines back-arc. Journal of Geodynamics, 74, 1–31. doi: 10.1016/j.jog.2013.11.002
- Brogi, A., & Fabbrini, L. (2009). Extensional and strike-slip tectonics across the Monte Amiata–Monte Cetona transect (Northern Apennines, Italy) and seismotectonic implications. Tectonophysics, 476, 195–209. doi: 10.1016/j.tecto.2009.02.020
- Brown, D. M., Lloyd, J. W., & Jacobson, G. (1990). Hydrogeological model for Amadeus Basin aquifers, central Australia. Australian Journal of Earth Sciences, 37, 215–226. doi: 10.1080/08120099008727922
- Butler, R. W. H., Mazzoli, S., Corrado, S., De Donatis, M., Di Bucci, D., Gambini, R., … Zucconi, V. (2004). Applying thick-skinned tectonic models to the Apennine thrust belt of Italy—Limitations and implications. In K. R. McClay, ed., Thrust tectonics and hydrocarbon systems. AAPG Memoir, 82, 647–667.
- Capelli, G., Mastrorillo, L., Mazza, R., Petitta, M., Baldoni, T., Banzato, F., … Teoli, P. (2012). Carta idrogeologica del territorio della regione Lazio, scala 1:100.000 (4 sheets). Regione Lazio, SELCA Firenze. http://www.idrogeologiaquantitativa.it/wordpress/?p=2022&lang=it
- Carmignani, L., Conti, P., Cornamusini, G., & Pirro, A. (2013). Geological map of Tuscany (Italy). Journal of Maps, 9(4), 487–497. doi: 10.1080/17445647.2013.820154.
- Carmignani, L., Decandia, F. A., et al. (2001). Inner Northern Apennines. In VAi, G. B., & Martini, I. P. (Eds.) Anatomy of an Orogen: the Apennines and Adjacent Mediterranean Basins. Dordrecht: Kluwer, 197–214.
- Carmignani, L., Decandia, F. A., Fantozzi, P. L., Lazzarotto, A., Liotta, D., & Meccheri, M. (1994). Tertiary extensional tectonics in Tuscany (Northern Apennines, Italy). Tectonophysics, 238, 295–315. doi: 10.1016/0040-1951(94)90061-2
- Celico, P., De Vita, P., Monacelli, G., Scalise, A. R., & Tranfaglia, G. (2005). Hydrogeological map of southern Italy 1:250.000 APAT – Università di Napoli “Federico II”.
- Cosentino, D. and Pasquali, V. (2012). Carta geologica informatizzata della Regione Lazio Scala 1:25.000. Regione Lazio Agenzia Regionale Parchi Area Difesa del Suolo, http://www.arplazio.it/
- Desiderio, G., Folchi Vici D'Arcevia, C., Nanni, T., & Rusi, S. (2012). Hydrogeological mapping of the highly anthropogenically influenced Peligna Valley intramontane basin (Central Italy). Journal of Maps, 8, 165–168. doi: 10.1080/17445647.2012.680778
- Elter, P., Grasso, M., Parlotto, M., & Vezzani, L. (2003). Structural setting of the Apennine-Maghrebian thrust belt. Episodes, 26, 205–211.
- Ghisetti, F., & Vezzani, L. (1997). Interfering paths of deformation and development of arcs in the fold-and-thrust belt of the central Apennines (Italy). Tectonics, 16, 523–536. doi: 10.1029/97TC00117
- Jolivet, L., Faccenna, C., Goffé, B., Mattei, M., Rossetti, F., Brunet, C., … Parra, T. (1998). Midcrustal shear zones in postorogenic extension: Example from the northern Tyrrhenian Sea. Journal of Geophysical Research-Solid Earth, 103, 12123–12160. doi: 10.1029/97JB03616
- Massoli, D., Koyi, H. A., & Barchi, M. R. (2006). Structural evolution of a fold and thrust belt generated by multiple décollements: Analogue models and natural examples from the Northern Apennines (Italy). Journal of Structural Geology, 28, 185–199. doi: 10.1016/j.jsg.2005.11.002
- Mastrorillo, L., & Petitta, M. (2010). Effective infiltration variability in the Umbria-Marche carbonate aquifers of central Italy. Journal of Mediterranean Earth Sciences, 2, 9–18.
- Nanni, T., & Vivalda, P. (2005). The aquifers of the Umbria-Marche Adriatic region: relationships between structural setting and groundwater chemistry. Bollettino della Società Geologica Italiana, 124, 523–542.
- Parotto, M., & Praturlon, A. (1975). Geological summary of central Apennines. Quaderni de La Ricerca Scientifica, 90, 257–311.
- Pauselli, C., Barchi, M. R., Federico, C., Magnani, B., & Minelli, G. (2006). The crustal structure of the Northern Apennines (central Italy): An insight by the CROP03 seismic line. American Journal of Science, 306, 428–450. doi: 10.2475/06.2006.02
- Regione Toscana. (2006). Carta Litologica della Toscana finalizzata alla pedologia, scala 1:250.000. http://www.regione.toscana.it/
- Regione Umbria. (1999). Carta Geologica numerica in scala 1:200.000. http://www.territorio.regione.umbria.it/
- Teixeira, J., Chaminé, H. I., Carvalho, J. M., Pérez-Alberti, A., & Rocha, F. (2013). Hydrogeomorphological mapping as a tool in groundwater exploration. Journal of Maps, 9, 263–273. http://dx.doi.org/10.1080/17445647.2013.776506. doi: 10.1080/17445647.2013.776506
Appendix
Topographic base map at 1:100,000 scale is provided by the Istituto Geografico Militare (IGM) and available by the Web Map Services (WMS) at the Italian National Geoportal (http://wms.pcn.minambiente.it/ogc?map=/ms_ogc/WMS_v1.3/raster/IGM_100000.map). Toponyms derived from the Web Features Services (WFS) of the Italian National Geoportal (http://wms.pcn.minambiente.it/ogc?map=/ms_ogc/wfs/Toponimi_2011.map). Regional boundaries are from the database provided by the Italian National Institute of Statistics (ISTAT) at http://www.istat.it/it/archivio/24580 (2011). The shaded relief map is derived from the digital elevation model with 30 m spatial resolution (SRTM) available at http://earthexplorer.usgs.gov.