
Abstract
The Map of Astronomy in Europe has been designed to demonstrate how diverse information about a specific topic can be put together and presented in an attractive way in order to raise interest of society in the topic – in this case astronomical observations. The map represents information on several phenomena and objects related to astronomical observations in Europe and have been compiled from data collected from numerous publicly available sources during 2012–2013. The data were collected, transformed and processed using different methods to create geographic information on the visibility of solar eclipses and maximum possible percentage of sunshine hours for the geographic extent of Europe. Upon requests of amateur astronomers that made up the primary target group, the map was complemented by astronomical observatories, planetaria, astronomical clocks, meteorite craters and eventually by the most famous UNESCO World Heritage sites related to ancient or modern astronomical observations. Explanatory graphs, charts and lists of the objects were added for better understanding of the map information. Data verification, generalization and filtering, classification of the objects, building the GIS database, analysis of data, and cartographic visualization was performed at the Centre for Cartography at Vilnius University. Special attention was given to map design with an attempt to represent both very modern and historical objects in a consistent manner. The reference scale of the printed map is 1:8,000,000. It contains supplementary maps at scale 1:40,000,000 and 1:35,000,000. The size of the map image is 53 × 63 cm.
1. Introduction
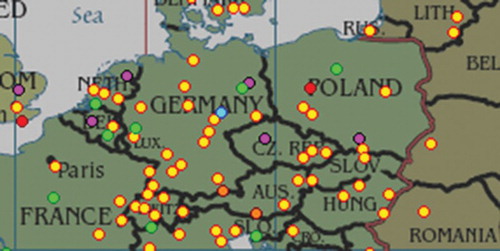
Star charts, planet maps and astronomical phenomena such as solar and lunar eclipses, meteor showers, and planet conjunctions are interesting not only to astronomers. Many people enjoy observing both rare and regular astronomy events. Some exciting events such as the rare transit of Venus and not so rare but visually impressive conjunction of Venus and Jupiter (CitationByrd, 2012) took place in 2012. These events inspired the authors to start collecting information on astronomical events in Europe for representation on a single map. The primary goal was to show the areas of visibility of total and annular solar eclipses for the next fifty years. Maps of eclipses are not rare and can be easily found for various territories and periods of time on various sites including NASA's official eclipse Web site (eclipse.gsfc.nasa.gov), the Working Group on Solar Eclipses (www.eclipses.info) and Eclipse-Maps.com. As they seemed to be designed for people who are already interested in astronomy, the team of Cartography master-degree students at Vilnius University studied the possibility to design a wall map that would spread general knowledge about astronomical events, objects and observations in Europe. The survey showed that some types of objects, namely meteorite craters, observatories, planetarium, astronomical street clocks, and cultural heritage objects related with astronomical observations, seemed interesting to a wide audience. Generally it is not difficult to locate particular objects (especially meteorite craters, http://www.lpi.usra.edu/meteor/metbull.php; astronomical observatories, http://www.eso.org, planetaria, http://www.aplf-planetariums.info) through numerous webmaps, however the majority of such maps are at a small or a very large scale (in many cases just one object at a time), are not visually attractive and either only show attributes in a popup window () or several attributes on one map (). Much less cartographic information is available for Europe. Collecting comprehensive systematic information on diverse objects on one map and representing it at the same scale would enable the user to perceive the patterns of spatial distribution and to detect various relationships. Such a map would have educational value and could raise public interest thus contributing to astronomical tourism which is promoted in countries such as Canada, the USA (CitationCollison, 2012), Chile (CitationIaniszewski, 2012), South Africa (CitationStarlight Initiative, 2012), the Philippines (CitationSoleimani Najafabadi, 2012) but is still not well known in Europe.
Figure 1. Visualization of a planetarium by a Google Maps' automatic balloon (CitationAssociation of French Speaking … , 2013).
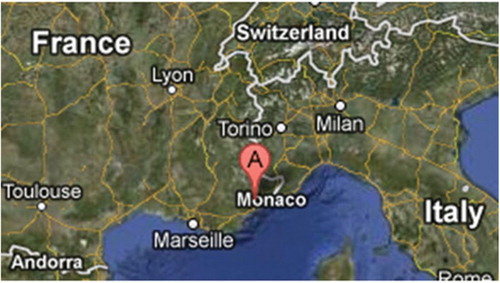
Figure 2. Extract form a map of world's observatories showing their types (CitationEuropean Southern Observatory, 2014).
In several iterations during which professional and amateur astronomers were consulted the project developed into a complex map showing 170 observatories, 656 planetaria and 47 astronomical street clocks, 40 meteorite-craters objects and sites, solar eclipse visibility zones and a surface of average percentage of clear nights. In order to make the map more attractive it was complemented by additional charts, schemes and lists as well as by photographs of the 21 UNESCO World Heritage sites related to celestial observations.
2. Project goal and target groups
The goal of this cartographic project was is to collect diverse information related to astronomy in Europe and to convey it in a way that would show the variety of objects while stimulating geographic thinking. Ideally, the map would enable hypotheses concerning links between different objects on the one hand, and phenomena based on similarity of their spatial distribution patterns on the other.
Three target groups were considered: amateur astronomers, educational groups (pupils, teachers and students) and the general public. A compromise was found between differing requirements for cartographic visualization resulting from the specific uses by different groups. The project was presented at a meeting of amateur and professional astronomers in May 2012 at the Molėtai Astronomical Observatory in Lithuania. It received positive responses, particularly for its ability to demonstrate the possibilities inherent in using maps for the popularization of astronomy.
3. Objects represented
Thematic map information encompasses discrete objects and continuous phenomena. They can therefore be grouped in different ways, including: information on natural and cultural objects; natural phenomena; observation facilities and astronomy-related heritage among others. For the purpose of cartographic representation all graphical objects were grouped by their geometric properties:
Continuous surfaces, covering all of a target area: high percentage of clear nights which make for good conditions for astronomical observation;
Polygons: total and annular solar eclipse zones;
Points: meteorite craters, observatories, planetaria, astronomical clocks, points of the Struve geodetic arc and other astronomical heritage objects, outdoor scale Solar System models;
Raster images without geographic reference: photographs and charts.
The map is supplemented with an explanatory chart of solar eclipses, an explanatory chart and a photograph of an astronomical clock, lists of observatories and of UNESCO World Heritage (CitationUNESCO … , 2013) sites, a chart representing the distribution of objects related to astronomical observations and charts of observatories by telescope type and by year of foundation.
3.1. Solar eclipses
The Main Map frame shows 11 visibility zones of contemporary eclipses: five total eclipses (2006, 2015, 2024, 2026 and 2027) and six annular eclipses (2003, 2005, 2028, 2030, 2039 and 2048) visible in Europe in the period of 2000–2050. Each zone is labelled with exact dates and the type of eclipse is represented by the darkness of the grey colour of the semi-transparent polygonal sign. Partial eclipses were omitted due to their relatively large number. The full list of eclipses in the period of 2001–2100 can be found at the NASA site http://eclipse.gsfc.nasa.gov/SEcat5/SE2001-2100.html.
The solar eclipse zones were calculated by using NASA Solar Eclipse Explorer (CitationJavaScript Solar … , 2012), which provides eclipse predictions for point coordinates. A custom JavaScript code was created for calling on the system recursively to obtain the coordinates of each eclipse in the territory covered by the map ().
Figure 3. Solar eclipse visibility zones in Europe for the period 2000–2050.
3.2. Sunshine duration
The surface with isolines representing percent of maximum possible bright sunshine is represented on an inset map. The average is calculated from the data on percentage of sunshine hours provided by the Climate Research Unit at the University of East Anglia (CitationClimate Research … , 2013; CitationNew et al., 1999) for the period 1961–1990 and represented with a granularity of 10′. These data were converted to raster by using the Nearest Neighbour interpolation method. This raster data was subsequently downsampled to 0.5° and converted to isolines.
3.3. Observatories
One hundred seventy operational observatories that also carry out scientific research have been classified and represented on the main map. Associative signs have been designed by the authors for each of four telescope types: optical, radio, solar and laser (). The dates of establishment are collected in the database though not represented on the paper map. The data on observatories have been collected from several main sources:
IAU Minor Planet Centre – co-ordinates of observatories (CitationIAU Minor Planet Center, 2013);
Milkyweb Astronomical Observatories Guide – observatories grouped by countries (CitationMilkyweb Astronomical … , 2013);
European Southern Observatory (ESO) – major observatories (CitationEuropean Southern Observatory, 2014);
Astronomy Observatory – explanations on observatory types (CitationAstronomy Observatory, 2013).
Figure 4. Symbols for astronomical observatories: optical (a), solar (b), radio (c) and laser (d).
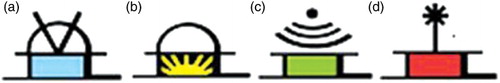
Optical and radio telescopes are the first instruments used in observations of stars, planets and other objects in the sky. Optical telescopes are used to focus light (the visible part of the electromagnetic spectrum) to directly view a magnified image or to collect data through electronic image sensors. Solar telescopes are designed for observations of the sun. They usually detect light with wavelengths in the visible spectrum. Radio telescopes are directional radio antennas, used in radio astronomy. In contrast to optical telescopes, they operate in the radio frequency portion of the electromagnetic spectrum where they can detect and collect data on radio sources. Radio observatories must be located far from major cities to avoid electromagnetic interference from radio, TV, radars etc., just as optical observatories are usually located in places less affected by visible light pollution. Laser observatories for Satellite Laser Ranging and Lunar Laser Ranging use short-pulse lasers, optical receivers and timing electronics to measure the two-way time of flight from ground stations to retroreflector arrays on Earth orbiting satellites and the Moon. Laser ranging data are used to support research in geodesy, geophysics, Lunar science, and fundamental constants (CitationInternational Laser Ranging Service, 2014).
3.4. Planetaria
Simple dot markers on an inset map represent 656 planetaria in 33 European countries. Information on location and attributes was obtained from the International Planetarium Society website (CitationInternational Planetarium Society, 2013).The attributes stored in the database are: name, city, dome diameter and website address. Dome size ranges from 2 to 35 m in diameter. The largest numbers of planetaria are in France, Italy, Germany and the United Kingdom.
3.5. Astronomical clocks
Iconic signs on the main map represent 47 astronomical street clocks dating from the 14th to the twenty-first century. Clocks stored inside museums or other premises were not included. Most of the publicly displayed astronomical clocks are in the United Kingdom, France, Italy and Germany, though two of the oldest are in the Czech Republic.
3.6. Astronomical heritage objects
The concept of heritage is rarely associated with astronomical observations. In order to raise interest the authors have selected 21 sites related to astronomy that are listed in the thematic study ‘Heritage Sites of Astronomy and Archaeoastronomy in the context of the UNESCO World Heritage Convention’ (CitationRuggles & Cotte, 2010), thereby adding four more sites to the 17 provided at Astronomical Heritage Finder (CitationPortal to the Heritage of Astronomy, 2013). On the main map, astronomical heritage sites are marked by symbols and numbers corresponding to those on the 19 photographs. The arrangement is intended to construct a decorative inner frame surrounding the main map frame ().
Figure 5. Locations of UNESCO World Heritage sites represented on the main map.
Besides single sites such as observatories, Heritage site No.11 is a 2800-km long arc of geodetic survey points, stretching across 10 countries. The survey was carried out in 1816–1855 by the astronomer Friedrich Georg Wilhelm Struve. The triangulation yielded the first accurate measurement of a long segment of a meridian that helped to establish the exact size and shape of the Earth. Thus the Struve geodetic arc points (265 main station points) collectively comprise a specific and noteworthy heritage object.
Astronomy heritage is not limited to fixed tangible heritage objects such as monuments, sites and cultural landscapes (CitationPortal to the Heritage of Astronomy, 2013). It is also important to recognize and protect movable objects, the intangible heritage of astronomy (knowledge and ideas), and the natural heritage that is related to astronomy, for example, the zones of good visibility of the dark night sky (CitationInternational Dark Sky Association, 2013). A dark sky and low artificial light pollution is important not only for astronomical observations in particular territories, but also fosters the development of specific types of tourism; in addition to sky watching, activities such as navigation by the stars (CitationRuggles & Cotte, 2010, p. 245). The large East Alpine Starlight Reserve and Grossmugl Starlight Oasis in the Austrian Alps is amongst areas in Europe where the dark night sky is of an exceptional quality.
3.7. Meteorite craters
Dot markers of corresponding diameter on the inset map represent 40 meteorite impact craters in Europe, their visibility on the surface and the relief. These data were collected from the Earth Impact Database (CitationEarth Impact Database, 2013) and the Meteoritical Bulletin Database (CitationMeteoritical Bulletin Database, 2013). The main database table contains six attribute fields: crater name, country, diameter (km), age of the find or fall, exposed and target rock. The smallest crater is 0.08 km in diameter and located in Estonia, and the largest (52 km) is in Sweden. The countries with most meteorite craters are Finland (10 craters), Sweden (6) and the Ukraine (7).
3.8. Outdoor solar system models
Thirteen outdoor scale (drivable/walkable) models of the Solar System at scales from 1:15 million to 1:10 billion are presented on the main map as dot markers. For the largest models – the Spaced Out Project (http://www.spacedout-uk.com) and the Sweden Solar System (http://en.wikipedia.org/wiki/Sweden_Solar_System) locations of some major components are also represented.
4. Database development
The final version of the database contains 1208 records of astronomy heritage objects, astronomical clocks, planetaria, meteorite craters, observatories and Struve geodetic arc points mainly within the geographic boundaries of Europe, but some extending into the neighbouring regions. Not all the attribute values are represented on the map; some are stored for statistics and for use in digital representations ().
Figure 6. Thematic map objects and their attributes in the database.
The collected data were checked for reliability against as many authoritative data sources as were publicly available.
5. Cartographic design
The design is original in so far as the graphically enhanced photographs of the UNESCO World Heritage sites are arranged to form a frame around the main map. Supplementary charts, maps and textual explanations are arranged in simple frames on both sides of the central square frame, resulting in/thus forming a concentric visual structure that gives the map its balanced, symmetric appearance.
The design is generally based on visual juxtaposition between some graphic elements and fonts similar to those of historic maps and the modern simple design that stresses up-to-datedness in the information conveyed concerning observation facilities and scientific schemes that explain astronomical phenomena.
The cartographic background of the main map is rather simple. It encompasses generalized hydrography, state boundaries, state capitals and only some major cities. The representations of the background objects and map labels are designed in a decorative manner. Reference data have been generalized by the authors in order to match the scale of the map (1:8,000,000) and to support the overall design. The cartographic grid is drawn at 10° intervals.
6. Conclusion
The Map of Astronomy in Europe is an inventory type map. It may not be the most exhaustive source of information for each particular type of object, but it has the advantage of geographically combining different aspects of phenomena and of observations, in a way that makes them comprehensible to a wide audience.
Solar eclipses for the period until the year 2050 constitute the primary information. In addition, the map represents the distribution of astronomical observatories, astronomical clocks, planetaria, meteorite craters and various World Heritage sites that are related to astronomy. Such a map makes it easier to understand links between phenomena. The map actually suggests to the user that they can compare categories of information that are not typically linked (e.g. the percentage of clear nights, relief and density of the objects related with astronomical observation). It is a map intended to make people think.
The map has been made more original and attractive by combining classic and modern cartographic design elements, old style photographs and precise GIS maps. It may indirectly raise people's interest in aspects of astronomical observations and suggest sites in Europe worth visiting.
Software
The main data have been collected and maintained in an Esri ArcGIS geodatabase. Adobe Illustrator has been used for cartographic symbols and overall cartographic design. The font for cartographic symbols was created using Font Creator. After import into the geodatabase, the symbols were converted to cartographic ‘signs’. Microsoft Office and Google Documents were used for project documentation and information sharing, and Microsoft Project for project planning and management.
These data for clear days were manipulated using ESRI ArcGIS Desktop with the Spatial Analysis Extension.
Calculation of the eclipse zones and predictions were made using the JavaScript Solar Eclipse Explorer online calculator from NASA and a custom JavaSript code to extract the information in batches.
Main Map: Map of Astronomy in Europe
Download PDF (94.7 MB)Acknowledgements
Thanks are due to members of the student team for collection and processing of data, project documentation and useful suggestions concerning the map's design. We thank the Centre for Cartography at Vilnius University for sharing its GIS data on hydrography and state boundaries of Europe for this map.
Related Research Data
References
- Association of French Speaking Planetariums. (2013). Retrieved July 7, 2014, from http://www.aplf-planetariums.org
- Astronomy Observatory. (2013). Retrieved July 7, 2014, from http://www.astronomy-national-public-observatory.org/
- Byrd, D. (2012). Illustrated guide to venus and jupiter conjunction in March 2012. Astronomy Essentials. March 4, 2012. Retrieved May 12, 2014, from http://earthsky.org/astronomy-essentials/pictorial-guide-to-venus-jupiter-conjunction-in-february-march-2012
- Climate Research Unit of University of East Anglia. (2013). Retrieved July 7, 2014, from http://www.cru.uea.ac.uk/
- Collison, F. M. (2012). Astronomical tourism: An often overlooked sustainable tourism segment. Great lakes hospitality and tourism educators conference. 2012 (3). Retrieved July 7, 2014, from http://scholarworks.gvsu.edu/cgi/viewcontent.cgi?article=1003&context=glhtec
- Earth Impact Database. Managed by The Planetary and Space Science Centre (PSSC). (2013). Retrieved July 7, 2014, from http://www.passc.net/EarthImpactDatabase/index.html
- European Southern Observatory (ESO). (2014). Retrieved July 7, 2014, from http://www.eso.org/~ndelmott/obs_sites.html
- Ianiszewski, J. R. (2012). Circulo astronomicalo. http://www.circuloastronomicalo.cl
- IAU Minor Planet Center. (2013). Retrieved July 7, 2014, from http://www.minorplanetcenter.net/iau/lists/ObsCodes.html
- International Dark Sky Association. International dark sky parks. (2013). Retrieved July 7, 2014, from http://www.darksky.org/mc/page.do?sitePageId=59827
- International Laser Ranging Service. (2014). Retrieved July 7, 2014, from http://ilrs.gsfc.nasa.gov
- International Planetarium Society. (2013). Retrieved July 7, 2014, from http://www.ips-planetarium.org
- JavaScript Solar Eclipse Explorer. (2012). Retrieved August 14, 2013, from http://eclipse.gsfc.nasa.gov/JSEX/JSEX-index.html
- Meteoritical Bulletin Database. Nomenclature Committee of the Meteoritical Society. (2013). Retrieved July 7, 2014, from http://www.lpi.usra.edu/meteor/metbull.php
- Milkyweb Astronomical Observatories Guide. (2013). Retrieved July 7, 2014, from http://www.observatory-guide.org/europa.html
- New, M., Hulme, M., & Jones, Ph. (1999). Representing twentieth-century space–time climate variability. Part I: Development of a 1961–90 mean monthly terrestrial climatology. Journal of Climate, 12, 829–856. Retrieved June 5, 2014, from http://journals.ametsoc.org/doi/full/10.1175/1520-0442%281999%29012%3C0829%3ARTCSTC%3E2.0.CO%3B2 doi: 10.1175/1520-0442(1999)012<0829:RTCSTC>2.0.CO;2
- Portal to the Heritage of Astronomy. (2013). Retrieved July 7, 2014, from http://www2.astronomicalheritage.net/index.php/what-is-astronomical-heritage
- Ruggles, C., & Cotte, M. (Eds.). (2010). Heritage sites of astronomy and archaeoastronomy in the context of the UNESCO world heritage convention: A thematic study. 2010. ICOMOS, Paris, 272p. (e-book at: http://openarchive.icomos.org/267/).
- Soleimani Najafabadi, S. (2012). Astronomical tourism (Astro-Tourism) in Cebu, Philippines: Essential features in selected destinations and its complementing visitor attractions. Proceedings of the international conference on trade, tourism and management (ICTTM'2012). December 21–22, 2012 Bangkok.
- Starlight Initiative. (2012). Star Routes from the desert to the sea: From the plains to the mountains. Retrieved July 7, 2014, from http://www.starlight2007.net/tourism.htm
- UNESCO World Heritage Centre. (2013). Retrieved July 7, 2014, from whc.unesco.org