
Abstract
In this paper, we present a geomorphological landslide inventory map for an intermountain catchment in the southern Italian Apennines. The study area is seismically active, and it is characterized by high uplift rates produced by Quaternary tectonics. A total of 531 landslides of different types, relative age, and sizes, including some kilometer-scale relict landslides were mapped through the visual interpretation of 1:33,000-scale stereoscopic aerial photographs, and dedicated field surveys. Analysis of the inventory map revealed that recent landslides consist chiefly of reactivations of older landslides, and of the new landslides formed in pre-existing landslide deposits, triggered primarily by intense rainfall events, or prolonged rainfall periods. We expect that the inventory will be used for the evaluation of landslide susceptibility and hazard in the area, and to investigate the long-term geomorphological evolution of a portion of the southern Apennines.
1. Introduction
Landslide inventory maps document the extent and types of mass movements in an area (CitationGuzzetti et al., 2012). Prepared at a range of scales, landslide inventory maps can cover areas ranging from a single slope to a large region (e.g., CitationCardinali, Antonini, Reichenbach, & Guzzetti, 2001), and examples exist of inventories compiled for an entire state (CitationCardinali, Guzzetti, & Brabb, 1990), nation (e.g., CitationTrigila, Iadanza, & Spizzichino, 2010), or continent (CitationVan Den Eeckhaut & Hervás, 2012). Inventory maps can be prepared using traditional methods and new techniques (CitationGuzzetti et al., 2012). Traditional methods include field survey and the visual interpretation of stereoscopic aerial photographs (see e.g., CitationBrunsden, 1993; CitationBrardinoni, Slaymaker, & Hassan, 2003), and the collection of historical information on landslides and their consequences (e.g., CitationSchuster, 1996). New techniques include the visual, semi-automatic, or automatic analysis of LiDAR-derived and optical satellite images (see e.g., CitationMondini et al., 2011; CitationVan Den Eeckhaut, Kerle, Poesen, & Hervás, 2012; CitationRazak, Santangelo, Van Westen, Straatsma, & de Jong, 2013). Other innovative techniques and data used for landslide mapping, include the use of synthetic aperture radar (SAR) data to map large landslides (CitationCzuchlewsky, Weissel, & Kim, 2003; CitationSinghroy, Mattar, & Gray, 1998), and as ancillary data to help geomorphologists characterize and monitor landslides (CitationFarina, Colombo, Fumagalli, Marks, & Moretti, 2006; CitationSinghroy & Molch, 2004). Landslide maps are important (i) to document the effect of a single landslide triggering event (i.e., landslide event inventory, CitationBucknam, et al., 2001; CitationChigira, Wu, Inokuchi, & Wang, 2010; CitationGorum et al., 2011; CitationHarp & Jibson, 1995 among others), (ii) to collect information for the definition of landslide susceptibility, hazard, vulnerability, and risk (e.g., CitationBălteanu, Chendeşb, Simaa, & Enciua, 2010, Citationvan Westen, van Asch, & Soeters, 2006), (iii) to investigate morphogenetic processes in landscapes dominated by slope wasting phenomena (e.g., CitationHovius, Stark, & Allen, 1997), (iv) to determine landslide statistics (e.g., CitationMalamud, Turcotte, Guzzetti, & Reichenbach, 2004), and (v) for erosion and ecological studies (e.g., CitationFiorucci et al., 2011).
In Italy, despite the presence of a comprehensive national landslide inventory, at 1:25,000 scale (CitationTrigila et al., 2010), the need exists for accurate, large-scale (1:10,000 scale, or larger) landslide inventory maps. In this paper, we present a geomorphological landslide inventory map (Main Map) for an area in the upper Sinni River valley, southern Italy, where landslides of different types and sizes are abundant.
2. Geological setting
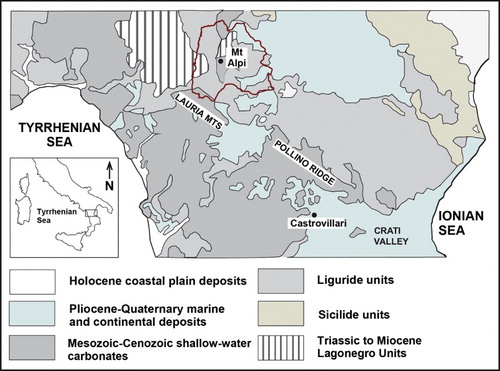
The study area extends for 120 km2 in the northern sector of the Calabria-Lucania border, to the N of Mt. Pollino and the Monti di Lauria ridges (). The Sinni River drains the area, where elevation ranges from 502 to 1873 m, and landscape is characterized by medium-to-high relief. In the area, the Liguridi and Sicilidi sedimentary units (CitationBonardi et al., 1988) crop out along a narrow belt parallel to the main Apennines range (CitationISPRA, 2011). The Mt. Alpi ridge, composed of shallow-water Mesozoic sediments of the Apulia platform, dominates the northern part of the area. In the study area, the Liguridi units, consisting of Jurassic to Oligocene sediments, and of Miocene siliciclastic units partially affected by low-grade metamorphism (CitationInvernizzi et al., 2008), represent the uppermost part of the southern Apennines fold-and-thrust belt. Rocks pertaining to the metamorphic basement crop out locally. In the Miocene, the sediments in the study area were piled in an accretionary wedge emplaced by the subduction of the Ligurian oceanic lithosphere under the Apulian continental margin (CitationGioia and Schiattarella, 2006; CitationSchiattarella, 1998). In the Quaternary, the fold-and-thrust belt was cut by left-lateral, strike-slip and extensional faults (CitationSchiattarella, 1998). As a result, the Mt. Alpi ridge and the surrounding areas were affected by intense exhumation and high uplift rates (CitationCapolongo, Dall'arche, & Pennetta, 2008; CitationCorrado, Invernizzi, & Mazzoli, 2002; CitationDi Leo, Schiattarella, Cuadros, & Cullers, 2005; CitationGioia and Schiattarella, 2006). Regional uplift and recent fault activity are responsible for rapid incision of the drainage network, and for abundant slope wasting processes, including several landslides (CitationSantangelo, Gioia, Cardinali, Guzzetti, & Schiattarella, 2013).
Figure 1. Location and geologic overview of the southern Apennines (modified from CitationGioia & Schiattarella, 2006). Red line shows the border of the study area.
3. Method
We prepared the geomorphological landslide inventory map (CitationGuzzetti et al., 2012) through the systematic, visual interpretation of a single set of black-and-white stereoscopic aerial photographs acquired in 1991, at a nominal scale of 1:33,000, aided by field surveys conducted in March 2009 to check the results of the photo-interpretation. Interpretation of the aerial photographs was performed first by a single interpreter [MS] using (i) a Galileo SFG 2/D stereoscope, with 1× and 6× zoom capabilities, and (ii) an improved Galileo Siscam Falcon ZII stereoscope, with a 1.5× to 13.5× continuous zoom, for more detailed analyses. A second interpreter [MC] reviewed the preliminary landslide mapping using a Galileo SFG 3/B stereoscope, with 1.25× and 4× zoom capability.
To prepare the inventory, a legend for the landslide map was developed based upon the scale of the aerial photographs, the extent of the study area, and the purpose of the investigation. The legend classifies the landslides based on the type and relative age of the landslides. Adopting a simplified version of the classification of the landslide types proposed by CitationCruden and Varnes (1996), landslides were classified as: (i) slide, (ii) complex/composite, (iii) earth flow, (iv) rock fall and topple, and (v) debris flow (Main Map). Two classes of estimated landslide relative age were considered, including: (i) old (i.e., dormant young and dormant mature (CitationKeaton and DeGraff, 1996)), and (ii) very old (i.e., relict, or dormant old (CitationKeaton & DeGraff, 1996)) landslides. Landslide relative age was estimated heuristically, considering the appearance of the landslides on the aerial photographs (e.g., the presence or absence of a vegetation cover, of fluvial activity and erosion processes, including other landslides), and examining the morphological and geometric relationships of the landslide, or portions of the landslides, with other landslides and other geomorphological features. Very old landslides are large to very large, and are characterized by dismantled or partially eroded landforms. The landslide deposit is affected locally by reactivations, and small catchments may have developed in the crown area. Old landslides are smaller in size, better preserved, and less dismantled than the very old failures. Younger reactivations can be present in the deposit of old landslides.
The first interpreter [MS] performed field checks driving and walking along main and secondary roads and trails to (i) validate the information collected during the aerial photo interpretation (API), and (ii) prepare a landslide event inventory map of slope failures triggered by intense rainfall and prolonged rainfall periods between November 2008 and March 2009 (2009 event inventory, ). For the first purpose, the interpreter used a printed copy of the 1:10,000-scale topographic base map with the landslide information drawn on it during the API. Field checks were conducted on all the locations where the API provided ambiguous information on landslide boundary position, or on landslide classification and relative age. For the preparation of the landslide event inventory map, the interpreter collected information for the full extent of the study area, using the same 10,000-scale printed base map. The event inventory map reports information on all the slope failures showing morphological features of event landslides, such as disrupted vegetation, sharp escarpment edges, undrained depressions and hummocky topography.
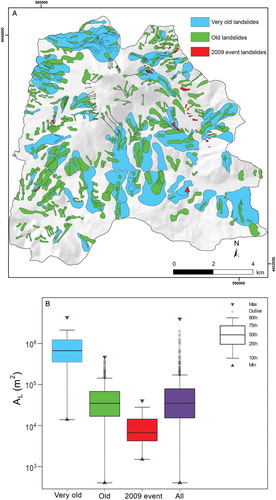
Figure 2. (A) Sketch of the landslide inventory map. Landslides are classified according to their relative age. (B) Box plot comparison for landslide areas within the ‘Very old’, ‘Old’, and ‘2009 landslide event’ classes. Color coding of the box plots is the same as the sketch map in (A). Box plot of the entire inventory is shown for reference.
During the preliminary mapping and review process, the interpreters drew the landslide and ancillary geomorphological information on transparent overlays on the aerial photographs. Successively, the landslide information was transferred visually from the aerial photographs to a digital version on a 1:10,000-scale topographic base map. Finally, a geographical database was compiled in a geographic information system (GIS) to store and organize the landslide information. Single landslides are classified based on the landslide type, and three separate layers are used to separate landslides of different relative age.
4. Results
The landslide inventory map shows 531 landslides, with an average density of 4.4 landslides per square kilometer. The inventory shows 317 complex/compound failures, 115 earthflows, 54 slides, 40 debris flows, and 5 rock falls (). The mapped landslides range in size from A L = 4.0 × 10² m2 to A L = 4.0 × 10⁶ m2, for a total landslide area A LT = 4.43 × 10⁷ m2, 37.4% of the study area. The figure is significantly larger than the proportion of landslides in other areas in the Apennines (e.g., CitationGuzzetti et al., 2008), and demonstrates the importance of landslides as a mass-wasting process in the study area.
Table 1. Descriptive statistics for landslides mapped on inventory map prepared for the upper Sinni River valley.
Visual inspection of the landslide map reveals high spatial persistence of slope failures of different generations inside pre-existing (older) landslides. Local relief and geological setting control the type and spatial distribution of the landslides. Debris flows cluster at the toe of the western slope of Mt. Alpi, where relative relief is greatest. Complex/composite failures are most abundant where clay-rich layers are associated with hard metamorphic and sedimentary rocks. Slides and earthflows have formed primarily where stiff clay and marls crop out. Large, very old deep-seated landslides are controlled by the spatial arrangement of stratigraphic and tectonic discontinuities; a typical condition for the development of deep-seated landslides in the Apennines (CitationGuzzetti, Cardinali, & Reichenbach, 1996, CitationGuzzetti et al., 2008, Citation2012; CitationConforti, Robustelli, Muto, & Critelli, 2011).
summarizes information on the estimated relative age of the mapped landslides. Inspection of the box-plot reveals that the median (50th percentile) of the area of the very-old landslides is larger than the maximum area of the old landslides. We interpret this result as an evidence for the incompleteness of the old landslides, some of which have been removed by erosion, other landslides, and human activity. shows the distribution of terrain slope and elevation inside and outside the mapped landslides in the study area. Landslides form primarily where terrain slope is in the range between 10° and 28°, with about 50% of the terrain in this slope range affected by landslides ((a)). Landslides are most abundant between 800 and 1000 m of elevation, and cover about 50% of the area with elevation in the range from 600 to 1000 m ((b)), where soft rocks (clays pertaining to the Liguridi Units, and marls and clays pertaining to the Lagonegro Units) crop out. Landslides are less abundant at elevations higher than 1,000 m, where hard rocks (Mesozoic limestones, and rocks pertaining to the metamorphic basement) crop out. In this elevation range, the most widespread landslides are of the rock fall and debris flow type.
Figure 3. Histograms showing the percentage of area covered by landslide-free area (black bars) and landslides (gray bars) within each slope (A) and elevation (B) class.
Whilst visual interpretation of stereoscopic aerial photographs and geomorphological field mapping are traditional methods for detecting and mapping landslides (CitationBrunsden, 1993; CitationGuzzetti et al., 2012), they are not error free. Therefore, landslide inventories produced by both of these methods have limitations that must be considered when consulting such maps (CitationGalli, Ardizzone, Cardinali, Guzzetti, & Reichenbach, 2008; CitationGuzzetti et al., 2012; CitationSantangelo, Cardinali, Rossi, Mondini, & Guzzetti, 2010). Visual interpretation of stereoscopic aerial photographs can result in mapping errors due e.g., to the complexity of the terrain and the landslides in the study area, to the ability and the experience of the interpreters, and to the tools and techniques used to transfer landslide information from the aerial photographs to the topographic base maps, and to store the information in a digital format (CitationGuzzetti et al., 2012). Mapping errors are produced by the different scales of the aerial photographs and the base map, the distortion of a landslide in the stereoscopic model, caused by the vertical exaggeration and the conical projection of the aerial photographs, and by differences in the topography shown in the aerial photographs and the base maps (CitationArdizzone, Cardinali, Galli, Guzzetti, & Reichenbach, 2007, CitationSantangelo et al., 2014).
Field mapping of event landslides (i.e., landslides triggered by a single triggering event) is also problematic. Errors are caused primarily by the fact that the landslides are identified and mapped visually using base maps that pre-date the event landslides, and may not show sufficient morphological information to place the landslides accurately (CitationSantangelo et al., 2010).
Despite possible mapping errors, which are inherent to any landslide inventory map (CitationGuzzetti et al., 2012; CitationSantangelo et al., 2010, Citation2013), we maintain that our inventory was prepared adopting a rigorous legend, contributing to reducing potential inconsistencies in the interpretation of the aerial photographs and the classification of the mapped landslides. Further, two interpreters performed the mapping of most of the landslides. This contributed to reducing the subjectivity inherent in landslide mapping (CitationGuzzetti et al., 2012).
Finally, we stress that the landslide inventory map was produced interpreting 1:33,000-scale stereoscopic aerial photographs and transferring the landslide information to 1:10,000-scale topographic base maps. The landslide inventory map should be viewed and used at 1:10,000 scale, or at a smaller scale. Use of the landslide information shown in the inventory map for studies and applications that require greater cartographic detail or accuracy is not recommended.
5. Conclusions
In this paper, we present a geomorphological landslide inventory map for an area of 120 km2 in the upper Sinni River valley, southern Apennines, Italy. We produced the landslide inventory map through the visual interpretation of 1:33,000-scale stereoscopic aerial photographs, aided by field surveys performed to check the interpretation of the aerial photographs. The landslide map shows 531 landslides of different types, for a total landslide area A LT = 4.43 × 10⁷ m2, 37.4% of the study area. About 30% of all the mapped landslides were located inside or in the vicinity of pre-existing (i.e., older) slope failures, confirming that the spatial distribution of the recent landslides is influenced by the presence of older landslides. In the study area, the landslide types, distribution, and pattern are controlled by the local lithological and structural settings. We expect that the new landslide inventory map will be used for the evaluation of landslide susceptibility and hazard in the study area, and for quantitative geomorphological analyses aimed at understanding the long-term geomorphological evolution of a portion of the southern Apennines.
Software
Esri ArcGIS 9.2 was used to digitize the landslide information collected during the field surveys and to perform the spatial analyses.
Main Map: Landslide Inventory Map for the Upper Sinni River Valley, Southern Italy
Download PDF (16.8 MB)Notes
† The research was conducted here
Related Research Data
References
- Ardizzone, F., Cardinali, M., Galli, M., Guzzetti, F., & Reichenbach, P. (2007). Identification and mapping of recent rainfall-induced landslides using elevation data collected by airborne LiDAR. Natural Hazards and Earth System Sciences, 7(6), 637–650. doi: 10.5194/nhess-7-637-2007
- Bălteanu, A., Chendeşb, V., Simaa, M., & Enciua, P. (2010). A country-wide spatial assessment of landslide susceptibility in Romania. Geomorphology, 124(3–4), 102–112. doi: 10.1016/j.geomorph.2010.03.005
- Bonardi, G., Amore, F. O., Ciampo, G., De Capoa, P., Miconnet, P., & Perrone, V. (1988). Il Complesso Liguride Auct.: stato delle conoscenze e problemi aperti sulla sua evoluzione pre-appenninica ed i suoi rapporti con l'Arco Calabro. Memorie Società Geologica Italiana, 41, 17–35.
- Brardinoni, F., Slaymaker, O., & Hassan, M. A. (2003). Landslide inventory in a rugged forested watershed: A comparison between air-photo and field survey data. Geomorphology, 54(3–4), 179–196. doi: 10.1016/S0169-555X(02)00355-0
- Brunsden, D. (1993). Mass movements; the research frontier and beyond: A geomorphological approach. Geomorphology, 7, 85–128. doi: 10.1016/0169-555X(93)90013-R
- Bucknam, R. C., Coe, J. A., Chavarria, M. M., Godt, J. W., Tarr, A. C., Bradley, L.-A., Rafferty, S., Hancock, D., Dart, R. L., & Johnson, M. L. (2001). Landslides Triggered by Hurricane Mitch in Guatemala — Inventory and Discussion. U.S. Geological Survey Open File Report 01-443.
- Capolongo, D., Dall'arche, F., & Pennetta, L. (2008). Le superfici relitte quale elemento per la stima dei volumi erosi e delle velocità di sollevamento nell'alta valle del fiume Sinni. In Boenzi, F., Capolongo, D., Giano, S. I., Schiattarella, M. (Eds.), Studi di base sull'interazione tra clima, tettonica e morfoevoluzione in Italia meridionale durante il Quaternario, Villa d'Agri (Potenza, Italy): Dibuono edizioni, pp. 130–138 (in Italian).
- Cardinali, M., Antonini, G., Reichenbach, P., & Guzzetti, F. (2001). Photo geological and landslide inventory map for the Upper Tiber River basin. CNR, Gruppo Nazionale per la Difesa dalle Catastrofi Idrogeologiche, Publication n. 2116, scale 1:100,000.
- Cardinali, M., Guzzetti, F., & Brabb, E. E. (1990). Preliminary map showing landslide deposits and related features in New Mexico. U.S. Geological Survey Open File Report 90/293, 4 sheets, scale 1:500,000.
- Chigira, M., Wu, X., Inokuchi, T., & Wang, G. (2010). Landslides induced by the 2008 Wenchuan earthquake, Sichuan, China. Geomorphology, 118(3–4), 225–238. doi: 10.1016/j.geomorph.2010.01.003
- Conforti, M., Robustelli, G., Muto, F., & Critelli, S. (2011). Application and validation of bivariate GIS-based landslide susceptibility assessment for the Vitravo River catchment (Calabria, south Italy), Natural Hazards.
- Corrado, S., Invernizzi, C., & Mazzoli, S. (2002). Tectonic burial and exhumation in a foreland fold and thrust belt: The Monte Alpi case history (Southern Apennines, Italy). Geodinamica Acta, 15, 159–177. doi: 10.1080/09853111.2002.10510750
- Cruden, D. M., & Varnes, D. J. (1996). Landslide types and processes. In A. K. Turner, & R. L. Schuster (Eds.), Landslides, Investigation and Mitigation. Transportation Research Board Special Report 247, Washington D.C., pp. 36–75.
- Czuchlewsky, K. R., Weissel, J. K., & Kim, Y. (2003). Polarimetric synthetic aperture radar study of the Tsaoling landslide generated by the 1999 Chi-Chi earthquake, Taiwan. Journal of Geophysical Research, 108(F1), 7.1–7.11.
- Di Leo, P., Schiattarella, M., Cuadros, J., & Cullers, R. (2005). Clay mineralogy, geochemistry and structural setting of the ophiolite-bearing units from southern Italy: A multisisciplinary approach to assess tectonic history and exhumation modalities. Atti Ticinensi di Scienze della Terra, S.S. 10, 87–93.
- Farina, P., Colombo, D., Fumagalli, A., Marks, F., & Moretti, S. (2006). Permanent scatters for landslide investigations: Outcomes from the ESA-SLAM project. Engineering Geology, 88, 200–217. doi: 10.1016/j.enggeo.2006.09.007
- Fiorucci, F., Cardinali, M., Carlà, R., Rossi, M., Mondini, A. C., Santurri, L., Ardizzone, F., & Guzzetti, F. (2011). Seasonal landslides mapping and estimation of landslide mobilization rates using aerial and satellite images. Geomorphology, 129(1–2), 59–70. doi:10.1016/j.geomorph.2011.01.013
- Galli, M., Ardizzone, F., Cardinali, M., Guzzetti, F., & Reichenbach, P. (2008). Comparing landslide inventory maps. Geomorphology, 94, 268–289. doi:10.1016/j.geomorph.2006.09.023
- Gioia, D., & Schiattarella, M. (2006). Caratteri morfotettonici dell’area del Valico di Prestieri e dei Monti di Lauria (Appennino meridionale). Il Quaternario, 19, 129–142 (in Italian).
- Gorum, T., Fan, X., van Westen, C. J., Huang, R. Q., Xu, Q., Tang, C., & Wang, G. (2011). Distribution pattern of earthquake-induced landslides triggered by the 12 May 2008 Wenchuan earthquake. Geomorphology. doi:10.1016/j.geomorph.2010.12.030
- Guzzetti, F., Ardizzone, F., Cardinali, M., Galli, M., Reichenbach, P., & Rossi, M. (2008). Distribution of landslides in the Upper Tiber River basin, central Italy. Geomorphology, 96, 105–122. doi: 10.1016/j.geomorph.2007.07.015
- Guzzetti, F., Cardinali, M., & Reichenbach, P. (1996). The influence of structural setting and lithology on landslide type and pattern. Environmental and Engineering Geoscience, 2(4), 531–555. doi: 10.2113/gseegeosci.II.4.531
- Guzzetti, F., Mondini, A. C., Cardinali, M., Fiorucci, F., Santangelo, M., & Chang, K. T. (2012). Landslide inventory maps: New tools for an old problem. Earth-Science Reviews, 112, 42–66. doi: 10.1016/j.earscirev.2012.02.001
- Harp, E. L., & Jibson, R. L. (1995). Inventory of landslides triggered by the 1994 Northridge, California earthquake. U.S. Geological Survey Open File Report, pp. 95–213.
- Hovius, N., Stark, C. P., & Allen, P. A. (1997). Sediment flux from a mountain belt derived by landslide mapping. Geology, 25, 231–234. doi: 10.1130/0091-7613(1997)025<0231:SFFAMB>2.3.CO;2
- Invernizzi, C., Bigazzi, G., Corrado, S., Di Leo, P., Schiattarella, M., & Zattin, M. (2008). New thermobaric constraints on the exhumation history of the liguride accretionary wedge, Southern Italy. Ofioliti, 33, 21–32.
- ISPRA. (2011). Foglio 522 Senise della Carta Geologica d'Italia in scala 1:50.000 (in Italian).
- Keaton, J. R., & DeGraff, J. V. (1996). Surface observation and geologic mapping. In A. K. Turner, & R. L. Schuster, (Eds.), Landslides, Investigation and Mitigation. Transportation Research Board Special Report 247, Washington D.C., 178–230.
- Malamud, B. D., Turcotte, D. L., Guzzetti, F., & Reichenbach, P. (2004). Landslide inventories and their statistical properties. Earth Surface Processes and Landforms, 29(6), 687–711. doi: 10.1002/esp.1064
- Mondini, A. C., Guzzetti, F., Reichenbach, P., Rossi, M., Cardinali, M., & Ardizzone, F. (2011). Semi-automatic recognition and mapping of rainfall induced shallow landslides using satellite optical images. Remote Sensing of Environment, 115, 1743–1757. doi:10.1016/j.rse.2011.03.006
- Razak, K. A., Santangelo, M., Van Westen, C. J., Straatsma, M. W., & de Jong, S. M. (2013). Generating an optimal DTM from airborne laser scanning data for landslide mapping in a tropical forest environment. Geomorphology, 190, 112–125. doi: 10.1016/j.geomorph.2013.02.021
- Santangelo, M., Cardinali, M., Rossi, M., Mondini, A. C., & Guzzetti, F. (2010). Remote landslide mapping using a laser rangefinder binocular and GPS. Natural Hazards and Earth System Sciences, 10, 2539–2546. doi:10.5194/nhess-10-2539-2010
- Santangelo, M., Gioia, D., Cardinali, M., Guzzetti, F., & Schiattarella, M. (2013). Interplay between mass movement and fluvial network organization: An example from southern Apennines. Italy Geomorphology, 188, 54–67. doi: 10.1016/j.geomorph.2012.12.008
- Santangelo, M., Marchesini, I., Cardinali, Fiorucci, F. M., Rossi, M., Bucci, F., & Guzzetti, F. (2014). A method for the assessment of the influence of bedding on landslide abundance and types. Landslides. doi:http://dx.doi.org/10.1007/s10346–014–0485-x
- Schiattarella, M. (1998). Quaternary tectonics of the Pollino Ridge, Calabria-Lucania boundary, southern Italy. In Holdsworth, R. E., Strachan, R. A., & Dewey, J. F. (Eds.), Continental transpressional and transtensional Tectonics (pp. 341–354). London: Geological Society.
- Schuster, R. L. (1996). Socioeconomic significance of landslides. In A. K. Turner, & R. L. Schuster (Eds.), Landslides, Investigation and Mitigation. Transportation Research Board Special Report 247, Washington D.C., 12–35.
- Singhroy, V., Mattar, K. E., & Gray, A. L. (1998). Landslide characterisation in Canada using interferometric SAR and combined SAR and TM images. Advances in Space Research, 21, 465–476. doi: 10.1016/S0273-1177(97)00882-X
- Singhroy, V., & Molch, K. (2004). Characterizing and monitoring rockslides from SAR techniques. Advances in Space Research, 33(3), 290–295. doi: 10.1016/S0273-1177(03)00470-8
- Trigila, A., Iadanza, C., & Spizzichino, D. (2010). Quality assessment of the Italian Landslide Inventory using GIS processing. Landslides, 7(4), 455–470. doi:10.1007/s10346-010-0213-0, 2010
- Van Den Eeckhaut, M., & Hervás, J. (2012). State of the art of national landslide databases in Europe and their potential for assessing landslide susceptibility, hazard and risk. Geomorphology, 139–140, 545–558. doi:10.1016/j.geomorph.2011.12.006.
- Van Den Eeckhaut, M., Kerle, N., Poesen, J., & Hervás, J. (2012). Identification of vegetated landslides using only a Lidar-based terrain model and derivatives in an object-oriented environment. Proceedings of the 4th GEOBIA, May 7–9, 2012 - Rio de Janeiro - Brazil. p.211.
- van Westen, C. J., van Asch, Th. W. J., & Soeters, R. (2006). Landslide hazard and risk zonation: Why is it still so difficult?. Bulletin of Engineering Geology and the Environment IAEG, 65 (2006) 2, 167–184. doi: 10.1007/s10064-005-0023-0