
Abstract
Neighborhood physical disorder, or the deterioration of urban environments, is associated with negative mental and physical health outcomes. Eleven trained raters used CANVAS, a web-based system for conducting reliable virtual street audits, to collect data on nine indicators of physical disorder using Google Street View imagery of 532 block faces in New York City, New York, USA. We combined the block face indicator data into a disorder scale using item response theory; indicators ranged in severity from presence of litter, a weak indicator of disorder, to abandoned cars, a strong indicator. Using this scale, we estimated disorder at the center point of each sampled block. We then used ordinary kriging to interpolate estimates of disorder levels throughout the city. The resulting map condenses a complex estimation process into an interpretable visualization of the spatial distribution of physical disorder in New York City.
1. Introduction
Research suggests that higher levels of neighborhood disorder are associated with riskier health behaviors, such as binge drinking (CitationKeyes et al., 2012; CitationReboussin, Preisser, Song, & Wolfson, 2010), and poorer health outcomes, such as increased prevalence of sexually transmitted infections (CitationCohen et al., 2000) and obesity (CitationBurdette & Hill, 2008; CitationFranzini et al., 2009; CitationLovasi et al., 2012). Living amidst chaotic environments may pose a stressful experience, triggering unhealthy behaviors as a coping mechanism, with consequent poor health outcomes (CitationLatkin, Curry, Hua, & Davey, 2007). For the public health community to measure the relationship between physical disorder and health and to intervene where appropriate to improve health, the community needs access to spatially located estimates of physical disorder.
Disorder is also of considerable interest within the sociology and criminology literature (CitationMcGarrell, Giacomazzi, & Thurman, 1997; CitationRoss & Jang, 2000; CitationSampson & Raudenbush, 1999; CitationSkogan, 1986), as a potential influence on trust between neighbors, fear, and crime. This line of inquiry also relies on estimates of physical disorder to promote public health and sociology research on the health consequences of neighborhood physical disorder, we developed a map displaying neighborhood physical disorder within New York City.
2. Data collection
Neighborhood physical disorder is often assessed using street audits conducted by trained observers using validated tools. Audits have historically been conducted by visiting neighborhoods in person (CitationFranzini, Caughy, Spears, & Esquer, 2005; CitationReiss, 1971), but the recent development of the Computer Aided Neighborhood Visual Assessment System (CANVAS), has enabled efficient and reliable virtual street audits (CitationBader et al., in press). We used CANVAS with Google Street View imagery to assess the presence of indicators of physical disorder on selected block faces in New York City.
Using a structured sampling plan, we initially identified 541 geographic points within the city near which to search for block faces to audit. These points were selected from an overlaid lattice with three levels of sample point density. First, to ensure block faces audited represented New York City as a whole, we selected points at 2-km intervals across the city. Second, to increase precision in more densely populated areas, we embedded an oversample of points at 1-km intervals in areas where the population density was in the highest quartile of population density in the metro area. Because New York City's metro area is large and most of the city itself is densely populated, this oversample ultimately covered much of the city, though not Staten Island, the lowest-density borough. Third, because these data were originally gathered in part to assess the effects of neighborhood disorder on health outcomes in the Fragile Families and Childhood Well Being Study, a birth cohort study described in more detail elsewhere (CitationReichman, Teitler, Garfinkel, & McLanahan, 2001), we embedded an oversample of points at 0.5-km intervals in neighborhoods in which study subjects were concentrated.
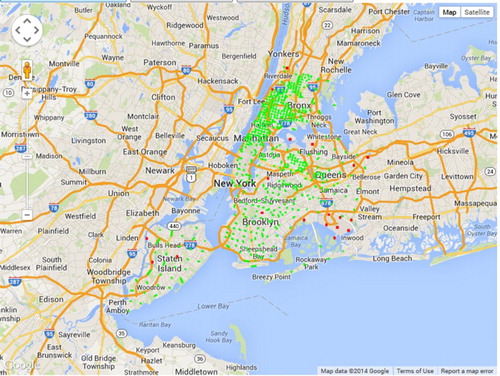
Ultimately, our sampling procedure resulted in 541 sample points within New York City. For each sample point, CANVAS selected one block face (that is, one side of the street) at the point or up to 125 meters away, following a protocol described in more detail elsewhere (CitationMooney et al., 2014). Because some locations within the city limits, such as large parks and industrial areas do not have streets, Google Street View imagery was not available at all sampled point. From the sampling plan, we identified 532 block faces (98.3% of sample points) with imagery for virtual street audit ( is a screen capture from a test run of CANVAS's sampler that identified slightly fewer block faces but is roughly comparable to the final sampling plan). Visual inspection of the sampling map revealed that the nine locations where no Google Street View imagery could be found were in non-residential areas, including industrial areas or airports. Street auditing began in July 2012 and was completed in March 2013. Imagery capture dates for the block faces sampled ranged from August 2007 to October 2011; elapsed time between image capture and virtual audit ranged from 10 months to 5 and a half years, with a median of 15 months.
Figure 1. Screen capture of map generated by CANVAS to display block faces selected (green) and locations where no block face could be found (red). The cluster of red dots in the lower right just above the word Inwood is JFK airport.
The five trained auditors completed as few as 20 and as many as 187 block face audits within New York City. The training procedure consisted of a two-and-a-half-hour workshop describing the audit items, followed by audits of 31 block faces selected from a national sample and validated by the study manager (S.J.M.). This training procedure was also used with a previous study conducted using CANVAS (CitationBader et al., in press). Forty-two block faces (7.8%) were randomly selected for an inter-rater reliability subsample, which resulted in kappa scores ranging from 0.34 (for empty alcohol bottles) to 0.80 (for abandoned buildings). Details on inter-rater reliability have been reported elsewhere (CitationMooney et al., 2014). The final audit protocol is described in , and training materials for our final audit protocol are available upon request, including details on distinguishing housing conditions and identifying grafitti.
Table 1. Items used to assess physical disorder.
3. Neighborhood physical disorder
To assess neighborhood disorder indicators, we developed nine items from previously validated audit inventories. From the Project on Human Development in Chicago Neighborhoods (PHDCN), we selected items to assess presence of (1) litter, (2) empty alcohol bottles, (3) graffiti, (4) burned out buildings, (5) abandoned buildings, (6) abandoned cars, and (7) poor-building maintenance (CitationRaudenbush & Sampson, 1999). From the Pedestrian Environment Data Scan (PEDS) (CitationClifton, Smith, & Rodriguez, 2007) tool, we added an item to assess presence of vacant lots, and from the Irvine-Minnesota Inventory (IMI) (CitationDay et al., 2006), we added an item to assess presence of bars on windows. One item, presence of burned-out buildings, was not present on any block face in New York City and so did not contribute to the measure of disorder. To develop the estimates of disorder mapped here, items on the inter-rater reliability subsample blocks were coded to reflect the judgment of the majority of auditors, if there was a majority selection; when auditors were evenly split, a value was chosen at random among the selected ratings (2.9% of item/block face pairs).
We used an item response theory (IRT) model to assess the severity and discrimination of disorder indicators and estimate a latent level of disorder for each audited block face. We constructed our model such that the log odds of observing the response that indicates physical disorder for item i on block face j was modeled as a function of latent level θj of physical disorder:
When this model is fit for all observed Yij values, αi estimates discrimination for item i (i.e. how well item i separates high-disorder blocks from low-disorder blocks), βi estimates severity for item i (i.e. how much disorder is indicated by the presence of item), and θj estimates the latent level of physical disorder on block face j. Fitting the model and computing θj from the posterior probability distribution therefore creates a scale in which θj acts as the estimated disorder level at each audited block face. Construction and validation of the IRT model are described in more detail elsewhere (CitationMooney et al., 2014).
4. Kriging
Next, we applied kriging methods to extend physical disorder estimates throughout the city using information from the audited block faces. Within geostatistics, kriging generally denotes optimal spatial prediction (CitationCressie, 1990). Several different applications of kriging exist, including (a) simple kriging based on variation around a known spatial mean, (b) ordinary kriging based on a constant but unknown mean and constant variation, and (c) universal kriging, which is appropriate for data with strong directional trends (anisotropic processes) or other spatial characteristics that affect outcomes (CitationBivand, Pebesma, & Gómez-Rubio, 2008). We chose ordinary kriging to maximally leverage our spatial covariance without incorporating assumptions about an underlying trend or a global mean level of disorder.
Following the procedure described by CitationBader and Ailshire (2014), we first derived a plot measuring the degree to which observations covary as a function of separation distance (i.e. a semivariogram) for distances ranging from 1 km to 100 km. We then visually fit an exponential curve with three parameters to the points in the semivariogram as follows:
The resulting exponential function parametrically relates the variation in disorder, γ(h), to the separation distance, h, between two points. This function can be used in conjunction with observed disorder levels to estimate disorder at any point in the city. Because the observations with the smallest separation distance carry the most weight in the kriging process, our judgment of visual fits emphasized a good fit at the distances under 2 km ().
Figure 2. Variation in the physical disorder measure as related to distance between points (i.e. a semivariogram) and the exponential function visually fit to it.
After estimating kriging parameters, we used a jackknife resampling cross-validation strategy wherein we kriged an estimate for each sampled point using all other points and compared the difference. This resulted in a roughly normal residual distribution and a median absolute deviation of 0.40 standard normal units. More details on cross-validation are available elsewhere (CitationMooney et al., 2014).
5. Map development
To create our map, we kriged estimated levels of disorder on a raster surface using 100 square meter pixels across the city, ignoring boundaries such as rivers or highways in the kriging process. We intersected the disorder raster surface with land area in New York City to create the disorder map. The final cartographic product focuses attention on neighborhood physical disorder, or the deterioration of the New York City urban landscape.
In addition to the kriged physical disorder surface, a minimum number of map layers were included to orient the map reader without distracting from the main focus of the map. Political boundaries were limited to state and borough lines, while the only other map layer shown is unassessed/unaudited areas, which included parks ≥ 450 acres in size, airports, and a landfill site. In developing the map, we tested several color schemes for a balance of aesthetic appeal and legibility. We initially tested a single-color gradient but rejected it as providing insufficient visual contrast. The hue and lightness of the final color scheme was designed to emphasize areas of variation between high and low disorder.
The visual map legend was added to demonstrate the nine indicators that were assessed, scaled and interpolated to estimate physical disorder levels throughout the city. Each indicator image was selected by hand to clearly demonstrate the item in question. The visual map legend is comprised of screen captures of actual audited block faces, taken from Google Street View imagery dating from August 2007 to October 2011.
6. Conclusions
Our work resulted in a map of New York City that visually depicts the spatial distribution of neighborhood physical disorder across the five boroughs (see Supplementary Content for Main Map). The map reveals both concentrated pockets of disorder (e.g. the East Elmhurst neighborhood just above the word Queens on the map) and wide swaths of disorder (e.g. most of the Bronx, the northernmost borough of the city).
However, our map has several important limitations. First, because the measure was assessed directly at only a limited number of points and interpolated between those points, the map presents an overly smooth appearance of disorder. This limitation, which can be overcome in kriging analyses using conditional realizations of the kriged surface, is common to interpolated surfaces. Second, because our sample did not include block faces outside the city limits, estimates near the land boundaries of the city may be less accurate than estimates in more central parts of the city.
In conclusion, this map is an accessible depiction of the spatial distribution of neighborhood physical disorder in New York City.
Software
We used R for Windows version 2.15.3 for data analysis (CitationR Development Core Team, 2008), including ‘ltm’ package version 0.9–9 to develop the IRT model (CitationRizopoulos, 2006) and ‘geoR’ version 1.7–4 for spatial analysis and kriging (CitationRibeiro & Diggle, 2001). Esri ArcGIS 10.2 (Redlands, CA) was used for both the geo-processing and cartographic aspects of this project.
Neighborhood Physical Disorder in New York City
Download PDF (9.8 MB)Acknowledgments
The authors would also like to thank the virtual street auditors: Dominic Abordo, Jonathon Costa, Payal Desai, Emerald Gearing, and Erin Huie.
Funding
Funding for this project was provided by Award Number R21HD062965 from the Eunice Kennedy Shriver National Institute of Child Health and Human Development, by National Institute for Child Health and Human Development Grant R24HD058486, awarded to the Columbia Population Research Center, by T32-CA09529 from the National Cancer Institute, and by K01HD067390 from the Eunice Kennedy Shriver National Institute of Child Health and Human Development. The authors would also like to acknowledge the support of the Robert Wood Johnson Health & Society Scholars Program at the University of Pennsylvania.
This work was supported by the Eunice Kennedy Shriver National Institute of Child Health and Human Development under Grants R21HD062965, K01HD067390 and Development Grant R24HD058486, awarded to the Columbia Population Research Center; and the National Cancer Institute under Grant T32-CA09529. The authors would also like to acknowledge the support of the Robert Wood Johnson Health & Society Scholars Program at the University of Pennsylvania and Columbia University.
References
- Bader, M. D. M., & Ailshire, J. A. (2014). Creating measures of theoretically relevant neighborhood attributes at multiple spatial scales. Sociological Methodology, 44(1), 322–368.
- Bader, M. D. M., Mooney, S. J., Lee, Y. J., Sheehan, D., Neckerman, K., Rundle, A. G., & Teitler, J. O. (in press). Development and Deployment of the Computer Assisted Neighborhood Visual Assessment System (CANVAS) to measure health-related neighborhood conditions. Health & Place.
- Bivand, R. S., Pebesma, E. J., & Gómez-Rubio, V. (2008). Applied spatial data analysis with R (Vol. 747248717). New York: Springer.
- Burdette, A. M., & Hill, T. D. (2008). An examination of processes linking perceived neighborhood disorder and obesity. Social Science & Medicine, 67(1), 38–46.
- Clifton, K. J., Smith, A. D. L., & Rodriguez, D. (2007). The development and testing of an audit for the pedestrian environment. Landscape and Urban Planning, 80(1–2), 95–110. doi:10.1016/j.landurbplan.2006.06.008
- Cohen, D., Spear, S., Scribner, R., Kissinger, P., Mason, K., & Wildgen, J. (2000). ‘Broken windows’ and the risk of gonorrhea. Am J Public Health, 90(2), 230–236.
- Cressie, N. (1990). The origins of kriging. Mathematical Geology, 22(3), 239–252.
- Day, K., Boarnet, M., Alfonzo, M., & Forsyth, A. (2006). The Irvine-Minnesota inventory to measure built environments. American Journal of Preventive Medicine, 30(2), 144–152. doi:10.1016/j.amepre.2005.09.017
- Franzini, L., Caughy, M., Spears, W., & Esquer, M. E. F. (2005). Neighborhood economic conditions, social processes, and self-rated health in low-income neighborhoods in Texas: A multilevel latent variables model. Social Science & Medicine, 61(6), 1135–1150.
- Franzini, L., Elliott, M. N., Cuccaro, P., Schuster, M., Gilliland, M. J., Grunbaum, J. A., … Tortolero, S. R. (2009). Influences of physical and social neighborhood environments on children's physical activity and obesity. American Journal of Public Health, 99(2), 271–278. doi:10.2105/AJPH.2007.128702
- Keyes, K. M., McLaughlin, K. A., Koenen, K. C., Goldmann, E., Uddin, M., & Galea, S. (2012). Child maltreatment increases sensitivity to adverse social contexts: Neighborhood physical disorder and incident binge drinking in Detroit. Drug and Alcohol Dependence, 122(1), 77–85.
- Latkin, C. A., Curry, A. D., Hua, W., & Davey, M. A. (2007). Direct and indirect associations of neighborhood disorder with drug use and high-risk sexual partners. American Journal of Preventive Medicine, 32(6), S234–S241.
- Lovasi, G. S., Bader, M. D. M., Quinn, J., Neckerman, K., Weiss, C., & Rundle, A. (2012). Body mass index, safety hazards, and neighborhood attractiveness. American Journal of Preventive Medicine, 43(4), 378–384. doi: http://dx.doi.org/10.1016/j.amepre.2012.06.018
- McGarrell, E. F., Giacomazzi, A. L., & Thurman, Q. C. (1997). Neighborhood disorder, integration, and the fear of crime. Justice Quarterly, 14(3), 479–500.
- Mooney, S. J., Bader, M. D. M., Lovasi, G. S., Neckerman, K. M., Teitler, J. O., & Rundle, A. G. (2014). Validity of an ecometric neighborhood physical disorder measure constructed by virtual street audit. American Journal of Epidemiology, 180(6), 626–635.
- Pikora, T. J., Bull, F. C. L., Jamrozik, K., Knuiman, M., Giles-Corti, B., & Donovan, R. J. (2002). Developing a reliable audit instrument to measure the physical environment for physical activity. American Journal of Preventive Medicine, 23(3), 187–194. doi:Pii S0749-3797(02)00498-1, doi:10.1016/S0749-3797(02)00498-1
- Raudenbush, S. W., & Sampson, R. J. (1999). Ecometrics: Toward a science of assessing ecological settings, with application to the systematic social observation of neighborhoods. Sociological Methodology, 29, 1–41. doi:10.1111/0081–1750.00059
- R Development Core Team. (2008). R: A language and environment for statistical computing. Vienna, Austria: R Foundation for Statistical Computing.
- Reboussin, B. A., Preisser, J. S., Song, E.-Y., & Wolfson, M. (2010). Geographic clustering of underage drinking and the influence of community characteristics. Drug and Alcohol Dependence, 106(1), 38–47.
- Reichman, N. E., Teitler, J. O., Garfinkel, I., & McLanahan, S. S. (2001). Fragile families: Sample and design. Children and Youth Services Review, 23(4–5), 303–326. doi:10.1016/S0190-7409(01)00141-4
- Reiss, A. J. (1971). Systematic observation of natural social phenomena. Sociological Methodology, 3, 3–33.
- Ribeiro Jr, P. J., & Diggle, P. J. (2001). geoR: A package for geostatistical analysis. R news, 1(2), 14–18.
- Rizopoulos, D. (2006). ltm: An R package for latent variable modeling and item response theory analyses. Journal of Statistical Software, 17(5), 1–25.
- Ross, C. E., & Jang, S. J. (2000). Neighborhood disorder, fear, and mistrust: The buffering role of social ties with neighbors. American Journal of Community Psychology, 28(4), 401–420.
- Sampson, R. J., & Raudenbush, S. W. (1999). Systematic social observation of public spaces: A new look at disorder in urban neighborhoods. American Journal of Sociology, 105(3), 603–651. doi:10.1086/210356
- Skogan, W. (1986). Fear of crime and neighborhood change. Crime and Justice, 8, 203–229.