
Abstract
Lazio is a region particularly affected by catastrophic sinkhole collapse. For some areas sinkholes appear to be sporadic, whilst other areas are particularly affected by sinkholes. These events can cause considerable damage when they occur in an urban area or in areas with transport networks. For several years, the Lazio Region has conducted studies on sinkholes in order to define areas prone to this phenomenon. This study involved the use of cartographic sources, historical documentation, as well as field trips, in order to construct an inventory of sinkhole cases in the region, as well as to identify sinkhole prone areas (SPAs). The inventory allowed each sinkhole case to be analysed within the geological and hydrogeological setting, as well as the surrounding vegetation and degree of urbanisation, in which it occurred. Correlations were also performed with tectonic and structural trends, and with triggering factors, such as earthquakes. Some predisposing variables to sinkhole phenomena are then selected. The application of multivariate logistic regression and geospatial analyses allows the selection of the most significant factors, as well as their optimal weights used to construct a sinkhole susceptibility map of the Latium Region at the 1:250,000 scale. The identification of the susceptibility grade of SPAs will help in the management of these areas, based on the risk level.
1. Introduction
Two main genetic groups of sinkholes can be found: solution sinkholes resulting from internal erosion processes caused by subsurface karstification of carbonates or evaporites; and solution-induced subsidence processes that may affect cover deposits over a karst and non-karst bedrock. This second group includes brittle gravitational deformation of the cover material (collapse) caused by an upward migration of the collapse through dissolution conduits (piping sinkholes) (CitationBeck, 2005; CitationGalve et al., 2009; CitationGutiérrez, Cooper, & Johnson, 2008; CitationWaltham, Bell, & Culshaw, 2005).
In Italy, the term sinkhole is used to indicate a subcircular cavity that opens suddenly on the surface and is used as a synonym of collapse (CitationNisio, Caramanna, & Ciotoli, 2007). Italian sinkholes, which are mainly related to karst phenomena (i.e. doline), are widespread along the Apennine ridge and in pedemontane areas where carbonate bedrock outcrops. However, piping sinkholes not related to karst dissolution are also widespread (CitationCaramanna, Ciotoli, & Nisio, 2008). They mainly occur in plain areas characterised by a thick sedimentary cover over bedrock, and regional faults that allow the circulation of deep mineralised fluids. In the Latium region, piping sinkholes are a well-known natural phenomenon that has been studied since the 1980s (CitationAnnunziatellis et al. 2004; CitationAnnunziatellis, Ciotoli, Guarino, & Nisio, 2010; CitationCiotoli, Di Filippo, Nisio, & Romagnoli, 2001; CitationColombi, Di Loreto, Nolasco, Capelli, & Salvati, 2001). Tyrrhenian coastal plains and fluvial and intermontane valleys represent the typical scenarios in which a sinkhole formed, where the presence of confined aquifers and acidic or geothermic mineralised springs may increase the physical and chemical erosion of the buried carbonate bedrock. Sinkholes cause severe damage to man-made structures, and in some cases catastrophic collapse sinkholes have also caused the loss of human life. Therefore, an important task for sinkhole risk mitigation is the development of maps providing information on the distribution of pre-existing sinkholes and the probability of occurrence of new sinkholes (CitationGutiérrez et al., 2008; CitationWaltham et al., 2005).
This paper presents a sinkhole inventory of the Latium region formed by 393 active or extinct sinkholes. The sinkhole inventory also includes geological, structural, hydrogeological, geochemical and seismic data, which have been used to construct a map of sinkhole susceptibility in which prone areas have been recognised.
Multivariate logistic regression (LR) and geographic information system (GIS) techniques were used to analyse the factors controlling the spatial distribution and predicting sinkhole prone areas (SPAs). LR was applied to find the best model describing the relationship between the presence/absence of a sinkhole (i.e. dependent variable) and a set of geological variables (independent explanatory variables). In this analysis, the concept of risk has been replaced with the more generic concept of susceptibility, which defines the ‘potential' of an area in spatial terms only: a collapse could occur in a certain area in an infinite time interval and an area has characteristics that facilitate a collapse (CitationHubbard, 2003). The identification of SPA in the susceptibility map will provide useful information for planning regulations.
2. Materials and methods
The sinkhole database of the Latium region includes cases surveyed over time by the University of Rome 3, by the Regione Lazio and by the Istituto Superiore per la Protezione e la Ricerca Ambientale (ISPRA). The sinkhole susceptibility map was constructed by defining a probabilistic model that uses the statistical relationships between the presence of events (i.e. sinkhole) and a series of conditioning factors (i.e. geological parameters) that play an important role in the process of sinkhole formation. LR analysis has been applied as a special case of linear regression analysis in which the dependent variable is binary (i.e. presence/absence of sinkhole). The independent variables (i.e. geological parameters) in this model are predictors of the dependent variable and can be measured on a nominal, ordinal, interval or ratio scale (CitationBeguería & Lorente, 2002; CitationBledsoe & Watson, 2001; CitationLamelas, Marinoni, Hoppe, & de la Riva, 2008; CitationLei, Jiang, & Li, 2001; CitationOhlmacher & Davis, 2003). The LR model identifies the most significant factors controlling sinkhole collapse and assigns a weight to each independent variable in order to calculate a value of the dependent variable at the centroids of a 2 × 2 km grid cells.
LR analysis is a quite common statistical method used in Earth sciences, and its function is expressed as(1) where
is the natural logarithm of the probability of a binary (Y) variable, representing the presence (1) or absence (0) of a sinkhole, given q predictive variables (X), β0 is the intercept of the model, βi are the partial regression coefficients and Xi are the values of the independent variables. The probability of Y is described by the logistic function:
(2) The main characteristic of the LR is that, due to its stepwise multivariate analysis, the multicollinearity is completely eliminated. In statistics, the presence of independent variables in a multiple regression model highly correlated to one another can cause strange results with the dependent variable, because they both convey essentially the same information to an understanding of the dependent variable. The variance inflation factor is a measure of multicollinearity in the LR model. For this reason, more attention should be paid to the selection of appropriate conditioning factors. Furthermore, in the LR model the regression coefficients (βi) define the weights of each conditioning factor according to their importance in the phenomenon under investigation, avoiding the subjectivity of heuristic weighting techniques. The exponential transformation of the regression coefficients allows determination of the weights in terms of probability that each variable has in the occurrence of the event (see Equation (2)). Final LR results can also be expressed in terms of probability that the phenomenon manifests itself in space (considering an infinite time) by using:
Data were processed by using Esri ArcGIS 10.2 and IBM SPSS Statistics v.20 according to the following steps:
Selection of the most suitable working scale and construction of a 2 × 2 km grid cell;
Preliminary analysis of the sinkhole spatial distribution;
Selection of the predisposing factors (i.e. geological variables) and their transformation to grid layers;
Assignment of the variable values to the grid centroids (point layer);
Calculation of the LR model, analysis of the β regression coefficients and of the variable significance in the LR model;
Calculation of the Y values for the grid cell centroids and
Construction of the final susceptibility map by using probability kriging.
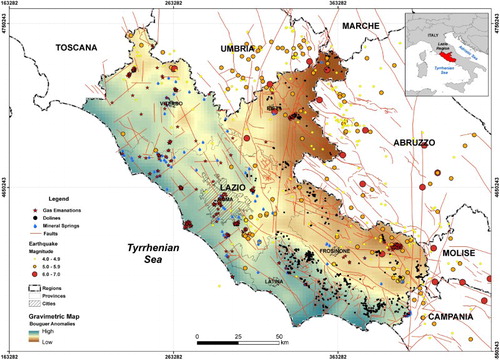
The spatial geodatabase in vector format includes the sinkhole inventory and the data relative to the following informative layers: lithology type, depth of the substratum, water table elevation, presence of mineral and thermo-mineral springs, soil gas emissions, faults, location of earthquake epicentres and their magnitude, and presence of karst dolines (). Data were transformed into binary, ordinal and continuous variables and then converted into 2 × 2 km grids.
Figure 1. Map of the conditioning factors that play an important role in the process of sinkhole formation: lithology type, depth of the substratum, presence of mineral and thermo-mineral springs, soil gas emissions, active faults, location of the earthquake epicentres and their magnitude, and the presence of karst dolines.
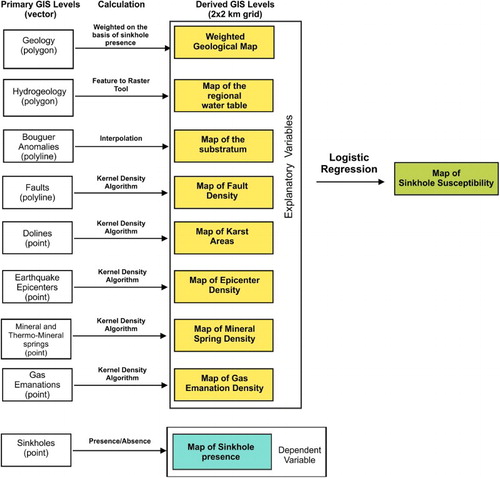
In this study, GIS layer data are produced according to the following procedures ():
Figure 2. Workflow of the procedures and calculations applied to obtain the base grid layers (2 × 2 km) used within the LR.
Binary variables. Sinkhole location was transformed to a raster layer where the grid cell has an assigned value of 1 or 0 according to the presence/absence of the collapse.
Categorical variables. For each of the lithology type of the Geological Map of the Latium Region (scale 1:25,000) in vector format (CitationCosentino & Pasquali, 2012), a frequency percentage of the shallow lithology relative to the sinkholes presence was calculated. The frequency value was used to weight the area of the lithology type occurring within the elementary cell of the grid transformed geological map. In this way, the geological map was classified according to the presence of sinkholes.
Continuous variables. The depth of the substratum calculated using the gravimetric map (map of Bouguer anomalies) of Latium and the regional water table obtained from the Hydrogeological Map of Latium (scale 1:100,000) (CitationCapelli et al., 2012). All other predisposing factors having point and linear geometry have been converted into raster layers with continuous values of the grid cell by applying a kernel density algorithm to point layers (i.e. earthquake epicentres, dolines, gas emissions, etc.), and to linear layers (i.e. faults) to obtain density maps.
In the final geodatabase, each layer, therefore, represents a conditioning factor of sinkhole susceptibility the weight of which will correspond to the appropriate coefficient of the regression equation. Results obtained in this pre-analysis phase provide 11 predictor variables and the dependent variable. In order to apply the LR, a point feature class was created, where each point corresponds to the centroid of the grid cell; the total number of points was 4606. The value of each raster was extracted at point locations by the ‘Extract multivalues to point' tool of ArcGIS, and recorded in the attribute table. Data were then randomly divided into two subsets (training and test data) by using a bootstrapping method; the training data (30% of the total data) were used to construct the regression model, and the test data (70% of the total data) were used to validate the model.
3. Results and discussion
The classification table of the regression results is reported in ; results highlight that the regression model for the training data is corrected for 85.3% of points for the 0 code (i.e. sinkhole absence), for 59.0% for the 1 code (i.e. sinkhole presence) and for 79.5% for the total model. shows the variables included in the model, their regression coefficients and significance for a p-level set at 0.05% (p < .05). Some variables are not included in the model due to their multicollinearity (i.e. faults, water table elevation, normal springs and earthquakes of magnitude <2), and so their results are not significant in the model (). According to the variables included in the model, the regression equation is:
Table 1. Classification of the observations in the model.
Table 2. Variables in the regression equation.
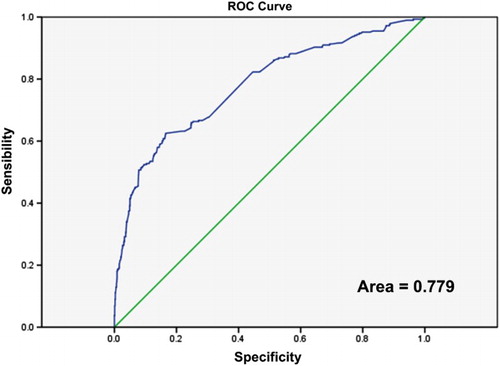
The Exp(β) values in the table are odds ratios. In a LR, the coefficients (β) are the estimated increase in the log odds of the outcome per unit increase in the value of the exposure. In other words, the exponential function of the regression coefficient (eβ1) is the odds ratio associated with a one-unit increase in the exposure. The ROC curve area (0.779) calculated by using test data confirms the goodness-of-fit of the model ().
Figure 3. Receiver operating characteristics (ROC) curve that represents the goodness of the regression model constructed by using test data (about 70% of the total data).
The estimated values are then contoured by using a probability kriging algorithm to obtain a susceptibility map. The final susceptibility Main Map of the Lazio Region highlights the presence of some SPAs, and shows the zones of high susceptibility in which sinkholes do not occur and/or are not detected.
4. Conclusions
Currently SPAs have been identified in the Latium Region, where in the past or in recent times sinkhole phenomena occurred. LR analysis improved the definition of prone areas by including and confirming predisposing factors, whilst geospatial analysis provided techniques for the construction of the sinkhole susceptibility map. The map highlights the presence of other areas, characterised by conditions that may predispose and trigger the formation of new collapses, but where sinkholes have not been recorded.
To date, the legislation of the Regione Lazio (DGR 1152/2002) does not provide restrictions and requirements to be followed in SPAs; the susceptibility map will constitute the base document to prepare new legislation more responsive to the real situation of the territory, and more effective in terms of prevention and monitoring of this phenomenon.
Software
LR analysis was performed by using IBM SPSS Statistics v.20; maps were produced using Esri ArcGIS 10.2.
ORCID
G. Ciotoli http://orcid.org/0000-0002-9496-3021
Sinkhole susceptibility map of the Lazio region, central Italy
Download PDF (2.4 MB)References
- Annunziatellis, A., Beaubien, S. E., Ciotoli, G., Lombardi, S., Nisio, S., & Nolasco F. (2004). Studio dei parametri geologici e geochimici per la comprensione dei meccanismi genetici degli profondamenti nella piana di S. Vittorino. Atti Conv. Stato dell'arte sullo studio dei fenomeni di sinkholes e ruolo delle amministrazioni statali e locali nel governo del territorio (pp. 63–82). Roma 20–21 maggio 2004.
- Annunziatellis, A., Ciotoli, G., Guarino, P. M., & Nisio, S. (2010). Nuovi dati sui sinkholes del bacino delle Acque Albule (Tivoli, Roma). Atti 2° Workshop internazionale “I Sinkholes. Gli sprofondamenti catastrofici nell'ambiente naturale ed in quello antropizzato” (pp. 395–412). Roma 3–4 dicembre 2009.
- Beck, B. F. (2005). Soil piping and sinkhole failures. In D. C. Culver & W. B. White (Eds.), Encyclopedia of caves (pp. 52–528). New York, NY: Elsevier.
- Beguería, S., & Lorente, A. (2002). Landslide hazard mapping by multivariate statistics: Comparison of methods and case study in the Spanish Pyrenees – DAMOCLES project deliveries. Retrieved March 1, 2003, from http://www.damocles.irpi.cnr.it/docs/reports/df_modelling.pdf
- Bledsoe, B. P. & Watson, C. C. (2001). Logistic analysis of channel pattern thresholds: Meandering, braiding, and incising. Geomorphology, 38, 281–300. doi: 10.1016/S0169-555X(00)00099-4
- Capelli, G., Mastrorillo, L., Mazza, R., Petitta, M., Baldoni, T., Banzato, F., … Teoli P. (2012). Carta Idrogeologica della Regione Lazio, scala 1:100000 (4 fogli). Regione Lazio, S.EL.CA. Firenze. A cura della Regione Lazio, Area Difesa del Suolo.
- Caramanna, G., Ciotoli, G., & Nisio, S. (2008). A review of natural sinkhole phenomena in Italian plain areas. Natural Hazards, 45(2), 145–172 doi: 10.1007/s11069-007-9165-7
- Ciotoli, G., Di Filippo, M., Nisio, S., & Romagnoli, C. (2001). La Piana di S. Vittorino: Dati preliminari sugli studi geologici, strutturali, geomorfologici, geofisici e geochimici. Memorie Società Geologica Italiana, 56, 297–308.
- Colombi, A., Di Loreto, E., Nolasco, F., Capelli, G., & Salvati, R. (2001). The purposes of the main sinkhole project in the Latium Region of central Italy. In B. F. Beck & J. G. Herring (Eds.) Geotechnical and environmental applications of karst geology and hydrology (pp. 73–76). Leiden: Balkema.
- Cosentino, D., & Pasquali, V. (2012). Carta Geologica Informatizzata della Regione Lazio. Università degli Studi Roma Tre Dipartimento di Scienze Geologiche, Regione Lazio Agenzia Regionale Parchi Area Difesa del Suolo. (Coordinamento editoriale G. Catalano, C. Fattori, D. Mancinella, F. Meloni).
- Galve, J. P., Gutiérrez, F., Lucha, P., Guerrero, J., Bonachea, J., Remondo, J., & Cendrero, A. (2009). Probabilistic sinkhole modelling for hazard assessment. Earth Surface Processes and Landforms, 34, 437–452. doi:10.1002/esp.1753
- Gutiérrez, F., Cooper, A. H., & Johnson, K. S. (2008). Identification, prediction and mitigation of sinkhole hazards in evaporite karst areas. Environmental Geology, 53, 1007–1022. doi: 10.1007/s00254-007-0728-4
- Hubbard, D. A., Jr. (2003). Use of regional sinkhole mapping for sinkhole susceptibility maps. Sinkholes and the engineering and environmental impacts of karst (pp. 61–71). Retrieved September 6, 2003, from doi:10.1061/40698(2003)5
- Lamelas, M. T., Marinoni, O., Hoppe, A., & de la Riva, J. (2008). Doline probability map using logistic regression and GIS technology in the central Ebro Basin (Spain). Environmental Geology, 54, 963–977. doi:10.1007/s00254-007-0895-3
- Lei, M., Jiang, X., & Li, Y (2001). New advances of karst collapse research in China. In B. F. Beck & J. G. Herring (Eds.), Geotechnical and environmental applications of karst geology and hydrology (pp. 145–151). Lisse: Swets and Zeitlinger.
- Nisio, S., Caramanna, G., & Ciotoli, G. (2007). Sinkholes in Italy: First results on the inventory and analysis. In M. Parise & J. Gunn (Eds.), Natural and anthropogenic hazards in karst areas: Recognition, analysis and mitigation ( Geological Society Special Publication no. 279, pp. 23–45). London: The Geological Society. Retrieved May 1, 2007, from doi:10.1144/SP279.4
- Ohlmacher, G. C., & Davis, J. C. (2003). Using multiple logistic regression and GIS technology to predict landslides hazards in northeast Kansas, USA. Engineering Geology, 69, 331–343 doi: 10.1016/S0013-7952(03)00069-3
- Waltham, T., Bell, F., & Culshaw, M. (2005). Sinkholes and subsidence. Berlin: Springer.