
Abstract
Storm Xynthia was responsible for the death of 41 people by drowning after the flooding by the sea of low-lying areas along French Atlantic coast in February 2010. This toll was partly explained by inadequacy of houses to flood hazard: 78% of the deaths occur in single-storey constructions.
In this paper, we propose a map linking architectural typology of constructions with potential water depth in case of coastal flood event. The goal is to identify residential houses which present a high level of vulnerability for people to a potential coastal flood event. This work is presented on Noirmoutier Island which was few impacted by Storm Xynthia. However, it presents some common points with the most hit territories during the storm: 70% of the territory is under Xynthia level; 65% of the houses located in this low-lying area are single-storey constructions
This map shows us different vulnerability between the four towns of the island.
1. Introduction
In February 2010, Storm Xynthia led to a severe coastal flood on the French Atlantic coast. It was the result of high tide levels combined with low atmospheric pressure (CitationBertin et al., 2012). 50,000 ha of land were flooded in the departments of Charente-Maritime and Vendée. Storm Xynthia killed 41 people by drowning, 29 of whom died in the municipality of La Faute-sur-Mer (south Vendée). 75% of the deaths occurred in single-storey constructions, where people were trapped by the rising water with no chance of escaping (CitationVinet et al., 2012a).
This toll was explained by the inadequacy between the architecture and the potential coastal flood areas. It was one of the most important lessons learned from the storm and symbolizes the difficulty of public policies to control urbanization in areas at risk (CitationChadenas et al., 2013). After this event, the French government decided to identify residential constructions that were considered too dangerous and destroy them (CitationMercier & Chadenas, 2012). This evaluation was made on the basis of five criteria (i) a building that received one meter or more of water during the storm; (ii) a building located between 90 and 110 meters from a dike; (iii) the kinetics of the flood; (iv) the level of damage to the building and the architecture; (v) the coherence of the delimited area to avoid dispersion of constructions. These criteria were severely criticized because of a lack of transparency in the method (CitationVerger, 2010; CitationMercier & Chadenas, 2012; CitationMagnan & Duvat, 2014). However, this policy concerned only those municipalities that were impacted by the storm.
In fact, there are many urbanized low-lying areas on the French Atlantic coast (CitationCETMEF et al., 2009). Charente-Maritime and Vendée are the departments most visited by tourists and have seen a significant growth in construction in coastal municipalities since 1950 (CitationRenard, 2008; CitationChauveau et al., 2011). Moreover, single-storey houses are the traditional model of construction in this sector (CitationPerret & Sauzeau, 2014). For all these reasons, there is a need for an assessment of potentially at-risk buildings.
In this paper, we propose a map that links potential water depth with the architectural typology of constructions as a way of identifying houses with high exposure to coastal flood hazard (see Main Map). Consequently, it is a work at a very fine scale: residential houses. We use the example of Noirmoutier Island, which was not impacted by Storm Xynthia but has some similarities with La Faute-sur-Mer: an urbanized low-lying area with a large proportion of single-storey constructions (CitationChevillot-Miot et al., 2013). In addition, some storms have caused major damage in the past, such as those of 1937, which flooded two-thirds of the island (CitationGarnier et al., 2012).
2. Study site
Noirmoutier Island is located in the department of Vendée, 50 km to the north of La Faute-sur-Mer, which was the town most impacted by Storm Xynthia. It is a 45 km² island, separated from the mainland by the narrow Fromentine channel (500 meters wide).
The north of the island is bedrock located at an elevation of around 10 meters (CitationFattal et al., 2010). From the west coast of the bedrock to the south of the island, a long sandy barrier protects the island from the Atlantic Ocean, with a height always greater than 5.20 m (all altitudes are given in meters NGF-IGN69 (Nivellement Général de la France-Institut Géographique National)),. On Noirmoutier Island, the height of 0 m NGF-IGN69 is located 3.10 m above the lowest astronomical sea level (CitationSHOM, 2012). Behind the sandy barrier, there are salt marshes, which have been progressively disconnected from the sea by dikes along the east coast of the island, facing Bourgneuf Bay. These dikes are lower than 3.50 m NGF-IGN69 in the lowest places. The ancient salt marshes represent 70% of the island and are located below 4.20 meters, which is the sea-water level measured in Noirmoutier-en-l’Île harbor during Storm Xynthia (CitationDevaux et al., 2012). Polders are particularly exposed to coastal flood events (CitationVerger, 2011).
Noirmoutier Island is composed of four municipalities. Noirmoutier-en-l’Île is the largest with 9,678 inhabitants (in 2009). It is located on the bedrock. The other three are smaller (1,460 in |La Guérinière, 1,713 in L'Epine and 1,785 in Barbâtre) and are located partly on the dune and partly on the salt marshes. From north to south, they lie in the order: L'Epine, La Guérinière and Barbâtre.
For early development, construction was located on the bedrock or just between the dunes and the salt marsh (to be sheltered from the wind and close to the marshes). The growth of tourism over the last 50 years has led to a significant development of residential houses. Today, more than half of all construction is for secondary homes following a growth of 350% in construction between 1968 and 2009 (for principal homes, this growth was 75% over the same period). The associated urbanization is responsible for a significant pressure on land. The top of the dunes has been built on for the “sea view” while low-lying areas close to the original village have also been progressively developed.
Consequently, Noirmoutier Island is a particularly interesting place to analyze. Land occupation has evolved since the 1950s and, during the same period, no significant coastal flood has occurred according to historical research (CitationGarnier & Surville, 2010). Nevertheless, a large storm partly flooded the island in 1937, when two-thirds of Noirmoutier was covered by water (CitationGarnier et al., 2012). Yet, there was no serious destruction as few buildings were located in flooded areas at this time.
Noirmoutier Island was not impacted by Storm Xynthia because of its location north of the maximum wind speed, which limited the storm surge (CitationBertin et al., 2012; CitationDevaux et al., 2012). As noted above, the maximum sea level measured during Xynthia in Noirmoutier Island was 4.20 meters, which is 30 to 40 centimeters above the theoretical 1 in 100 years sea-water level (CitationPineau-Guillou, 2012). The maximum sea level measured during Storm Xynthia in France was 4.70 m in La Faute-sur-Mer, which was estimated at a return period of 177 years (CitationMagnan & Duvat, 2014).
A small area of the island (3%) was flooded mainly by wave overtopping the dikes. The sectors flooded were located in the eastern part of the island, where protections are lower, mainly Noirmoutier-en-l’Île harbor and Les Sableaux (CitationDevaux et al., 2012). 272 buildings were affected by the coastal flood: 182 in Noirmoutier-en-l’Île and 90 in L'Epine (CitationDevaux et al., 2012)
Although Storm Xynthia had little impact on Noirmoutier Island, it can be assumed that the study site would be vulnerable in the case of a major coastal flood such as the one which occurred in 1937.
3. Method
For this work, residential building vulnerability was assessed by a combination of potential water level and construction type. The geometry of buildings was obtained using the database BD Topo (from the National Geographic Institute).
3.1. Potential water depth per construction
Water depth was identified as a factor of vulnerability for people after Storm Xynthia (CitationVinet et al., 2011b) and more generally in the case of flooding (CitationJonkman & Penning-Roswell, 2008). All deaths by drowning linked to Storm Xynthia occurred in houses that received more than 1 meter of water. To estimate the potential water depth in buildings, we used the Xynthia water level and the altitude of the ground of houses:
- the Xynthia level corresponds to the maximum sea-water level measured in Noirmoutier-en-l’Île harbor during Storm Xynthia (CitationDevaux et al., 2012) i.e. 4.20 m. This level is now the reference value used for the Risk Prevention Plan (RPP), in which it is recommended to use the 1 in 100 years sea-water level or the historical one if it is higher (CitationChadenas et al., 2013). For this paper, we focus only on this event, therefore “potential water level” refers to the height between ground level and 4.20 m.
- the altitude of buildings was measured for each house using LiDAR data Litto-3D, which provides a vertical accuracy of 20 centimeters (CitationIGN & SHOM, 2012). The altitude for each building corresponds to the elevation of the natural ground at the house location. It is not necessarily the elevation of the ground floor, which can be slightly above or below depending on the presence of a crawlspace.
This calculation gives the difference between the altitude of the ground of houses and the potential water level that could be reached during Storm Xynthia. Thus, it provides the potential depth that could be reached by water in every house for this type of event.
This is a static approach to a potential coastal flood: we consider that the whole territory under the sea-water level 4.20 m, and linked to the sea, could be flooded. This method overestimates water depths but gives a first estimation of building vulnerability to coastal flood hazard on the island (CitationBreilh et al., 2013).
These results were divided into four categories: houses that cannot be flooded, houses that can be flooded between 0 and 1 meter, houses that can be flooded between 1 and 2 meters, and houses that can be flooded by more than 2 meters.
- Non-flooded buildings are thus located above 4.20 m NGF-IGN69 and are not exposed to coastal flood hazard. On Noirmoutier Island, this concerns 40% of residential buildings.
- Between 0 and 1 meter: this is a critical level for young or disabled people (CitationVinet et al., 2011b). On Noirmoutier Island, this concerns 38% of the residential buildings located in a potentially flooded area.
- Between 1 and 2 meters: above one meter it is agreed that the safety of people is threatened (CitationMEDDTL, 2011). During Xynthia, 25 deaths occurred between 1.1 and 1.8 meters of water (CitationVinet et al., 2011b). On Noirmoutier Island, this concerns 51% of the residential buildings located in a potentiall flood area.
- Above 2 meters: water depth generally reaches the ceiling making a trap for the inhabitants. During Storm Xynthia, 14 deaths occurred in this category (CitationVinet et al., 2011b). On Noirmoutier Island, this concerns 11% of the residential buildings located in a potential flood area.
This operation was carried out using Esri ArcGIS 10.1. Calculation of the height of buildings from Litto-3D and the potential water depth for each building was performed using Spatial Analyst. Depending on the potential water depth in the building, they were each given a letter (Ø = not flooded, a = flooded between 0 and 1 meter, b = flooded between 1 and 2 meters, c = flooded by 2 meters or more).
3.2. Architectural typology of residential buildings
The architectural typology of residential buildings was another major factor that explained the toll of Storm Xynthia: 78% of the deaths by drowning in La Faute-sur-Mer occurred in single-storey buildings (CitationVinet et al., 2011a; CitationVinet et al., 2011b; CitationVinet et al., 2012a; CitationVinet et al., 2012b)
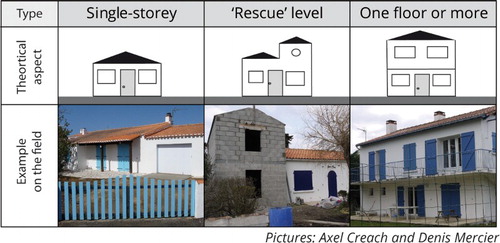
Based on previous work, residential buildings were divided into 3 categories, depending on the risk to the occupants (CitationJousseaume & Mercier, 2009; CitationVinet et al., 2011a; CitationVinet et al., 2012a; CitationChevillot-Miot et al., 2013). We distinguish single-storey construction, construction with a rescue-level and construction with one floor or more ().
- Single storey constructions: without an upper floor, the single storey could be a trap for people during flooding. If the water rose rapidly, people could be surprised and trapped inside the house with no chance of escaping from the top. During Xynthia, 78% of deaths were located in single-storey buildings, some receiving approximately 2.50 m of water (CitationVinet et al., 2011b; CitationDevaux et al., 2012). Unfortunately, this type of residential construction is particularly common in coastal low-lying areas in Vendée and Charente-Maritime departments (CitationVinet et al., 2012b). On Noirmoutier Island, it comprises 65% of the residential buildings located in a potential flood area.
- ‘Rescue’ level buildings: CitationVinet et al. (2012a) defined these as “a less dangerous building because it allows people to find refuge in case of rising water, however the inside access is not always guaranteed, and cannot always accommodate all occupants”. Four deaths occurred in this type of building during Storm Xynthia (CitationVinet et al., 2012b). On Noirmoutier Island, this comprises 21% of the residential buildings located in a potential flood area.
- One floor or more: residential buildings with one floor or more offer the possibility for people to escape upstairs and, in contrast to the previous type, “give the advantage to accommodate all occupants of the housing” (CitationVinet et al., 2012a). One death occurred in this type of construction during Storm Xynthia (CitationVinet et al., 2012b). On Noirmoutier Island, it comprises 14% of the residential buildings located in a potential flood area.
Figure 1. Architectural typology of buildings.
Data were collected in the field between April 2012 and February 2014, but only for buildings that were identified as potentially flooded. Similarly to water depth, a number was given to each house depending on the architectural typology of the residential building (1 = one floor or more, 2 = rescue level, 3 = single storey). Results are shown in the Main Map. It also presents maps of potential water depth and architectural typology of constructions.
3.3. Relationship between these two factors and cartography
As noted above, water depth and architectural typology are the two main factors that explain the toll of Storm Xynthia. Logically, it can be assumed that a single-storey construction in which water depth can reach 2 meters or more presents a potentially lethal risk to its dwellers. In contrast, a residential building with one floor or more in which the water depth cannot exceed 1 meter is potentially a much safer place. Between these two positions, there are some alternative situations, which could be more or less dangerous for people depending on other factors such as age and behavior. For example, a water depth of less than 1 meter in a single-storey building could be dangerous for children. A construction with one floor or more could present a high level of risk for someone who has problems in moving easily.
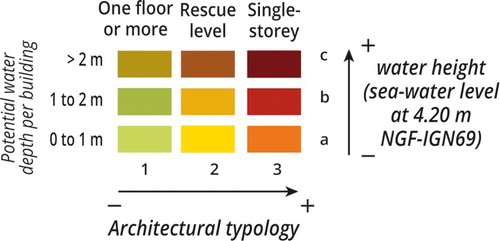
By combining the numbers and letters given in the above sections, a matrix of 9 categories was developed, mixing potential water depth and architectural typology of residential buildings on Noirmoutier Island (). Logically, the least vulnerable are houses with one floor and a potential water depth less than 1 meter (1a). In contrast, the most vulnerable are single-storey constructions that could have two meters or more of flooding (3c).
Figure 2. Matrix used for the map.
4. First results
4.1. Exposure of Noirmoutier Island municipalities
As noted previously, Noirmoutier-en-l’Île is located on the highest part of the territory but it is also the largest municipality on the island. Consequently, it is not surprising that this is where there are the highest number of buildings in potential flood areas (2,304) (). However, it is also proportionally the least exposed because this represents only 25% of the total buildings in the town.
Figure 3. Distribution of buildings per municipality.
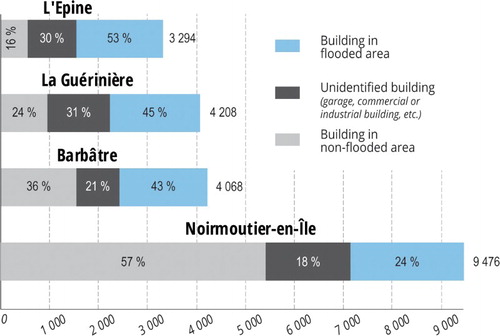
In contrast, the three other municipalities are located between dunes and marshland. They are smaller in terms of inhabitants and the number of buildings (between 3,294 and 4,208 – in comparison with 9,476 buildings in Noirmoutier-en-l’Île). As a result, a large proportion of their houses are located in low-lying areas. 43% of buildings in Barbâtre are in potential flood zones, 45% in La Guérinière. The most exposed town is L'Epine, in which 53% of the buildings are located in low-lying areas.
4.2. Vulnerability of Noirmoutier Island municipalities
In terms of vulnerability, the results are similar. L'Epine and Barbâtre municipalities present a higher vulnerability to coastal flood hazard. In , it can be seen that 70% of their buildings are single-storey constructions and more than 75% of them would be exposed to one meter of water or more in the case of flooding. Due to this configuration, 60% of the houses located in low-lying areas are single-storey constructions with a potential water depth above one meter. Water above one meter is a source of danger for people (CitationMEDDTL, 2011; CitationVinet et al., 2011b) and thus single-storey constructions are likely to be a trap for people in this case.
Figure 4. Proportion of vulnerable buildings per municipality.
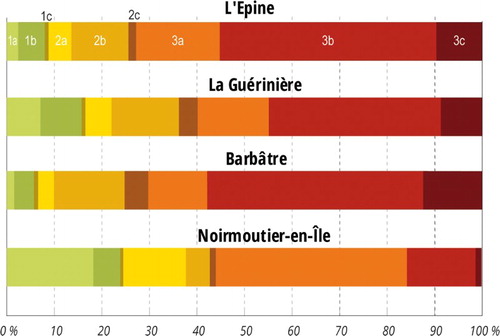
Residential houses in La Guérinière are slightly less vulnerable than in these two municipalities. This is due to a smaller proportion of single-storey constructions in this town: around 60%.
In contrast, although Noirmoutier-en-l’Île has the largest number of buildings exposed to coastal flood hazard, these are less vulnerable. This is linked to the fact that the elevation of this town is higher than the other three: 72% of constructions have a potential water depth below one meter. Moreover, the proportion of single-storey constructions is slightly less than in the other municipalities of the island: for example, 55% in Noirmoutier-en-l’Île and more than 75% in L'Epine. Consequently, the proportion of houses exposed to a high level of danger (single-storey constructions with a potential water depth above one meter) is not very large: only 15% of the constructions located in low-lying areas.
4.3. First tentative explanation
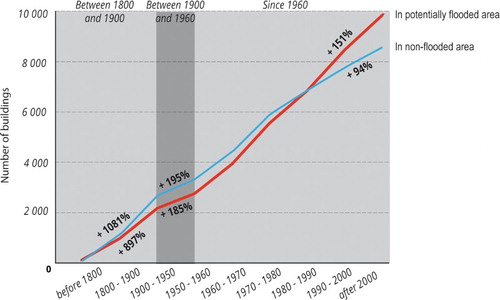
These observations and the difference between Noirmoutier-en-l’Île and the three other municipalities of the island can be explained by its geography. Since the middle of the 20th century, Noirmoutier Island has seen significant urbanization (), due to the arrival of new populations with the increase in tourism. Since 1980, low-lying areas have seen more urbanization than the rest of the island. This can be explained by the limited space available in non-flooded areas on Noirmoutier Island. As can be seen in , the dynamics of urbanization have been greater in potential flood areas than in the other parts of the island since this date.
Figure 5. Evolution of buildings on Noirmoutier Island.
At the same time, the absence of planning regulations and, more particularly, of a Risk Prevention Plan (RPP), which can prescribe adjustments to houses located in coastal flood hazard areas, has led to the development of the current building vulnerability. The RPP is a national regulation to prevent urbanization of low-lying areas. It is urbanization at the municipal level at the requirement of the Department prefect (CitationChadenas et al., 2013). Although the RPP regulation was created by the Barnier law of 1995, the RPP for Noirmoutier Island was only begun in 2008 and the technical studies are still in progress, as for many municipalities in France in coastal and fluvial areas (CitationVinet, 2010).
5. Discussion
The results displayed on the maps are a first estimation of building vulnerability on Noirmoutier Island. However, some limitations of this assessment can be noted.
Firstly, the static method, used to delimit coastal flood areas and estimate potential water depth in buildings, tends to overestimate flood areas and water depths (CitationBreilh et al., 2013). However, hydrodynamic numerical simulations are based on a hypothesis that can differ from one storm event to another. The use of a static model provides an estimation of every place that can be flooded, independently of the type of coastal flood. It will be interesting to improve this methodology by using a two-dimensional hydraulic model (CitationBertin et al., 2014) or the alternative method proposed by CitationBreilh et al. (2013), in which surge overflow volumes are calculated in order to limit the extent of the flood hazard area.
Another interesting improvement would be the use of other return period events in order to compare different coastal flood scenarios and identify priority areas to reduce vulnerability. Indeed, in this paper we focus only on one flood event: Storm Xynthia. It is the only coastal flood event0020responsible for deaths by drowning in France in the last thirty years (CitationVinet et al., 2012b). The sea-water level used for this work has had a legal character since the State Circular of 27th July 2011, which recommends estimating coastal flood hazard areas on the basis of a 1 in 100 years event or a more important historical event if known (CitationMEDDTL, 2011). As seen above, the sea level measured during Xynthia was higher than the 1 in 100 years event.
However, other return period events are available in the document published by CitationPineau-Guillou (2012), which gives the sea-water level for 4 different return periods: 1 in 10 years event, 1 in 20 years event, 1 in 50 years event and 1 in 100 years event.
As a result, the number of houses that could be flooded may be overestimated for the Xynthia water level. Nevertheless, it provides a useful assessment of building vulnerability on Noirmoutier Island, which can be complemented by other more detailed studies.
Secondly, there is a limitation in the collection of data on the architectural type of buildings. During data collection, some houses were not possible to identify, as they were hidden by a wall or trees, thus some constructions were unidentified (between 18% and 31% depending on the towns – ).
Moreover, the relevance of water depth and architectural typology to assess the vulnerability of buildings to people can be challenged. For example, a residential house with an upper floor that receives more than one meter of water is not necessarily safer for people than a single-storey construction with the same water depth. If people are located on the ground floor when the flood occurs, they can be trapped, even in a house with an upper floor, if they are surprised and have no time to escape upstairs. As an example, during Storm Xynthia, 100% of the deaths that occurred in houses with a rescue level or with an upper floor were located at less than 50 meters from an overflowed dike (CitationVinet et al., 2011b). Indeed, as shown in reports published after Storm Xynthia (CitationVinet et al., (2011b; Citation2012b), many other factors can explain the human toll of the storm, such as the age of people and their proximity to a dike, which is responsible for an aggravation of risk in the case of a breach. To go further in identifying the characteristics of buildings that are sources of danger or safety for people, we are building an index to evaluate the potential vulnerability of residential buildings for their occupants (CitationCreach et al., 2015).
6. Conclusion
37% of residential houses on Noirmoutier Island are located in potential flood areas. 65% of them are single-storey constructions and 60% could be flooded by one meter or more of water. The absence of a Risk Prevention Plan (which is in progress in 2015) could explain this inadequacy between coastal flood hazard and the architecture of residential houses. Nonetheless, Storm Xynthia highlighted the danger of this type of situation for inhabitants in south Vendée and Charente-Maritime.
Today, Noirmoutier Island could be particularly exposed if a storm of the same intensity as that of 1937 or Xynthia hits the Island directly. This is especially true in the actual context of sea-level rise due to climate change. Residential buildings could be exposed and put their occupants at risk since the potential coastal flood areas have been urbanized with no systematic architectural adjustments to houses.
This is a first attempt to assess building vulnerability on Noirmoutier Island. The next step will be the application of the V.I.E. index, which is a more complete index, to assess the vulnerability of residential houses to their occupants (CitationCreach et al., 2015).
Software
Esri Arc Gis 10.1 was used for data analysis with the final map drafted using Adobe Illustration CS4.
Vulnerability map to coastal flood hazard of residential buildings on Noirmoutier Island (France)
Download PDF (108.3 MB)Acknowledgements
The authors would like to thank Martin Paillart and Fanny Collier from the Communauté de Communes de l’Île de Noirmoutier (CCIN) for all their help. We would also like to thank all the PhD students who assisted in the collection of data in the field. We acknowledge the support of the COSELMAR research program, funded by Région Pays de la Loire, and the LETG Nantes-Géolittomer, UMR 6554 CNRS for its daily support. We also like to thank Carol Robins for his attentive re-reading. Finally, we would like to thank warmly the three reviewers for their useful comments which contribute to the improvement of this work.
ORCID
Axel Creach http://orcid.org/0000-0002-6444-735X
Related Research Data
References
- Bertin, X., Bruneau, N., Breilh, J.-F., Fortunato, A. B., & Karpytchev, M. (2012). Importance of wave age and resonance in storm surges: The case Xynthia, Bay of Biscay. Ocean Modelling, 42, 16–30. doi:10.1016/j.ocemod.2011.11.001
- Bertin, X., Li, K., Roland, A., Zhang, Y. J., Breilh, J. F., & Chaumillon, E. (2014). A modeling-based analysis of the flooding associated with Xynthia, central Bay of Biscay. Coastal Engineering, 94, 80–89. doi:10.1016/j.coastaleng.2014.08.013
- Breilh, J.-F., Chaumillon, E., Bertin, X., & Gravelle, M. (2013). Assessment of static flood modeling techniques: application to contrasting marshes flooded during Xynthia (western France). Nat. Hazards Earth System Sciences, 13(6), 1595–1612. doi:10.5194/nhess-13-1595-2013
- CETMEF, CETE Méditerranée, & CETE Ouest (2009). Vulnérabilité du territoire National aux risques littoraux - France métropolitaine (p. 163). CETMEF / DLCE. http://www.cetmef.developpement-durable.gouv.fr/vulnerabilite-du-territoire-a406.html . Accessed 3 September 2014
- Chadenas, C., Creach, A., & Mercier, D. (2013). The impact of storm Xynthia in 2010 on coastal flood prevention policy in France. Journal of Coastal Conservation, 17(4), 1–10. doi:10.1007/s11852-013-0299-3
- Chauveau, E., Chadenas, C., Comentale, B., Pottier, P., Blanløeil, A., Feuillet, T., & Tillier, I. (2011). Xynthia: leçons d'une catastrophe. CyberGeo: European Journal of Geography. doi:10.4000/cybergeo.23763
- Chevillot-Miot, E., Creach, A., & Mercier, D. (2013). La vulnérabilité du bâti face au risque de submersion marine: premiers essais de quantification sur l’île de Noirmoutier (Vendée). Les Cahiers Nantais, 2013(1), 5–14.
- Creach, A., Pardo, S., Guillotreau, P., & Mercier, D. (2015). The use of a micro-scale index to identify potential death risk areas due to coastal flood surges: lessons from Storm Xynthia on the French Atlantic coast. Natural Hazards (accepted).
- Devaux, E., Désiré, G., Boura, C., Lowenbruck, J., Bérenger, N., Rouxel, N., & Romain, N. (2012). La tempête Xynthia du 28 février 2010 – Retour d'expérience en Loire-Atlantique et Vendée - Volet hydaulique et ouvrages de protection. CETE-Ouest / DREAL Pays-de-la-Loire / DDTM Loire-Atlantique / DDTM Vendée. 78p.
- Fattal, P., Robin, M., Paillart, M., Maanan, M., Mercier, D., Lamberts, C., & Costa, S. (2010). Effets des tempêtes sur une plage aménagée et à forte protection côtière: la plage des Éloux (côte de Noirmoutier, Vendée, France). Norois, 215(2), 101–114. doi: 10.4000/norois.3289
- Garnier, E., & Surville, F. (2010). La tempête Xynthia face à l'histoire; submersions et tsunamis sur les littoraux français du Moyen Âge à nos jours. Saintes: Le Croît Vif. 176p.
- Garnier, E., Henry, N., & Desarthe, J. (2012). Visions croisées de l'historien et du courtier en réassurance sur les submersions: recrudescence de l'aléa ou vulnérabilisation croissante? In V. Przyluqki & S. Hallegatte (Eds.), Gestion des risques naturels – Leçons de la tempête Xynthia (pp. 105–128). Quae, Versailles.
- IGN & SHOM (2012). Litto3D® – v 1.0 - Spécifications techniques. 16p.
- Jonkman, S. N., & Penning-Rowsell, E. (2008). Human Instability in Flood Flows. JAWRA Journal of the American Water Resources Association, 44(5), 1208–1218. doi:10.1111/j.1752-1688.2008.00217.x
- Jousseaume, V., & Mercier, D. (2009). Évaluer la vulnérabilité architecturale de l'habitat en zone inondable. L'exemple du Val nantais. In S. Becerra & A. Peltier (Eds.), Risques et environnement: recherches interdisciplinaires sur la vulnérabilité des sociétés (pp. 199–214). L'Harmattan, Paris.
- Magnan, A., & Duvat, V. (2014). Des catastrophes … “naturelles”?. Paris: Editions Le Pommier. 316p.
- MEDDTL (Ministère de l’écologie, du développement durable, des transports et du logement) (2011). Circulaire du 27 juillet 2011 relative à la prise en compte du risque de submersion marine dans les plans de prévention des risques naturels littoraux. 19p.
- Mercier, D., & Chadenas, C. (2012). La tempête Xynthia et la cartographie des « zones noires » sur le littoral français: analyse critique à partir de l'exemple de La Faute-sur-Mer (Vendée). Norois, 222(1), 45–60. doi: 10.4000/norois.3895
- Perret, J., & Sauzeau, T. (2014). Xynthia ou la mémoire réveillée. Des villages charentais et vendéens face à l'océan (XVIIIe-XXIe siècles). La Crèche: Geste. 296p.
- Pineau-Guillou, L. (2012). Statistiques des niveaux marins extrêmes des côtes de France (Manche et Atlantique) (Technical report No. X005HYI). 160p.
- Renard, J. (2008). L'impact du tourisme sur les évolutions des populations du littoral vendéen (1964–2007, In Coll (Ed.) Les Vendéen et la mer, de la grande pêche au Vendée Globe. Editions du CVRH, La Roche-sur-Yon, pp. 663–686
- SHOM (2012). Ouvrage de marée: références altimétriques maritimes - Cote du zéro hydrographique et niveaux caractéristiques de la marée. 104p.
- Verger, F. (2010). Xynthia, zones d'ombre sur les zones noires. Etudes foncières, (145), 6–9.
- Verger, F. (2011). Digues et polders littoraux: réflexions après la tempête Xynthia. Physio-Géo. Géographie, physique, et environnement, (Volume 5), 95–105. doi:10.4000/physio-geo.1740
- Vinet, F. (2010). Le risque inondation. Diagnostic et gestion. Paris, Tec & Doc Lavoisier, 318p.
- Vinet, F., Defossez, S., & Leclere, J.-R. (2011a). Comment se construit une catastrophe? Place Publique, (Hors-série), 8–17.
- Vinet, F., Boissier, L., & Defossez, S. (2011b). La mortalité comme expression de la vulnérabilité humaine face aux catastrophes naturelles: deux inondations récentes en France (Xynthia, Var, 2010). VertigO-La Revue Électronique En Sciences de L'environnement. Retrieved from http://vertigo.revues.org/11074
- Vinet, F., Defossez, S., Rey, T., & Boissier, L. (2012a). Le processus de production du risque « submersion marine » en zone littorale: l'exemple des territoires « Xynthia ». Norois, 222(1), 11–26.
- Vinet, F., Lumbroso, D., Defossez, S., & Boissier, L. (2012b). A comparative analysis of the loss of life during two recent floods in France: the sea surge caused by the storm Xynthia and the flash flood in Var. Natural Hazards, 61(3), 1179–1201. doi:10.1007/s11069-011-9975-5