
ABSTRACT
Multiple maps at a scale of 1:51,500, portraying the trail-related features of 43.4 km of recreational trails located in a mountainous area of the Poprad Landscape Park (south-central Poland), were produced. More specifically, the maps presented the spatial pattern of trail impacts (i.e. trail width; trail incision; the number of informal trails; old, abandoned trail sections; a presence of muddy sections and water puddles), as well as use-related (type and amount of use), environmental (vegetation type, density of forest floor/grassland and understorey layer along trails, aspect, and trail topographic position), and managerial (trail surface, grade, and alignment) factors. For the most part, the information was collected during field surveys using the Global Positioning System and Geographic Information System (GIS), but in a minority of cases it was calculated within the GIS-environment based on a digital elevation model. Collecting accurate data on condition of trails and elements that influenced their state is crucial for managers in protected natural areas who face the challenges of protecting nature and providing recreational opportunities at the same time.
1. Introduction
Many protected natural areas are managed in order to deliver two main ecosystem services: (1) sustain biodiversity by nature/landscape conservation (supporting services) and (2) provide recreational opportunities (cultural services). Recreational trails facilitate the achievement of these two goals, as they provide access to spatially distributed tourist attractions and simultaneously limit their use to specific places (CitationCole, 1993). Consequently, visitors are kept away from sensitive and vulnerable areas. On the other hand, traffic being confined to the routes may lead to a variety of negative ecological impacts, which commonly include trampling and plant communities’ compositional changes, trail widening, developments of informal (i.e. visitor-created) trails, soil erosion, and muddiness (CitationHill & Pickering, 2006; CitationMarion & Leung, 2001; CitationMarion, Roggenbuck, & Manning, 1993; CitationÓlafsdóttir & Runnström, 2013; CitationÖzcan, Gökbulak, & Hizal, 2013; CitationTomczyk, 2011). Factors that contribute to these problems are the following (CitationHammitt & Cole, 1998; CitationHammitt, Cole, & Monz, 2015; CitationLeung & Marion, 1996 Citation, 2000; CitationOlive & Marion, 2009): (1) use-related factors – type of use (hiking, mountain biking, or horseback riding), amount of use, and visitor behaviour; (2) environmental factors – vegetation type and density, topography, soil type, and climate; and (3) managerial factors – these may modify to some extent both the above-mentioned groups through proper trail designing and maintenance. Scientific understanding of the relationship between trail impacts and other elements is basic to a more effective and sustained management of recreational trails (CitationCole, 1993; CitationFarrell & Marion, 2001; CitationLeung & Marion, 1996; CitationMarion & Leung, 2001; CitationOlive & Marion, 2009).
The aim of this study is to develop maps of the Poprad Landscape Park's (PLP) recreational trails presenting trail impacts and use-related, environmental, and managerial factors that potentially influence these unintended negative effects.
CitationLeung and Marion (1996) link degradation of recreational trails with the increase in their width and incision (i.e. soil loss and compaction). We approached trail degradation from the same perspective, extending it to include the presence of muddy sections, number of informal (i.e. visitor-created) trail treads, and occurrence of abandoned trail sections. Geomorphic processes influencing trail degradation can be divided into natural (e.g. linear and sheet flow erosion, and activity of needle ice) and anthropogenic (e.g. hiking and biking treatments). Usually anthropogenic processes initiate degradation and enhance natural processes.
We produced a series of maps at a scale of 1:51,500 which include the spatial pattern of trail width and incision, number of informal (visitor-created) trails, number of old abandoned trail sections, presence of muddiness and water puddles, type and amount of use, vegetation type, density of forest floor/grassland along trails, density of understorey layer along trails, aspect, trail topographic position, as well as trail surface, trail grade, and trail alignment.
2. Methods
2.1 Study area
The study area for this research was the PLP, located in the south-central part of Poland (). It is one of the largest landscape parks in the country, comprising an area of 544 km2 (CitationCentral Statistical Office, 2014). The PLP was established in 1987 for the comprehensive protection of mountainous landscapes, cultural heritage, spa, and tourist resources. Forest is the main type of land cover in the PLP (70%). Forestry is managed mainly by the State Forests National Forest Holding, even though 20% of the PLP is privately owned (CitationStaszkiewicz, 2000). Apart from the forest, the park also includes an area of cultivated lands and villages.
Figure 1. Location of the PLP, Poland (Reprinted Applied Geography, 31, A.M. Tomczyk, Copyright (Citation2011), with permission from Elsevier).
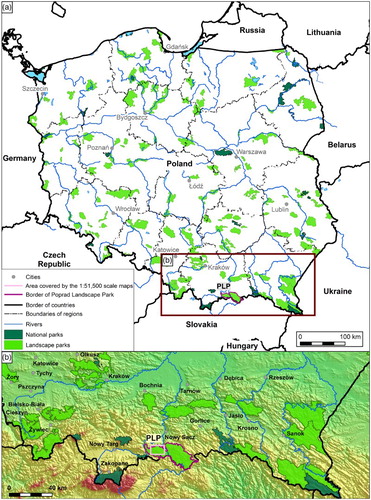
The fieldwork was conducted in the western part of the PLP, covering the wide and vast Radziejowa Range (1267 m a.s.l.), which is the largest and densest area of woodland in the PLP (CitationStaszkiewicz, 2000). The Radziejowa Range is cut through by a dense network of deep river valleys (up to 500–600 m deep) from the north and south (CitationMargielewski, 2000). It is composed of the Carpathian flysch, particularly thick sandstone strata. The soils are mainly autogenic, with eutric cambisols as the dominant unit and district cambisols as the associated one (CitationMaciaszek, 2000). The mean annual precipitation is between 800 mm in the valleys of Dunajec and Poprad and 1100 mm in parts of the Radziejowa peak. The maximum daily rainfall occurs during the summer months (June and July), while the minimum occurs in March, September, and October. The average duration of snow cover varies with altitude a.s.l. between 63 and 154 days (CitationBrzeźniak & Czemerda, 2000). The general pattern of vegetation varies with elevation. The lower montane zone includes an area from 550–600 m a.s.l. to 1080–1100 m a.s.l., and is composed of Carpathian beech forest Dentario glandulosae-Fagetum, acidophilous beech forest Luzulo nemorosae-Fagetum, and fir-spruce forest Abieti-Piceetum. The upper montane zone (from 1050 to 1100 m a.s.l.) is covered with spruce forest Plagiothecio Piceetum (CitationStaszkiewicz, 2000).
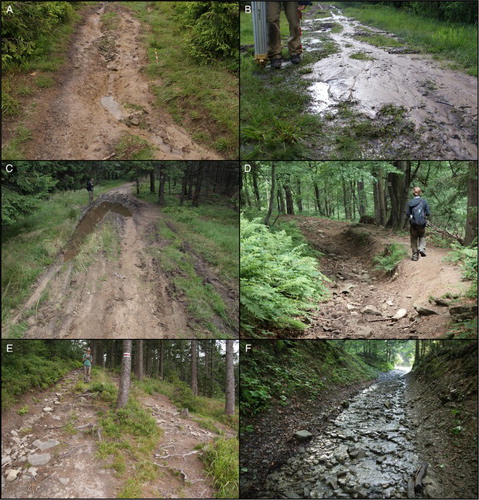
The Radziejowa Range contains recreational trails that are used mainly by hikers and sometimes by mountain bikers. Some trails are also used as forestry roads for four-wheel vehicle traffic. According to an electronic visitor count, recreational trails in the Radziejowa Range received more than 48,000 visitors in 2013, most of whom visited the Park during the summer months of July and August (unpublished report about visitor numbers received from the PLP directorate). The maximum daily number of visitors was 1563 (8 September 2013). Although the PLP in the Radziejowa Range obtained relatively low visitor numbers, trail impacts were substantial (). CitationTomczyk and Ewertowski (2013) surveyed soil erosion in the PLP (Radziejowa Range) and found that the average value for the deepening of 15 cross sections installed on recreational trails was 0.025 m between August 2008 and August 2010. However, the local largest deepening of trail surface was up to 0.174 m during this time period. Moreover, the amount of soil loss at recreational trails could reach as much as 0.037 m3 m−2 per two-year period, which corresponded to an average-sized wheelbarrow with half-full load of soil removed from each square metre. Additionally, they noted that trail width increased in some places to 0.5 m during a two-year period (CitationTomczyk and Ewertowski, 2013). Consequently, the documentation of conditions of trails and elements influencing their state (as shown in this article) will support park managers towards the more effective trail management actions in order to minimise or avoid trail impacts and by consequence provide better recreational opportunities for visitors.
Figure 2. Examples of trail degradation, the PLP: A – erosional rill along the trail tread; B – deposition of material due to improper trail drainage; C – muddy section and water puddle; D – erosional gully with exposed rocks. Due to uncomfortable and even dangerous walking condition, visitors created an informal path next to the designated trail; E – exposed roots and rocks on the too-steep section of the trail, forcing visitors to trample trail sides, thereby creating informal trails; F – deep erosional gully reaching bedrock.
2.2 Collecting field data and database creation
Field surveys at the Radziejowa Range in the PLP have been conducted during several field trips in 2008 and 2009. The measurements of recreational trails were taken at each point wherein change in the trail width exceeded 0.1 m. In total, we examined 43.4 km of recreational trails which were divided into 2190 sections (the mean segment length was 20 m). At each sampling section, 11 elements were surveyed in the field (we took into consideration elements which have been often analysed in the literature, cf. CitationHammitt & Cole, 1998; CitationLeung & Marion, 1996; CitationLeung & Marion, 2000; CitationOlive & Marion, 2009): (1) trail width, (2) trail incision, (3) number of informal (visitor-created) trails, (4) number of old abandoned trail sections, (5) presence of muddy sections and water puddles, (6) type of use, (7) amount of use, (8) vegetation type, (9) density of forest floor/grassland along trails, (10) density of understorey layer along trails, and (11) trail surface (, ). Trail width and incision were measured with a laser rangefinder. A tablet connected to a Global Positioning System receiver was employed to locate the sections accurately, collect trail features, and write the information directly into a Geographic Information System (GIS) database in the field. As a result, the attribute information together with the geographical coordinates was saved in a shapefile using the ESRI ArcPad software, already in the field. Each trail was represented by a polyline that was divided into small sections. The shapefile was transferred from the ArcPad tool to a GIS desktop environment. Afterwards, a digital elevation model (DEM) with a 5-m horizontal resolution was generated based on the topographic maps 1:10,000 PUWG 1965. The DEM was used to calculate additional data such as: (1) slope aspect, (2) trail topographic position, (3) elevation above sea level, (4) trail grade, and (5) trail alignment (). Values from the cartographic sources were extracted within the GIS-environment for each of the sampling sections based on their spatial location. Finally, information about the type and amount of use, provided by an electronic visitor counting system and experienced park staff and validated during the field surveys, was linked to the recreational trails. The entire database comprised 16 trail-related features and covered 43.4 km of recreational trails, that is, all recreational trails in a forest area of the Radziejowa Range, for which casual motorised use is not allowed.
Figure 3. Photographs of selected attributes mapped during the field surveys in the PLP.
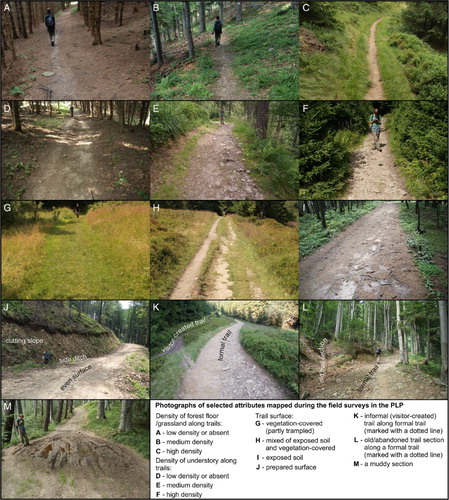
Table 1. Outline of trail-related features with the value of attributes for recreational trails in the PLP.
2.3 Map creation
Multiple maps portraying different features of the recreational trails in the PLP were produced at a scale of 1:51,500. We implemented a uniform map layout to create the maps for all (16) trail-related features. First of all, each map contains a network of the recreational trails. Furthermore, basic information about the border of the park, the setting of a mountain hostel, and the location/names of selected summits was indicated as landmarks.
The indicators of trail degradation and use-related factors were presented in the same way to those prepared by CitationTomczyk and Ewertowski (2011) for the Gorce National Park. It means that we used the same classes for studied features, for example, trail incision: <=0.10, 0.11–0.30, 0.31–0.50, 0.51–1.00, >1.00; amount of use: low, medium, large, very large, etc. Variables such as plant communities, geology, and soil types were adapted to local conditions in the PLP. A DEM (Main Map 1) was presented in continuous colour scale. Trail width (Main Map 2) and maximum trail incision (Main Map 3) were divided into seven classes (<= 0.6 m; 0.61–1.0 m; 1.1–2.0 m; 2.1–3.0 m; 3.1–4.0 m; 4.1–5.0 m; and > 5.0 m) and five classes (<= 0.1 m; 0.11–0.3 m; 0.31–0.5 m; 0.51–1.0 m; and > 1.0 m), respectively. The number of informal (visitor-created) trails (Main Map 4) and old/abandoned trails (Main Map 5) that appeared along the formal trails were split up into two groups: ‘one trail’ and ‘two and more trails’. Insufficient tread drainage of recreational trails indicates the presence of muddiness and water puddles whose length exceeded 0.5 m or whose width was more than 50% of the trail width (Main Map 6). Use type (Main Map 7) was categorised into: (1) hiking, (2) hiking and biking, (3) hiking and motorised use, and (4) hiking, biking, and motorised use. The amount of use (Main Map 8) was divided into the following categorical data: small, medium, large, or very large use-levels. It was done based on a combination of available information from electronic visitor count, knowledgeable park staff, and our field-based observations. Such approach followed the one used by CitationOlive and Marion (2009) and CitationWimpey and Marion (2010). It did not allow us to attach a specific number of visitors to a specific level of trail degradation, but it enabled to compare impacts for trails with the same amount of use. Vegetation type (Main Map 9) was divided into two basic groups: forest and glade. Density of vegetation cover at a forest floor/grassland (Main Map 10) and at an understorey layer (Main Map 11) was categorically assigned as a percentage of vegetation cover: (1) low density or absent (vegetation cover <30%), (2) medium density (vegetation cover 30–60%), and (3) high density (vegetation cover > 60%). Aspect, that is the prevailing landform slope of recreational trails (Main Map 12), was categorised into northerly, easterly, southerly, and westerly. Recreational trails’ position in relation to the local topography (Main Map 13) was determined as valley-bottom, mid-slope, or ridge-top. The surface of trails (Main Map 14) was classified into four types: (1) vegetation covered (partly trampled), (2) mixture of exposed soil and vegetation covered, (3) exposed soil, and (4) prepared surface (e.g. introduced tread drainage features). Recreational trail grade (Main Map 15) was divided into six classes: <=1.50°, 1.51–5.00°, 5.01–10.00°, 10.01–15.00°, 15.01–20.00°, and >20.00°. Finally, recreational trail slope alignment angle (Main Map 16) was split up into four groups: 0–22.0°, 22.1–45.0°, 45.1–68.0°, and 68.1–90.0°.
3. Results
3.1 Trail conditions (Main Maps 2–6, Table 2)
The width ranged from 0.3 to 25 m, with a mean of 2.1 m (Main Map 2). Almost 85% of the trails’ length had a width of less than 3 m. The narrowest trails (of no more than 0.6 m) represented only about 11% of the trails’ length (4.6 km). On the other hand, the widest trails (over 5 m) constituted 1.5% of the length of all analysed trails (0.6 km). The problem occurred on walking trails as well as on motorised roads. Total area subjected to direct human pressure along 43.3 km of recreational trails encompassed 92,600 m2, of which 91,300 m2 was exposed soil. Hence, the potential for enhanced soil erosion is serious, which is confirmed by the indicator of soil loss; that is, trail incision ranged from 0 to 4 m (Main Map 3). Incision greater than 0.1 m occurred at 44% of the trails’ length (19 km). Trails eroded to a depth of 0.1–0.5 m occurred in about 24%, and treads with 0.5–1.0 m incision affected 11% of the trails’ length. Moreover, the deepest incision (over 1 m, reaching a maximum of 4 m) was recorded along 4 km in total (9% of the trails’ length).
Table 2. Outcomes of trail-related features for recreational trails in the PLP.
The presence of the unofficial (i.e. informal, visitor-created) trails along the formal ones took place along a distance of less than 2 km (< 5% of the entire trail network) (Main Map 4). Such trails were created by visitors, mainly for avoiding muddy sections, cutting switchbacks, and accessing attraction features (e.g. viewpoints). The problem concerning almost all recreational trails, however, was restricted to a relatively small number of sections (145 sections, with a mean section length of 13 m). The maximum number of informal trails branching from the formal ones was eight, although this situation only occurred along 250 m in total.
Fragments of old abandoned trails were also recorded (Main Map 5). They were observed along 2.8 km of trails (6.4% of the trails’ length). Usually, there was only one (almost 6% of the trails’ length), but there were sections along which even four parallel abandoned trails were recorded. Some of them had incision values of more than 1 m.
Muddiness on trails was recorded 110 times along 1.4 km in total (3.2% of the trails’ length) (Main Map 6). The mean length of each muddy or water puddle section was 12.6 m. However, in 31 cases, the segments had between 10 and 20 m, and in 20 cases – more than 20 m, reaching almost up to 105 m.
3.2 Recreation on the trails (Main Maps 7 and 8, Table 2)
Hiking was the most common type of activity in the park (Main Map 7). Forty-four percent of the trails’ length (19 km) was available for walkers only. Hiking and biking trails constituted 13% of the trails’ length (5.7 km). There were quite a large percentage of trails which were routed along roads, mainly related to forestry (nearly 43% of the trails’ length or 18.5 km).
Almost 58% of the trails’ length was characterised by a large or very large level of use in relation to the total amount of visitor use in the Radziejowa Range (Main Map 8). The trail from Wielki Rogacz through Radziejowa to the mountain hostel was the most popular among tourists.
3.3 Environmental attributes of the trail system (Main Maps 9–13, Table 2)
Most recreational trails (approximately 87% of the trails’ length) were routed through a forest area (Main Map 9). The rest of the trails crossed open meadows/glades. Along a quarter of the entire trails’ length, the density of forest floor/grassland was minimal or absent (Main Map 10). Moreover, the trailside dense understorey layer (vegetation cover above 60%) was limited to 4.3 km in total (10% of the trails’ length) (Main Map 11).
The recreational trails were positioned mainly on slopes with western aspects (not quite 30% of the trails’ length) (Main Map 12). This was followed by trails with northern prevailing landform slopes (almost 25% of the entire trail network), and then with easterly and southerly aspects (about 23% for each of them).
According to the distribution of the trails in relation to the topographic positions, trails with ridge (46%) and mid-slope (45%) location dominated (Main Map 13). Trails located in valleys were limited to less than 10% of the trails’ length.
3.4 Managerial attributes of the trail system (Main Maps 14–16, Table 2)
All studied recreational trails had unhardened treads. Exposed soil dominated along nearly 88% of the trails’ length. In addition, 9.4% of the trails’ length was covered with partly trampled vegetation or a mixture of exposed soil and vegetation (Main Map 14). More than half of the trails’ length was characterised by treads with rock or gravel content. Plant roots occurred along 0.2% of the trails’ length. Among tread drainage features, there were ditches routing surface water along 2.3 km (5% of the trails’ length) and water bars in very small numbers.
Trail grade ranged from 0° to 35°; however, about 93% of the trails’ length had a grade up to 15° (Main Map 15). An examination of the frequency distribution revealed that 23% of the trails’ length was nearly flat (up to 1.5°). Additionally, 12% of the trails’ length (5 km) was characterised by grades of up to 1.5° and a valley bottom setting. Grades ranging from 5° to 20° were documented along approximately 47% of the trails’ length, while the highest grades (above 20°) concerned more than 2% of the trails’ length (0.9 km).
Around 16% of the trails’ length (7 km) was aligned parallel or almost parallel (up to 22°) to the prevailing slope (Main Map 16). On the other hand, 42% of the trails’ length was aligned along (or close to) the contour (above 68°). Side-hilly alignments were related to about 42% of the trails’ length.
4. Conclusions
This research has exposed a substantial level of degradation in the recreational trails inside the PLP, which is demonstrated by a series of maps presenting the spatial pattern of indicators of trail impacts such as trail width, trail incision, muddy sections, informal trails, and the occurrence of abandoned sections (see Main Maps 2–6 and ). Soil erosion was the most serious trail impact, as treads eroded to a depth of over 0.5 m occurred along more than one-fifth of the trails’ length (about 9 km). Moreover, incision in some sections reached 4 m. Deeply eroded trails were in several cases abandoned and new trails parallel to older ones were created. Also of particular note were problems with trail widening, as 16% of the trails’ length (almost 7 km) was wider than 3 m. Additionally, according to CitationTomczyk and Ewertowski (2013), the width of the trails had in some places increased to 0.5 m during a two-year period. Detailed statistical investigations over the influence of several use-related, environmental, and managerial factors on recreational trails will be presented elsewhere. An improved understanding of the problem may lead to more effective trail management actions, thereby providing suggestions on how the area can be managed to achieve a balance between recreational and supporting ecosystem services.
The presented data can already be a helpful source of information for park managers (cf. CitationTomczyk & Ewertowski, 2011). However, there are a few limitations. We were unable to accurately ascertain the number of visitors for each trail. As a result, the amount of use was assigned qualitatively (small, medium, large, and very large) for each trail, based on a wide range of available information (electronic visitor count, knowledgeable park staff, and field observations). This was determined in a way similar to CitationOlive and Marion (2009) and CitationWimpey and Marion (2010). The approach does not, therefore, allow for relating a specific number of visitors to a specific level of trail degradation. On the other hand, it allows for comparing conditions for trails with the same amount of use. Additionally, there was a lack of information about soil type and plant communities, as these data were not available. As to the latter, however, the data about land cover (forest or glade) were provided instead. Such an approach was sufficient in the case of recreational trails in the Radziejowa Range as most trails were routed in the lower montane zone.
Software
ESRI ArcPad 7.0 was used for data collection during the field surveys. Conversion to polylines, dividing into sections, and integration with non-field data were performed within Microimages TNTmips 2011. The maps were prepared in ESRI ArcGIS 10.2.1 for Desktop. The final layout of the map was made in CorelDraw 16.
Recreational trails in the Poprad Landscape Park, Poland: the spatial pattern of trail impacts and use-related, environmental and managerial factors
Download PDF (14.7 MB)Acknowledgements
We would like to extend our special thanks to the staff of the PLP for their help. We are grateful to Margaret O'Donnell for proofreading the manuscript. Reviewers R. Ólafsdóttir and C.P.J.M. van Elzakker provided valuable comments and suggestions which improved the quality and clarity of the manuscript and maps.
Disclosure statement
No potential conflict of interest was reported by the authors.
ORCID
Aleksandra M. Tomczyk http://orcid.org/0000-0002-5400-7131
Marek W. Ewertowski http://orcid.org/0000-0002-0422-2327
Additional information
Funding
Related Research Data
References
- Brzeźniak, E., & Czemerda, A. (2000). Klimat. In J. Staszkiewicz (Ed.), Przyroda Popradzkiego Parku Krajobrazowego (pp. 37–46). Stary Sącz: PPK.
- Central Statistical Office. (2014). Environment 2014: Statistical information and elaborations. Warsaw: Central Statistical Office.
- Cole, D. N. (1993). Minimizing conflict between recreation and nature conservation. Ecology of greenways: design and function of linear conservation areas. University of Minnesota Press, Minneapolis, Minnesota, USA, 105–122.
- Farrell, T. A., & Marion, J. L. (2001). Trail impacts and trail impact management related to visitation at Torres del Paine national park, Chile. Leisure/Loisir, 26(1–2), 31–59. doi:10.1080/14927713.2001.9649928
- Hammitt, W. E., & Cole, D. N. (1998). Wildland recreation: Ecology and management (2nd ed.). New York: John Wiley & Sons.
- Hammitt, W. E., Cole, D. N., & Monz, C. A. (2015). Wildland recreation: Ecology and management (3rd ed.). West Sussex: Wiley-Blackwell.
- Hill, W., & Pickering, C. M. (2006). Vegetation associated with different walking track types in the Kosciuszko alpine area, Australia. Journal of Environmental Management, 78(1), 24–34. doi:10.1016/j.jenvman.2005.04.007
- Leung, Y.-F., & Marion, J. L. (1996). Trail degradation as influenced by environmental factors: A state-of-the-knowledge review. Journal of Soil and Water Conservation, 51(2), 130–136.
- Leung, Y.-F., & Marion, J. L. (2000). Recreation impacts and management in wilderness: A state-of-knowledge review. In D. N. Cole, S. McCool, W. T. Borrie & J. O'Loughlin (Eds.), Wilderness science in a time of change: Vol. 5 Wilderness ecosystems, threats, and management (pp. 23–48). Ogden, UT: USDA Forest Service, Rocky Mountain Research Station.
- Maciaszek, W. (2000). Gleby. In J. Staszkiewicz (Ed.), Przyroda Popradzkiego Parku Krajobrazowego (pp. 47–56). Stary Sącz: PPK.
- Margielewski, W. (2000). Budowa geologiczna. In J. Staszkiewicz (Ed.), Przyroda Popradzkiego Parku Krajobrazowego (pp. 27–35). Stary Sącz: PPK.
- Marion, J. L., & Leung, Y.-F. (2001). Trail resource impacts and an examination of alternative assessment techniques. Journal of Park and Recreation Administration, 19(3), 17–37.
- Marion, J. L., & Olive, N. (2006). Assessing and understanding trail degradation: Results from big south fork National River and recreational area United States Department of the Interior, National Park Service, Final Research Report, Patuxent Wildlife Research Cente.
- Marion, J. L., Roggenbuck, J. W., & Manning, R. E. (1993). Problems and practices in backcountry recreation management: A survey of National Park service managers. US Department of the Interior, National Park Service, Natural Resources Publication Office.
- Ólafsdóttir, R., & Runnström, M. C. (2013). Assessing hiking trails condition in two popular tourist destinations in the Icelandic highlands. Journal of Outdoor Recreation and Tourism, 3-4, 57–67. doi:10.1016/j.jort.2013.09.004
- Olive, N. D., & Marion, J. L. (2009). The influence of use-related, environmental, and managerial factors on soil loss from recreational trails. Journal of Environmental Management, 90(3), 1483–1493. doi:10.1016/j.jenvman.2008.10.004
- Özcan, M., Gökbulak, F., & Hizal, A. (2013). Exclosure effects on recovery of selected soil properties in a mixed broadleaf forest recreation site. Land Degradation & Development, 24(3), 266–276. doi:10.1002/ldr.1123
- Staszkiewicz, J. (2000). Historia oraz pionowe i poziome zróżnicowanie roślinności. In J. Staszkiewicz (Ed.), Przyroda Popradzkiego Parku Krajobrazowego (pp. 129–135). Stary Sącz: PPK.
- Tomczyk, A. M. (2011). A GIS assessment and modelling of environmental sensitivity of recreational trails: The case of Gorce National Park, Poland. Applied Geography, 31(1), 339–351. doi:10.1016/j.apgeog.2010.07.006
- Tomczyk, A. M., & Ewertowski, M. (2011). Degradation of recreational trails, Gorce National Park, Poland. Journal of Maps, 7(1), 507–518. doi:10.4113/jom.2011.1195
- Tomczyk, A. M., & Ewertowski, M. (2013). Quantifying short-term surface changes on recreational trails: The use of topographic surveys and ‘digital elevation models of differences’ (DODs). Geomorphology, 183, 58–72. doi:10.1016/j.geomorph.2012.08.005
- Wimpey, J. F., & Marion, J. L. (2010). The influence of use, environmental and managerial factors on the width of recreational trails. Journal of Environmental Management, 91(10), 2028–2037. doi:10.1016/j.jenvman.2010.05.017