
ABSTRACT
This work presents the first results of an integrated geomorphological analysis of a large earthflow in Montebello sul Sangro (Abruzzo, Central Italy). The study is based on a multitemporal geomorphological investigation supported by the morphometric analysis of the drainage network and numerical landslide modelling. The multitemporal geomorphological investigation, based on the interpretation of aerial photos, LiDAR data and field geomorphological mapping, outlined the recent geomorphological history and multiple activation phases of the landslides. A 2D Finite Difference Method (FLAC, Fast Lagrangian Analysis of Continua) analysis of the main landslide scarp, affecting the village of Montebello sul Sangro (Italy), was performed. Finally, in order to outline the morphometric features of the landslide area, local slope autocorrelation was used as a morphometric index. The analysis was aimed at studying the evolution of the active current landslide and specifically the possible retreat of the main scarp.
1. Introduction
An integrated geomorphological analysis of a large earthflow in Montebello sul Sangro (Abruzzo, Central Italy) is currently in progress. The analysis incorporates >60-year multitemporal geomorphological mapping, numerical landslide modelling, and a new morphometric analysis of the drainage network.
Multitemporal geomorphological mapping is a common and fundamental tool for the analysis of the recent evolution of landscapes and specifically landslides. It is particularly important for the comprehension and unravelling of the time development of landslides, particularly in the case of large complex ones. Multitemporal investigations allow for the analysis of multiple activation, mechanisms, and evolution of the landslides. Moreover, from recent evolution it is possible to outline possible future landslide scenarios and to contribute to hazard assessment. This investigation is based on the interpretation of 1954, 1975, and 2009 aerial photos provided by the Abruzzo Region, the analysis of LiDAR data acquired in January 2014 specifically for this project, and on a field geomorphological survey carried out after the LiDAR acquisition, in spring 2014. The analysis, also using historical documents (reported in CitationAlmagià, 1910; CitationColapietro, 1822; CitationD'Alessandro, Genevois, & Prestininzi, 1979), outlined the multiple activation phases of the landslides.
The use of numerical modelling to analyse slope stability, such as Fast Lagrangian Analysis of Continua (FLAC) (CitationAringoli, Calista, Gentili, Pambianchi, & Sciarra, 2008; CitationCalista, Pasculli, & Sciarra, 2015), supported the analysis of the possible causes and triggering factors of the landslides, including not only heavy rainfall occurrence, but also earthquakes.
The drainage network is the result of many physical phenomena and shows a complex interaction with landslides, that could be studied using a computational fluid dynamics. This approach is based on the principles of conservation, supplemented by closure laws that define, for example, erosion and deposition (e.g. CitationPasculli, 2008; CitationPasculli & Sciarra, 2006). The numerical discretization of the actual physical domain is performed by mesh tessellation or a mesh-less approach such as, for example, smoothed particle hydrodynamics (CitationMonaghan, 2005) which is particularly effective at simulating floods and earthflows (CitationAudisio, Pasculli, & Sciarra, 2015; CitationMinatti & Pasculli, 2010, Citation2011; CitationPasculli & Audisio, 2015; CitationPasculli, Minatti, Audisio, & Sciarra, 2014; CitationPasculli, Minatti, Sciarra, & Paris, 2013).
This integrated analysis allowed for a comprehensive description of the geomorphological features of the large earthflow–complex landslide of Montebello sul Sangro, the definition of the recent geomorphological evolution, and the outlining of possible future scenarios, applying also computer codes.
2. Study area
2.1. Geological setting
The Montebello sul Sangro area is located in the transition zone between the central Apennines chain front (Maiella Mts) and the Adriatic coast, within the River Sangro basin, in the south-eastern Abruzzo area, at the boundary with the Molise region (Central Italy; upper left part on the map).
The Central Apennines are an asymmetric mountain range characterized by alternating ridges (up to 2900 m high; Gran Sasso, 2912 m; Maiella, 2793 m), made up of Mesozoic–Cenozoic marly-calcareous sequences, and valleys with a NW–SE to N–S orientation, mostly carved on Neogene pelitic–arenaceous rocks, as well as by wide intermontane basins, filled up by clastic Quaternary continental deposits (i.e. Fucino Plain, Sulmona Basin; CitationPiacentini & Miccadei, 2014). They are a thrust belt migrated north-east, which formed during the Neogene (CitationPatacca & Scandone, 2007). Since the Late Pliocene the Apennines have been affected by differential uplift and extensional tectonics, with the emergence of the Apennines piedmont and Adriatic area and the formation of intermontane basins (CitationAscione, Cinque, Miccadei, Villani, & Berti, 2008; CitationMiccadei, Mascioli, & Piacentini, 2011; CitationPiacentini & Miccadei, 2014). The study area is located in the south-eastern sector, pertaining to the Abruzzo-Molise boundary Apennines. Here, the morphostructural setting outlines systems of narrow and steep ridges trending N–S and NW–SE (up to 1000–1800 m.a.s.l.), which developed on thin Neogene calcareous sequences, surrounded by gentle undulating slopes on Cenozoic clayey sequences, on which the Montebello landslide has developed, passively controlled by the structural-lithological setting (CitationClermonté’, 1977; CitationDi Bucci, Corrado, Naso, Parotto, & Praturlon, 1999; CitationServizio Geologico D’Italia, 1970, Citation1971).
An abrupt morphologic boundary separates the chain area from the Adriatic piedmont, which shows cuestas, mesas, and plateaux landscapes, developed on Pliocene–Pleistocene clay, sand, and conglomerate sequences, that slope down from approximately 1000 m.a.s.l. along the chain front (Maiella massif) to 100 m from the coast. Here, the main rivers flow along wide floodplains, generally in a SW–NE direction, and a sequence of post-orogenic Quaternary continental deposits cover bedrock lithologies, mainly consisting of slope, alluvial fan, and fluvial deposits arranged in a series of terraces. The piedmont ends with a cliffed coast broken by the wide alluvial valleys of the main rivers (such as the Sangro river) and by the small and sharp valleys of the minor rivers.
The landslide area is located in the south-eastern sector of the Abruzzi Apennines, within the San Leo Stream, a tributary of the middle Sangro River, one of the main rivers in the Adriatic side of Central Italy. The San Leo basin slopes down from SW to NE (900 m to 200 m.a.s.l.) and lies in a complex geological and geomorphological framework between the chain front and the piedmont area, characterized mostly by fault thrust ridges, isolated relief, and hogback and cuesta landforms.
2.2. The Montebello sul Sangro landslide
The Montebello sul Sangro landslide is located on the left side of the middle Sangro River valley, affecting a narrow faulted anticline ridge, more than 900 m.a.s.l. high, trending N–S. The bedrock is formed by Oligocene and Miocene rocks pertaining to the Molise units. From west to east: clays (‘Argille varicolori’ Auctt.), alternating marly-calcareous, calcarenite, and calcirudite rocks (Tufillo formation, Auctt.), and pelitic and arenaceous–pelitic successions (Flysch of Agnone formation, Auctt.). The structural setting is characterized by an east overturned faulted anticline trending from N–S to NNW–SSE. It is cut by minor NNW–SSE and SW–NE trending faults. At the surface, the calcareous units are from 30° to 40°E (western side of the ridge) up to 70°E (eastern side) dipping. In the northern part, calcareous units are overturned (dip 30°–40°W) and overlap the pelitic and arenaceous–pelitic units.
The present geomorphological features outline a strongly asymmetric hogback ridge, with a more gentle eastern slope and a steeper western one, resulting from the erosion of the anticline flank. Northwards the ridge is deeply incised and separated by a second hogback ridge, on which the Pennadomo village is located. A wide and complex landslide involves the western side of the Montebello hogback, passes the narrow incision between the two ridges, and spreads out on the eastern side. The new Montebello village was rebuilt after landslide events (in 1864, 1898, and 1899) due to the regressive evolution of the wide landslide that involved the old Buonanotte village (CitationAlmagià, 1910) ((a) and (b)).
Figure 1. Panoramic view of the Buonanotte village hogback ridge and of the Montebello sul Sangro landslide. (a) Upper part and landslide scarp; in the background, the Montebello ridge; (b) lower part and landslide body; in the background, the Bomba Lake.
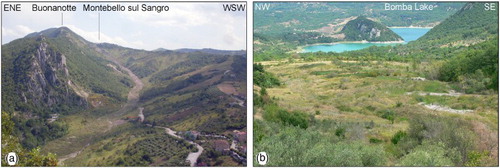
The scarp area involves the steep western calcareous slope of the ridge down to the gentle lower slope on clay units ((a)–(c)). The mass flows down along a narrow channel ((d)) and then spreads out in a wide accumulation lobe, with depressions and undulations, down to the Bomba Lake ((b)). Thrust features in the accumulation area point out to at least two overlapped flows, suggesting an intermittent movement. The regressive enlargement of the landslide scarp involves the calcareous ridge, inducing systems of tension fractures and reverse slopes areas ((a)), and the clayey slope covered by the debris slope deposits affecting the Montebello village ((b)).
Figure 2. Montebello sul Sangro landslide features: (a) landslide scarp on the calcareous ridge; (b) landslide scarp on the clayey slope covered by scree slope deposits; (c) minor landslide on the western flank of the main landslide on clay units; (d) main earthflow.
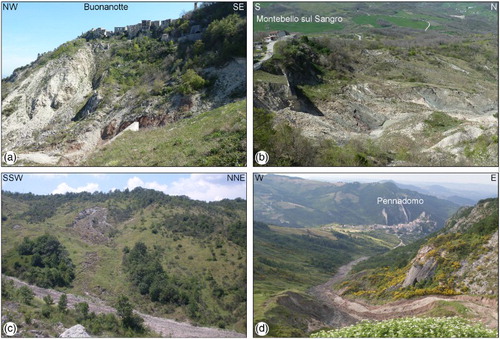
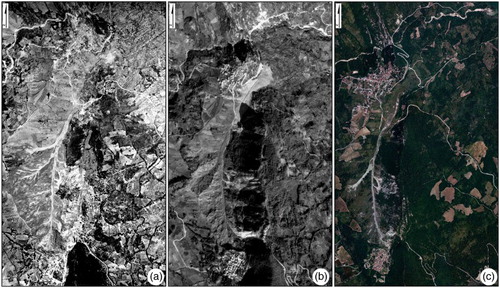
Figure 3. Aerial photos of the Montebello sul Sangro landslide: (a) 1:33,000 scale aerial photos (CitationIGMI, 1954); (b) 1:33,000 scale aerial photos (CasMez, CitationAbruzzo Region, 1974); (c) 1:5000 scale aerial photos and orthophotos (CitationAbruzzo Region, 2009).
According to the geological and geomorphological features, the mass movement is classified as a complex landslide, a combination of rotational slide movements in the upper part and earthflows in the middle and lower part (CitationAbruzzo-Sangro Basin Authority, 2005; CitationD'Alessandro et al., 1979; CitationIFFI project, 2007), controlled by the geological and morphostructural setting of the carbonate hogback and clay chaotic rocks (Argille varicolori). The geomorphological evolution of the western side of the relief is influenced by rock falls in the upper part of the ridge, due to fractures and jointing in the calcareous strata, while in the lower part it is influenced by the progressive involvement of the clay units in the landslide movement.
3. Methods
A detailed-scale geomorphological analysis allowed the production of large-scale multitemporal maps of the Montebello sul Sangro landslide (investigations at 1:5000, scale representation at 1:10,000), as well as landslide software modelling and the morphometric analysis of the drainage network.
From the 1:5000 scale vector map (Technical Numerical Map of CitationAbruzzo Region, 2007, from a 2002 photogrammetric survey), a digital elevation model (DEM; 5 m resolution) was extracted with LiDAR data (1 m resolution) provided for this study by the Laboratory for landslide monitoring of CitationCNR-IRPI (2014). The orographic and hydrographic analyses, as well as geomorphological mapping, were based on these data.
Multitemporal geomorphological mapping is based on air-photo and LiDAR interpretation compared to field mapping. Air-photo interpretation was performed on 1:33,000–1:20,000 scale aerial photos (flights CitationIGMI, 1954 and CitationAbruzzo Region, 1974), 1:5000 scale aerial photos, and orthophoto colour images (flight CitationAbruzzo Region, 2009), as well as 1 m resolution LiDAR data (CitationCNR-IRPI, 2014).
Geomorphological field mapping was carried out at 1:5000 scale, investigating the outcropping bedrock lithology and structure, the superficial deposits, and the different types of landforms (structural, slope, fluvial, anthropogenic), with special consideration for the landslide features. Field mapping was performed according to the guidelines of the Geological Survey of Italy (CitationISPRA, 2007; CitationSGN, 1994) and the CitationIFFI project (2007) and according to relevant geomorphological mapping literature and conventions (e.g. CitationCapelli, Miccadei, & Raffi, 1997; CitationChelli, Segadelli, Vescovi, & Tellini, 2015; CitationGNGFG, 1994; CitationGuerriero et al., 2013, Citation2014; CitationMiccadei, Orrù, Piacentini, Mascioli, & Puliga, 2012; CitationMiccadei, Piacentini, Dal Pozzo, La Corte, & Sciarra, 2013; CitationMiccadei, Piacentini, Gerbasi, & Daverio, 2012; CitationPiacentini, Sciarra, Miccadei, & Urbano, 2015; CitationSanto et al., 2014; CitationSmith, Paron, & Griffiths, 2011). Landslide mapping was carried out according to CitationWP/WLI (1993), which defines the concept of activity with reference to the originating causes. Landslides are mapped, depending on their activity, into four main categories: active, suspended, dormant, and inactive.
Landslide modelling was performed using FLAC software. This approach requires specific components to be introduced: the discretization mesh, the constitutive law with its mechanical parameters, the initial conditions and constraints on the boundaries. The discretization mesh is composed of four-sided elements modified so as to be close to the reference geological section; in our case, a four-sided mesh having a size of about 2 m was used (Figure A in Landslide Modelling section of the Main Map). Between the clay deposits and the scree slope deposits, a discontinuity characterized by the following properties was inserted: no cohesion, friction angle 10°, normal and shear stiffness 67 MPa, calculated according to the formula: Kn = Ks = (K + 4/3G)/Δzmin, where K and G are the bulk modulus and the shear strains modulus, respectively, while Δzmin represents the minimum length of the mesh along the discontinuity.
FLAC provides a great variety of model choices. In our case, we adopted the Mohr–Coulomb criterion: . Based on this criterion, the shear strength of the soil is a function of cohesion c′ and depends on the effective normal stress (
) through a friction coefficient
. According to this constitutive model, we assigned to each lithotype the physical and mechanical properties reported in .
Table 1. Physical and mechanical properties of soils.
A morphometric analysis of the drainage network also supports geomorphological mapping, outlining topographic anomalies induced by landslide processes. Different proposed numerical indexes are discussed in the literature, ranging from parameters describing the hierarchy of river networks due to basin evolution and erosion (CitationCiccacci, Fredi, Lupia Palmieri, & Pugliese, 1980; CitationDel Monte et al., 2014; CitationHorton, 1945; CitationStrahler, 1952) to, among many others, stream-length gradient (CitationLabella, Capolongo, Giannandrea, Giano, & Schiattarella, 2014; CitationTroiani & Della Seta, 2008; CitationTroiani, Galve, Piacentini, Della Seta, & Guerrero, 2014 and references therein), surface fractal dimensions (CitationDel Monte, Fredi, Lupia Palmieri, & Salvini, 1999; CitationPasculli & Sciarra, 2005) and wavelet tools (CitationDoglioni & Simeone, 2014 and references therein). Here the autocorrelation function (ACF) of the local slope values has been exploited in order to identify topographic anomalies. Accordingly, the drainage network was sampled in a matrix (from west to east, from north to south), with a selected resolution (25 m or 5 m), and converted into drainage points with UTM WGS84 coordinates, elevation, and slope data (hereafter Old Point Numbering: OPN). In this context, the ACF refers to the correlation of the local slope of a selected OPN with the local slope of all the other OPNs (CitationKaggwa, 2000). The analysis was performed for the whole San Leo basin (25 m resolution) and for some selected sub-basins (25 m resolution), including the Montebello landslide drainage area (5 and 25 m resolutions) (upper left on the map). For each point, its distance from all others was calculated introducing a new numbering of the points (NPN), according to the increasing values of their distances from the selected point. Then, for each selected area (area, s) with M representing the total number of points, the local slope correlation of each jth point (in OPN or NPN) with the slope at point k (in OPN or NPN) was determined through the following (CitationCliff & Ord, 1973) formula:(1)
In order to identify the correlation distance for the slope at each point, Bartlett's criterion was selected (CitationKaggwa, 2000). Then we considered the minimum value of the , with
as the index that identifies the correlation length (an example is provided in (a)).
4. Multitemporal geomorphological mapping
Multitemporal (1954–2014) geomorphological mapping, based on air-photo and LiDAR interpretation compared to field mapping, outlined a large complex–earthflow landslide in the western side of the Buonanotte hogback ridge. The landslide has an overall surface area of ∼1.1 km2, almost unchanged since 1954, while it is affected by strong variations in activity (lower part of the Main Map). This is particularly evident along the scarps and in the source area of the landslide, due to the activation of several small mass movements composing the large one. The analysis, also compared to historical documents and chronicles, shows multiple activations of the main earthflow in the lower part of the slope. The main events occurred in 1864, 1898, 1899, 1971 (CitationAlmagià, 1910; CitationD'Alessandro et al., 1979), with the last well documented by 1974 aerial photos. The eastern side of the ridge is conversely characterized by three separate earthflows or rotational landslides. Four geomorphological maps were produced; the 1954 and 1974 maps result from aerial photo interpretation, while the 2009 one from orthophoto analysis augmented by field survey, and mostly show geomorphological features, vegetation cover, and the general lithology; the 2014 map results from in-field surveys and shows more detailed geomorphological features and also lithology and tectonic features.
The 1954 analysis outlines, in the Montebello landslide area ((a) and Main Map on the left), the occurrence of several (59) earthflows (area from 25 to 18,346 m2), mostly defined as reactivations of the previous landslides, contributing to the main earthflow. With an overall surface of about 165,537 m2, the landslides partially reactivated the south-western part of the Montebello landslide area without affecting the landslide's toe. On the eastern side of the ridge, the rotational and earthflow landslides are dormant and suspended.
The 1974 analysis ((b) and Main Map on the centre-left), carried out after the large landslide event that occurred in 1971, shows the presence of two different areas affected by mass movements. The first area (336,295 m2) is within the south-western part of the Montebello landslide and is characterized by earthflows, but, unlike the 1954 one, the landslide's toe was partially involved in this case (about 680 m downslope of the 1954 landslide's front). In the second area (southernmost part), rock falls and complex landslides were mapped on a previous abandoned rotational landslide. The main landslide scarp has retreated, reaching the Buonanotte Village; the overall area is about 53,961 m2. On the eastern side of the ridge, the landslides are still dormant and suspended.
In the 2009 analysis (based on both field surveys and aerial photo analysis, (c) and Main Map on the centre-right), earthflows were mapped (199,298 m2) as reactivations of the previous landslides in the south-western sector. Rock falls and complex landslides were also recognized in the southernmost part. Landslide activation occurred during 2009 due to heavy and long precipitation. The landslide's toe was less involved in the reactivation process compared to the previous time interval (about 235 m upslope of the 1974 landslide's front). On the eastern side of the ridge, the rotational landslides show a partial reactivation. This map outlines a strong activation of the landslides in 2009 – following heavy precipitation in winter 2009 – which continued at least until 2014.
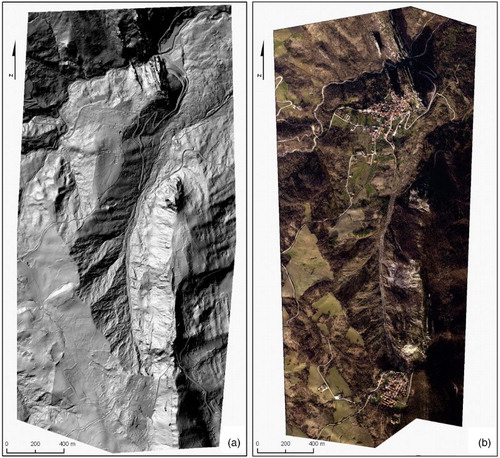
The analysis of the landslide in 2014 (, , and and Main Map on the right) results from the combination of field survey and photo-geological analysis(LiDAR, CNR-IRPI, Citation2014). Both large landslides (mostly dormant and/or abandoned) and small landslides (generally more recent and active) were mapped. The main earthflow has been mapped over a surface area of about 1,117,011 m2 and with an average slope of 18°, extending from 802 m.a.s.l., below the Buonanotte Village, to the San Leo River, 317 m.a.s.l. The most evident reactivations are movements that occurred in winter and spring 2013–2014, again following long and heavy precipitation. The activity of this movement is demonstrated by a range of surface expressions such as irregular mounds, landslip troughs, and several tension fractures that opened both longitudinally and transversely to the main landslide. The total reactivated landslide area is 239,662 m2. Reactivations also occur in the earthflows on the eastern side of the Buonanotte ridge.
Figure 4. LiDAR of the Montebello sul Sangro landslide acquired in January 2014 (1 m resolution) specifically for this project (by CNR-IRPI): (a) shaded relief image; (b) orthophoto.
5. Landslide modelling
The modelling was performed on the A–A′ section (Geomorphological map 2014 and Figure A in the Landslide modelling section of the Main Map), located close to the village of Montebello sul Sangro, in order to analyse the influence of landslide evolution state on the identification of landslide scarp retreat and the possible hazard affecting the village located close to the main scarp (CitationCalista, Di Giandomenico, & Mangifesta, 2007; CitationCalista, Mangifesta, Pasculli, & Sciarra, 2003).
Initially, we analysed the section using the parameters shown in . Subsequently, in order to verify the possible detensioning of the zones upstream of the slope, we performed a second analysis, removing the movement of the landslide deposits, improving their mechanical characteristics, and increasing the cohesion value up to a maximum of c′ = 10 kPa (CitationSciarra et al., 2011).
In the first analysis, the section was unstable; a large movement in the most upstream part of the current landslide flow was generated (Figure B and C in the Main Map). In these conditions, the numerical code was unable to further investigate the possible regression of the landslide scarp.
Further analysis carried out, parametrically increasing the cohesion value, identified the potentially mobilizable area on the outer plate of the slope deposits (Figure D and E in the Main Map). Figure E shows that the outer area of the deposits is fully plasticized and the most superficial meshes are at yield in tension. The numerical modelling allowed us to reconstruct, quite precisely, the actual evolutionary process of the entire slope.
6. Morphometric analysis of the drainage network
The morphometric analysis was performed for the whole San Leo basin and for three sub-basins including the Montebello landslide (). The normalized frequency distributions of the values ((b)–(d)), somehow indicating the correlation distance, are reported. Inspection of the ACF distribution related to the Montebello Landslide Basin ((b)) clearly shows a different morphometric distribution (peak at intermediate values) compared to the correlation distribution of Sub-Basin 1 and 2 (peak at low values and then decreasing, (c) and (d)). The whole San Leo Basin ((e)) is characterized by a bi-modal frequency distribution of the correlation point. Finally, the comparison between the plots reported in (b) and (f) shows that the resolution of the drainage network may affect the frequency distribution of the correlation length.
Figure 5. kindex distribution along the whole San Leo basin.
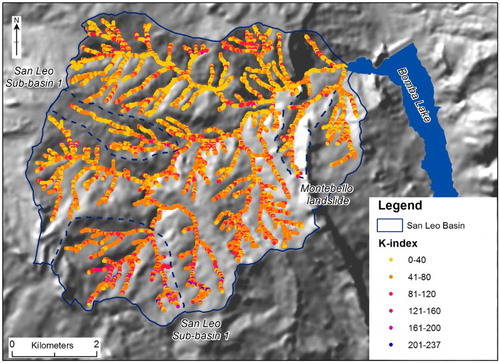
Figure 6. (a) Montebello landslide autocorrelation (5 m resolution); (b) Montebello landslide (25 m resolution); (c) San Leo sub-basin 1 (25 m resolution); (d) San Leo sub-basin 2 (25 m resolution); (e) San Leo basin (25 m resolution); (f) Montebello landslide (5 m resolution).
The different distribution of the kindex in the case of the Montebello Landslide Basin (lower right in the Morphometric analysis section of the Main Map) compared to the whole San Leo basin () is also evident from the map distribution of the values. The San Leo shows low values and a scattered distribution in almost the whole basin except for some local high values in the SW part of the basin (including sub-basin 1); the Montebello landslide sub-basin shows a clear trend, with low values in the centre of the basin and very high values in the upper and lower parts of the basin, outlining strong topographic anomalies in the scarp area and in the accumulation area of the landslide.
7. Conclusion
The integrated geomorphological analysis allowed definition of the features of the large landslide of Montebello sul Sangro (Abruzzo, Central Italy). The mass movement is classified as a complex landslide, a combination of rotational slide movements and earthflows. It is controlled by the geological and morphostructural setting of the carbonate and clay chaotic rocks (Argille varicolori), outlining an outstanding hogback ridge. The geomorphological evolution of the western side of the relief is influenced by rock falls in the upper part of the ridge, due to fractures and jointing in the calcareous strata, while in the lower part it is influenced by the progressive involvement of the clays. The scarp area involves the steep western calcareous slope of the ridge down to the gentle lower slope on clay units. The clay flows parallel to the hogback ridge in the upper and middle parts, while in the lower part the main earthflow cuts across the ridge through a deep gorge and then spreads out in a large accumulation lobe.
The regressive enlargement of the landslide scarp, close to the Montebello village, involves the western side of the calcareous ridge, with systems of tension fractures and reverse slope areas, affecting the Montebello village. This occurred after the relocation of the old Buonanotte village due to repeated landslide events in the 1800s. Now, the new village of Montebello sul Sangro is soon going to be affected again by the retreat of the main scarp.
A 2D numerical analysis of a section affected by an active landslide was performed by FLAC computer modelling. The selected section was particularly important since the related stability could also influence the stability of the nearby village of Montebello sul Sangro (Italy). The analysis was aimed at studying the evolution of the landslide and, in particular, it focused on the retreat of the landslide scarp possibly affecting the village. Indeed, blocking the movement of the current earthflow, we can observe that the outer area of the scree slope deposits is fully plasticized and the most superficial zones are at yield in tension.
Finally, in order to reconstruct possible topographic anomalies of the drainage sub-basin affected by the landslide, the use of ACF was introduced. Even though the results in terms of kindex are sampling method-dependent, the analysis outlines a strong topographic anomaly both in the scarp area of the landslide and in the accumulation area.
Software
The geomorphological maps presented in this work were produced using Esri ArcGIS (10.1). The landslide modelling was performed using FLAC (Fast Lagrangian Analysis of Continua) (CitationItasca Consulting Group, Inc., 2008), an explicit finite difference numerical model. The autocorrelation coefficient (ACF) calculations were performed using code developed by the authors in Digital Visual Fortran Compiler 6.
Geomorphological features of the Montebello sul Sangro large landslide (Abruzzo, Central Italy)
Download PDF (15.6 MB)Acknowledgements
The authors wish to thank the Struttura Speciale di Supporto Sistema Informativo Regionale of the Abruzzo Region (http://www.regione.abruzzo.it/xcartografia/) for providing the topographic data, aerial photos and orthophotos used for the geomorphological investigations and for the geomorphological map. The LiDAR data were provided by the Laboratory for landslides monitoring CNR-IRPI Torino.
Disclosure statement
No potential conflict of interest was reported by the authors.
Additional information
Funding
Related Research Data
References
- Abruzzo Region. (1974). 1:20,000 scale aerial photos, flight CASMEZ 1974.
- Abruzzo Region. (2007). 1:5,000 scale Regional Technical Maps.
- Abruzzo Region. (2009). 1:5,000 scale orthophotos color images.
- Abruzzo-Sangro Basin Authority. (2005). Piano Stralcio di Bacino per l'Assetto Idrogeologico dei Bacini di Rilievo Regionale Abruzzesi e del Bacino del Fiume Sangro. (L.R. 18.05 1989 n.81 e L. 24.08.2001) – Carta geomorfologica – scala 1:25.000.
- Almagià, R. (1910). Studi geografici sulle frane in Italia. Memorie Società Geografica Italiana, 14, 1–431
- Aringoli, D., Calista, M., Gentili, B., Pambianchi, G., & Sciarra, N. (2008). Geomorphological features and 3D modelling of Montelparo mass movement (Central Italy). Engineering Geology, 99(1–2), 70–84. doi:10.1016/j.enggeo.2007.11.005
- Ascione, A., Cinque, A., Miccadei, E., Villani, F., & Berti, C. (2008). The plio-quaternary uplift of the Apennine chain: New data from the analysis of topography and river valleys in Central Italy. Geomorphology, 102, 105–118. doi:10.1016/j.geomorph.2007.07.022
- Audisio, C., Pasculli, A., & Sciarra, N. (2015). Conceptual and numerical models applied on the river Pellice (North Western Italy). Engineering Geology for Society and Territory, 3, 327–330. doi:10.1007/978-3-319-09054-2_68
- Calista, M., Di Giandomenico, B., & Mangifesta, M. (2007). Modellazione numerica finalizzata allo studio del comportamento meccanico delle terre: applicazioni 3D per l'analisi della stabilità dell'area orientale dell'abitato di Ortona (CH). Giornale di Geologia Applicata, 6, 81–91.
- Calista, M., Mangifesta, M., Pasculli, A., & Sciarra, N. (2003, Febbraio 19–20). Evoluzione dinamica della Rupe di Roccamontepiano (Abruzzo): parametrizzazione statistica e modellazione 3D. Atti del I Convegno Nazionale AIGA, Chieti, pp. 139–150, Rendina Ed., Roma. ISSN 88 86698 40 2.
- Calista, M., Pasculli, A., & Sciarra, N. (2015). Reconstruction of the geotechnical model considering random parameters distributions. XII International IAEG Congress (Tourin). Engineering Geology for Society and Territory, 2, 1347–1351. Springer. doi:10.1007/978-3-319-09057-3_237
- Capelli, G., Miccadei, E., & Raffi, R. (1997). Fluvial dynamics in the Castel di Sangro plain: Morphological changes and human impact from 1875 to 1992. Catena, 30(4), 295–309. doi:10.1016/S0341-8162(97)00008-8
- Chelli, A., Segadelli, S., Vescovi, P., & Tellini, C. (2015). Large-scale geomorphological mapping as a tool to detect structural features: The case of Mt. Prinzera ophiolite rock mass (Northern Apennines, Italy). Journal of Maps. doi:10.1080/17445647.2015.1072115
- Ciccacci, S., Fredi, P., Lupia Palmieri, E., & Pugliese, F. (1980). Contributo dell'analisi geomorfica quantitativa alla valutazione dell'entità dell'erosione nei bacini fluviali. Bollettino della Società Geologica Italiana, 99, 455–516.
- Clermonté’, J. (1977). La bordure abruzzaise sud-orientale et le haut Molise: histoire sédimentaire et tectonique comparée. Rivista Italiana di Paleontologia, 83(1), 21–102.
- Cliff, A., & Ord, J. (1973). Spatial autocorrelation. London: Pion.
- Colapietro, E. (1822). Memorie sulle rovine della città di Vasto. Atti del Regio Istituto di incoraggiamento delle Scienze Naturali, III, Napoli.
- CNR-IRPI. (2014, January). LiDAR data, Montebello sul Sangro landslide, taken on January 2014. Laboratory for landslides monitoring, CNR-IRPI Torino.
- D'Alessandro, L., Genevois, R., & Prestininzi, A. (1979, May). Preliminary report on an earthflow in the Sangro valley (Central Italy). Superficial Mass Movements in Mountain Regions; Polish-Italian Seminar – Poland, Szymbark; Theme 3: Analysis of the stability of the rocks slopes. Instytut Meteorologii i Gospodarki Wodnej; 174–189.
- Del Monte, M., Fredi, P., Lupia Palmieri, E., & Salvini, F. (1999). Fractal analysis to define the drainage network geometry. Bollettino della Società Geologica Italiana, 118, 167–177.
- Del Monte, M., Vergari, F., Brandolini, P., Capolongo, D., Cevasco, A., Ciccacci, S., … Zucca, F. (2014). Multi-method evaluation of denudation rates in small Mediterranean catchments. In G. Lollino, A. Manconi, J. Clague, W. Shan, & M. Chiarle (eds.), Engineering geology for society and territory (Vol. 1, pp. 1–5). doi:10.1007/978-3-319-09300-0_105
- Di Bucci, D., Corrado, S., Naso, G., Parotto, M., & Praturlon, A. (1999). Evoluzione tettonica neogenico-quaternaria dell'area molisana. Bollettino della Società Geologica Italiana, 118, 13–30, 12 ff.
- Doglioni, A., & Simeone, V. (2014). Geomorphometric analysis based on discrete wavelet transform. Environmental Earth Sciences, 71(7), 3095–3108. doi:10.1007/s12665-013-2686-3
- GNGFG. (1994). Proposta di legenda geomorfologica a indirizzo applicativo. Geografia Fisica Dinamica Quaternaria, 16(2), 129–152.
- Guerriero, L., Coe, J. A., Revellino, P., Grelle, G., Pinto, F., & Guadagno, F. M. (2014). Influence of slip-surface geometry on earth-flow deformation, Montaguto earth flow, southern Italy. Geomorphology, 219, 285–305. doi:10.1016/j.geomorph.2014.04.039
- Guerriero, L., Revellino, P., Coe, J. A., Focareta, M., Grelle, G., Albanese, V., … Guadagno, F. M. (2013). Multi-temporal maps of the Montaguto earth flow in Southern Italy from 1954 to 2010. Journal of Maps, 9(1), 135–145. doi:10.1080/17445647.2013.765812
- Horton, R. E. (1945). Erosional development of streams and their drainage basins; hydrophysical approach to quantitative morphology. Geological Society of America Bulletin, 56, 275–370. doi: 10.1130/0016-7606(1945)56[275:EDOSAT]2.0.CO;2
- IFFI project. (2007). Landslide inventory map of Italy at 1:25,000 scale. ISPRA – Dipartimento Difesa del Suolo-Servizio Geologico d'Italia – Regione Abruzzo, Retrieved February 2, 2014, from www.sinanet.apat.it/progettoiffi
- IGMI. (1954). 1:33,000 scale aerial photos of flight GAI. Retrieved from http://geoportale.regione.abruzzo.it/geoportale/sovrapposta.asp?mapid=132&catID=7
- ISPRA. (2007). Guida alla rappresentazione cartografica della Carta geomorfologica d'Italia, 1:50.000. Quaderni Serie III del Servizio Geologico Nazionale, 10, 48 pp.
- Itasca Consulting Group, Inc. (2008). Flac (Version 6.0). Fast Lagrangian analysis of continua in three dimensions. Minneapolis, MN.
- Kaggwa, W. S. (2000). Determination of the spatial variability of soil design parameters and its significance in geotechnical engineering analyses. Developments in Theoretical Geomechanics, 1, 681–703.
- Labella, R., Capolongo, D., Giannandrea, P., Giano, S. I., & Schiattarella, M. (2014). Morphometric analysis of fluvial network and age constraints of terraced surfaces of the Ofanto basin, Southern Italy. Rendiconti Lincei, 25(2), 253–263. doi:10.1007/s12210-014-0321-1
- Miccadei, E., Mascioli, F., & Piacentini, T. (2011). Quaternary geomorphological evolution of the Tremiti Islands (Puglia, Italy). Quaternary International, 233, 3–15. doi:10.1016/j.quaint.2010.04.028
- Miccadei, E., Orrù, P., Piacentini, T., Mascioli, F., & Puliga, G. (2012). Geomorphological map of Tremiti Islands Archipelago (Puglia, Southern Adriatic Sea, Italy), scale 1:15,000. Journal of Maps, 8(1), 74–87. doi:10.1080/17445647.2012.668765
- Miccadei, E., Piacentini, T., Dal Pozzo, A., La Corte, M., & Sciarra, M. (2013). Morphotectonic map of the Aventino-Lower Sangro valley (Abruzzo, Italy), scale 1:50,000. Journal of Maps, 9(3), 390–409. doi:10.1080/17445647.2013.799050
- Miccadei, E., Piacentini, T., Gerbasi, F., & Daverio, F. (2012). Morphotectonic map of the Osento River basin (Abruzzo, Italy), scale 1:30,000. Journal of Maps, 8(1), 62–73. doi:10.1080/17445647.2012.668764
- Minatti, L., & Pasculli, A. (2010). Dam break smoothed particle hydrodynamic modeling based on Riemann solvers. WIT Transactions on Engineering Sciences, 1, 145–156. doi:10.2495/AFM100131
- Minatti, L., & Pasculli, A. (2011). SPH numerical approach in modelling 2D muddy debris flow. International Conference on Debris-Flow Hazards Mitigation: Mechanics, Prediction, and Assessment, Proceedings (pp. 467–475). ISBN: 978-889581446-9. doi:10.4408/IJEGE.2011-03.B-052
- Monaghan, J. J. (2005). Smoothed particle hydrodynamics. Reports on Progress in Physics, 68, 1703–1759. doi:10.1088/0034-4885/68/8/R01
- Pasculli, A. (2008). CFD-FEM 2D modeling of a local water flow. Some numerical results. Italian Journal of Quaternary Science, 21(1B), 215–228.
- Pasculli, A., & Audisio, C. (2015). Cellular automata modelling of fluvial evolution: Real and parametric numerical results comparison along River Pellice (NW Italy). Environmental Modeling and Assessment. doi:10.1007/s10666-015-9444-8
- Pasculli, A., Minatti, L., Audisio, C., & Sciarra, N. (2014). Insights on the application of some current SPH approaches for the study of muddy debris flow: Numerical and experimental comparison. WIT Transactions on Engineering Sciences, 1, 3–14. doi:10.2495/AFM140011
- Pasculli, A., Minatti, L., Sciarra, N., & Paris, E. (2013). SPH modeling of fast muddy debris flow: Numerical and experimental comparison of certain commonly utilized approaches. Italian Journal of Geosciences, 132(3), 350–365. doi:10.3301/IJG.2013.01
- Pasculli, A., & Sciarra, N. (2005). A fragile fracture study by fractal analysis. Annual conference of the International Association for Mathematical Geology IAMG 2005, Toronto, ON. ISBN: 978-097342202-3.
- Pasculli, A., & Sciarra, N. (2006). A probabilistic approach to determine the local erosion of a watery debris flow. 11th International Congress for Mathematical Geology: Quantitative Geology from Multiple Sources, IAMG 2006, Liege, Belgium. ISBN: 978-296006440-7.
- Patacca, E., & Scandone, P. (2007). Geology of the Southern Apennines. Bollettino della Società Geologica Italiana, 7, 75–119.
- Piacentini, T., & Miccadei, E. (2014). The role of drainage systems and intermontane basins in the quaternary landscape of the Central Apennines chain (Italy). Rendiconti Lincei, 25(2 Suppl.), 139–150. doi:10.1007/s12210-014-0312-2
- Piacentini, T., Sciarra, M., Miccadei, E., & Urbano, T. (2015). Near-surface deposits and hillslope evolution of the Adriatic piedmont of the Central Apennines (Feltrino Stream basin and minor coastal basins, Abruzzo, Italy). Journal of Maps, 11(2), 299–313. doi:10.1080/17445647.2014.949884
- Santo, A., Ascione, A., Di Crescenzo, G., Miccadei, E., Piacentini, T., & Valente, E. (2014). Tectonic-geomorphological map of the middle Aterno river valley (Abruzzo, Central Italy). Journal of Maps, 10(3), 365–378. doi:10.1080/17445647.2013.867545
- Sciarra, N., Calista, M., Marchetti, D., D'amato Avanzi, G., Pochini, A., & Puccinelli, A. (2011, February 14–16). Geomechanical characterization and 3D numerical modeling of complex rock masses: A slope stability analysis in Italy. Proceedings of the 2th International FLAC/DEM Symposium – Melbourne, Australia. ISBN 978-0-9767577-2-6.
- Servizio Geologico D'Italia. (1970). Carta Geologica d'Italia alla scala 1:100.000. Foglio 147 ‘Lanciano’. Servizio Geologico D'Italia, Roma. Stabilimento Salomone. Servizio Geologico D'Italia. Retrieved from http://193.206.192.231/carta_geologica_italia/tavoletta.php?foglio=147
- Servizio Geologico D'Italia. (1971). Carta Geologica d'Italia alla scala 1:100.000. Foglio 153 ‘Agnone’. Servizio Geologico D'Italia, Roma. E.I.R.A. Firenze. Retrieved from http://193.206.192.231/carta_geologica_italia/tavoletta.php?foglio=153
- SGN. (1994). Guida al rilevamento della Carta geomorfologica d'Italia, 1:50.000. Quaderni Serie III del Servizio Geologico Nazionale, 4. Roma.
- Smith, M. J., Paron, P., & Griffiths, J. S. (2011). Geomorphological mapping, methods and applications. Developments in Earth Surface Processes, 15. Oxford: Elsevier.
- Strahler, A. (1952). Hypsometric (area-altitude) analysis of erosional topography. Bullettin of the Geological Society of America, 63, 1117–1142. doi: 10.1130/0016-7606(1952)63[1117:HAAOET]2.0.CO;2
- Troiani, F., & Della Seta, M. (2008). The use of the stream length-gradient index in morphotectonic analysis of small catchments: A case study from central Italy. Geomorphology, 102, 159–168. doi: 10.1016/j.geomorph.2007.06.020
- Troiani, F., Galve, J. P., Piacentini, D., Della Seta, M., & Guerrero, J. (2014). Spatial analysis of stream length-gradient (SL) index for detecting hillslope processes: A case of the Gállego River headwaters (Central Pyrenees, Spain). Geomorphology, 214, 183–197. doi: 10.1016/j.geomorph.2014.02.004
- WP/WLI. (1993). A suggested method for describing the activity of a landslide. Bulletin of the International Association of Engineering Geology, 47, 53–57. doi: 10.1007/BF02639593