
ABSTRACT
Small-scale recessional push moraines are a characteristic signature of the active temperate glacial landsystem, and are often clearly linked to annual re-advances. These recessional push moraines represent a potentially valuable terrestrial climate archive, and may provide valuable insights into glacier dynamics. This paper presents detailed glacial geomorphological maps of recessional push moraines on the foreland of Skálafellsjökull, SE Iceland. Geomorphological maps have been produced at a scale of 1:3750 based on 2006 aerial photographs and 2012 satellite imagery. Using unmanned aerial vehicle-captured imagery, large-scale sample mapping of two selected areas of the glacier foreland has also been conducted, with the maps reproduced as A4-sized figures at scales of ∼1:2500 and ∼1:2000, respectively. Desk- and field-based mapping reveals suites of recessional push moraines distributed across the glacier foreland, often found in close association with flutings. Moraines on the foreland typically display distinctive ‘sawtooth' planform geometries, with complexities in the pattern occurring due to localised superimposition. The inventory of glacial geomorphological maps presented here provides a framework for subsequently exploring the characteristics of the recessional push moraines and recent ice-marginal fluctuations at Skálafellsjökull.
1. Introduction
Annual ice-marginal fluctuations at many Icelandic glaciers are manifest in the form of annual (push/squeeze) moraines (CitationEvans & Twigg, 2002; CitationKrüger, 1995; CitationPrice, 1970; CitationSharp, 1984), a characteristic signature of the active temperate glacial landsystem (CitationEvans, 2003, Citation2005; CitationEvans & Orton, 2015). Annual moraine formation occurs at the ice-margin during a period when forward ice-front movement exceeds the negligible ablation during the winter (CitationBradwell, Sigurðsson, & Everest, 2013; CitationLukas, 2012). Long sequences of annual moraines form when ice-front recession during the summer (ablation season) outstrips advance during the winter (accumulation season) over the course of a number of years (CitationBennett, 2001; CitationBoulton, 1986). Annual moraine sequences comprising >15 ridges have previously been reported from glacier forelands in Iceland (CitationBoulton, 1986; CitationBradwell, 2004; CitationKrüger, 1995; CitationPrice, 1970; CitationSharp, 1984), Norway (CitationWorsley, 1974), Canada (CitationBeedle, Menounos, Luckman, & Wheate, 2009) and the Swiss Alps (CitationLukas, 2012). Such sequences potentially contain a seasonal signature of glacier response to climatic fluctuations, and annual moraines have been associated with periods of elevated ablation-season temperature (CitationBeedle et al., 2009; CitationBradwell, 2004; CitationBradwell et al., 2013; CitationKrüger, 1995; CitationSharp, 1984). Given the potential of these features as a terrestrial climate archive, detailed examination of the characteristics of annual moraines on the forelands of Icelandic glaciers could yield valuable insights into the nature of, and controls on, recent ice-marginal retreat. During the past decade Icelandic glaciers have exhibited accelerating rates of ice-marginal retreat and mass loss (CitationBjörnsson et al., 2013; CitationSigurðsson, Jónsson, & Jóhannesson, 2007). Understanding this current rapid glacier change is crucial to placing current atmospheric warming and associated glacier retreat in a broader context. This study presents detailed mapping of recessional push moraines on the foreland of Skálafellsjökull, SE Iceland, with the intention of providing a framework to examine: (i) the moraine characteristics (geomorphology, genesis and chronology) in detail and (ii) patterns and rates of ice-marginal retreat at this outlet glacier. These recessional push moraines have previously been argued to form on an annual basis through seasonally driven ice-marginal processes (cf. CitationSharp, 1984), and the detailed mapping will therefore also provide a basis for re-examining this concept.
2. Study site and previous work
2.1. Study site
Skálafellsjökull, a non-surging outlet of the southeastern margin of the Vatnajökull ice-cap in SE Iceland, flows for ∼25 km from the Breiðabunga plateau in eastern Vatnajökull ( and ). The glacier descends steeply from the lava plateau onto a low elevation foreland, where it splays out to form a piedmont lobe. The current ice-margin terminates at an altitude of ∼60 m a.s.l. on the Mýrar plain (CitationEvans & Orton, 2015; CitationMcKinzey, Orwin, & Bradwell, 2004). At its northern margin, the glacier is topographically confined by the Hafrafellsháls mountain spur, which reaches a maximum elevation of ∼1008 m a.s.l. (CitationEvans & Orton, 2015). The contemporary Skálafellsjökull ice-margin is fronted by two proglacial lakes, the largest situated on the Mýrar plain ( and ), and a smaller proglacial lake at the southeastern sector of the ice-margin.
Figure 1. (a) Field photograph of Skálafellsjökull descending from the Breiðabunga plateau in eastern Vatnajökull (27 May 2014). The present-day ice-front is ∼1.4 km wide. (b) Map showing the location of Skálafellsjökull, SE Iceland. (c) Skálafellsjökull descends onto the Mýrar plain where it terminates as a piedmont lobe and is fronted by a proglacial lake (22 May 2014). Measuring from the ice-front, the lake is ∼350 m wide.
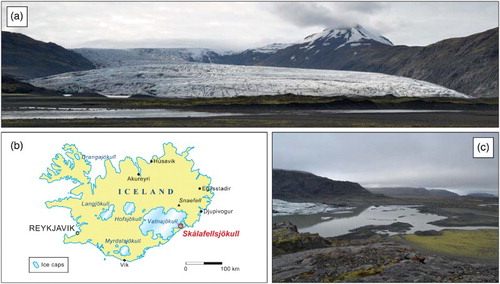
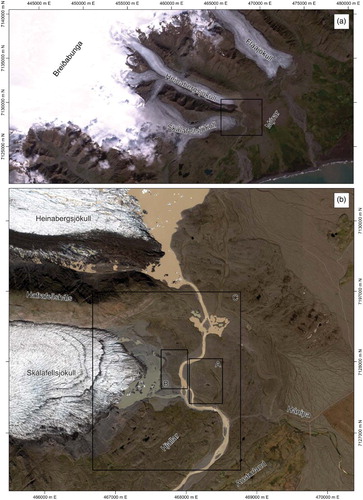
Figure 2. Satellite images showing the location of Skálafellsjökull and locations mentioned in the text. (a) Landsat 7 ETM+ scene (captured on 7 August 2006) displayed as a natural colour image (bands 3, 2 and 1). The box marks the location of (b). (b) Multispectral satellite image from the WorldView-2 sensor, European Space Imaging (June 2012). The boxes marked A and B show the areas that have been mapped using UAV-captured imagery, whilst the box marked C shows the area covered by the 1:3750 scale geomorphological maps. Scale and orientation are given by the Eastings and Northings. Projection: WGS 1984/UTM Zone 28N (ESPG: 32628).
Documentary evidence and maps indicate that Skálafellsjökull formerly coalesced with the neighbouring Heinabergsjökull, and they remained confluent until sometime between 1929 and 1945 (cf. CitationHannesdóttir, Björnsson, Pálsson, Aðalgeirsdóttir, & Guðmundsson, 2015; CitationThórarinsson, 1943; and references therein). Ice-front measurements conducted at the glacier since the 1930s indicate Skálafellsjökull underwent similar fluctuations to other non-surge-type Vatnajökull outlet glaciers (CitationSigurðsson, 1998). Since the 1970s, however, measurements have been sporadic, limiting understanding of glacier change at Skálafellsjökull during this period. Thus, the sequences of recessional push moraines previously identified on the Skálafellsjökull foreland (CitationEvans & Orton, 2015; CitationSharp, 1984) offer the opportunity to gain important insights into ice-frontal fluctuations.
2.2. Previous mapping
Skálafellsjökull has been the subject of a number of studies, including the investigation of the glacial landsystem as a whole (CitationEvans & Orton, 2015), component sediment-landform assemblages (CitationDowdeswell & Sharp, 1986; CitationEvans, 2000; CitationSharp, 1984) and the timing of Little Ice Age maxima (CitationEvans, Archer, & Wilson, 1999; CitationGordon & Sharp, 1983; CitationMcKinzey et al., 2004). In a recent study, CitationEvans and Orton (2015) mapped the surficial geology and glacial geomorphology of the Skálafellsjökull foreland, and neighbouring Heinabergsjökull foreland. CitationEvans and Orton (2015) established that the Skálafellsjökull glacier foreland constitutes a landsystem imprint of actively retreating temperate glaciers in a mountain environment with a high glaciofluvial sediment yield. Moreover, the landsystem is characterised by the three diagnostic depositional domains of the active temperate landsystem previously identified for Icelandic piedmont lobes: marginal morainic, subglacial and glaciofluvial/glaciolacustrine (CitationEvans, 2003; CitationEvans & Twigg, 2002; CitationKrüger, 1994; and references therein). The Skálafellsjökull glacier foreland also contains site-specific sediment-landform assemblages, notably overridden kame terraces on the southern part of the foreland. The survival of kame terraces is unusual and therefore the fluted kame terraces at Skálafellsjökull provide an important modern analogue for studies on palimpsest glacial landscapes, which are traditionally assumed to be produced by cold-based conditions in contrast to the wet-based conditions at Skálafellsjökull (CitationDavis, Briner, Coulthard, Finkel, & Miller, 2006; CitationForman, Mann, & Miller, 1987; CitationHättestrand & Stroeven, 2002; CitationLandvik et al., 2005). The combined landform record of Skálafellsjökull and Heinabergsjökull constitutes a modern glacial landsystem analogue for active temperate piedmont lobes associated with the construction of large outwash heads fed by high glaciofluvial sediment yields (CitationEvans & Orton, 2015).
Research focused on the marginal morainic domain of the Skálafellsjökull foreland has previously been conducted by CitationSharp (1984). The study specifically examined a sequence of recessional push moraines within the southern part of the foreland, located in an area of roches moutonnées and a discontinuous sheet of fluted subglacial traction till (cf. CitationEvans & Orton, 2015; CitationEvans, Phillips, Hiemstra, & Auton, 2006; CitationSharp, 1984). Sedimentological investigations by CitationSharp (1984) identified four process combinations, argued to be forming moraine ridges on an annual basis at the southeastern sector of the ice-margin. However, no detailed, large-scale mapping of the intricate details of the recessional push moraines was presented.
2.3. Purpose of the mapping
The rationale for producing detailed maps of the recessional push moraines on the foreland of Skálafellsjökull was twofold: (i) to provide context for examining the characteristics of these features (moraine geomorphology, sedimentology and chronology) in detail and (ii) to provide a framework for investigating recent ice-marginal fluctuations using moraine spacing. Importantly, the mapping, combined with additional sedimentological and chronological analyses, will allow a re-examination of the concept of annual moraine formation at Skálafellsjökull (cf. CitationEvans & Orton, 2015; CitationSharp, 1984). The mapping also aimed to build on the previous small-scale landsystem mapping undertaken by CitationEvans and Orton (2015). Individual maps have been produced at a scale of 1:3750 based on 2006 aerial photographs (Main Map 1) and 2012 satellite imagery (Main Map 2), providing a visual demonstration of recent ice-marginal retreat and the evolution of the glacier foreland. In addition to these two smaller-scale maps, detailed sample mapping of the recessional push moraines has been conducted based on hillshaded relief models generated from a 2013 high-resolution digital elevation model (DEM; presented in and ), allowing the complexity of recessional push moraine distribution and geomorphology to be examined. These large-scale maps have been produced as A4-sized figures at scales of ∼1:2500 () and ∼1:2000 (), respectively. As the focus of the mapping was on the intricate details of the recessional push moraines, the maps do not include detailed mapping of the surficial geology. An indication of the distribution and coverage of glaciofluvial sediments is presented, though this mapped unit has been simplified so as not to detract from the detail of the mapped moraines. As highlighted above, mapping of the surficial geology has been presented by CitationEvans and Orton (2015).
3. Methods
3.1. Remote sensing datasets and image preparation
For the purposes of glacial geomorphological mapping, four remote sensing datasets were acquired (). High-resolution scans of 2006 colour aerial photographs with a resolution of 0.41 m ground sampled distance (GSD) per pixel were obtained from the Icelandic survey company Loftmyndir ehf, whilst multispectral (eight-band) and panchromatic satellite imagery captured by the WorldView-2 satellite sensor in June 2012 were acquired from European Space Imaging. The multispectral (eight-band) satellite imagery and panchromatic images have resolutions of 2.0 and 0.5 m GSD, respectively. In addition, a further high-resolution remote sensing dataset has been used for mapping: specifically a DEM with a spatial resolution of 0.09 m, derived from imagery captured using an unmanned aerial vehicle (UAV) during aerial surveys of the Skálafellsjökull foreland in 2013 (see CitationHackney & Clayton, 2015). The images were taken using a fixed-wing QuestUAV 200 craft equipped with a mirrorless camera (Panasonic Lumix LX5 camera with 10.1 megapixel, 1/1.63 in. high-sensitivity CCD). Surveys were flown at an altitude of 100 m, yielding images with a resolution of 0.05 m GSD. A total of 1980 images were used to construct the DEM, selected on the basis of image quality and coherence of lighting. The final dataset of images used for processing had an approximate photograph endlap of 80% and sidelap of 60%. However, the dataset does not provide complete coverage of the Skálafellsjökull foreland, covering ∼2 km2 of the total area (∼4.9 km2) mapped. Thus, the 2006 aerial photographs and 2012 satellite imagery were largely used in the composition of the smaller-scale geomorphological maps (Main Maps 1 and 2).
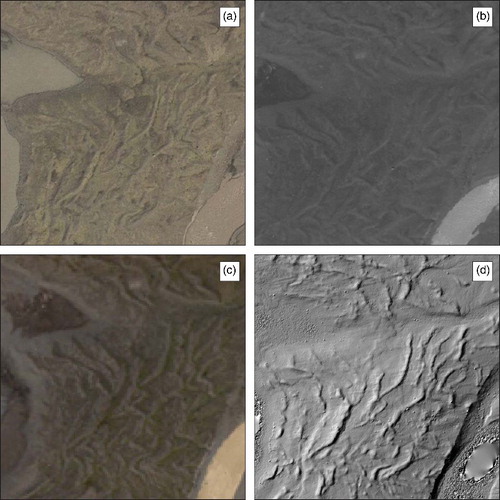
Figure 3. Extracts from the principal remote sensing datasets employed for glacial geomorphological mapping in this study. (a) Colour aerial photographs (0.41 m GSD) from 2006, Loftmyndir ehf. (b) Panchromatic satellite image (0.5 m GSD) from the WorldView-2 sensor, European Space Imaging (June 2012). (c) Multispectral satellite image (2.0 m GSD) from the WorldView-2 sensor, European Space Imaging (June 2012). (d) DEM data visualised as a hillshaded relief model, generated from UAV-captured imagery. Water bodies are poorly resolved in the DEM model, and this is reflected in the missing data towards the bottom right of the image.
Digital photogrammetric processing was conducted to remove the varying degrees of distortion and displacement inherent within aerial photographs as an effect of their central (or perspective) projection. Geometric distortion is related to radial lens distortion and refraction of light rays in the atmosphere. Additional displacement occurs as a result of the deviation of the camera from a vertical position (caused by roll, pitch and yaw of the aircraft), relief and curvature of the Earth. Non-corrected (non-orthorectified) aerial photographs are therefore characterised by relief displacement and scale variations, which increase towards the edges of the photograph (cf. CitationCampbell & Wynne, 2011; CitationLillesand, Kiefer, & Chipman, 2008; for further details). Processing of both the 2006 aerial photographs and 2013 UAV-captured imagery was undertaken in Agisoft PhotoScan Professional Edition, which utilises a Structure-from-Motion (SfM) approach. SfM operates under the same basic principles as stereoscopic photogrammetry, namely that 3D structure can be reconstructed from a series of overlapping, offset two-dimensional images. However, it differs fundamentally from conventional photogrammetry in that the geometry of the scene, camera positions and orientation are solved automatically without the need to specify a priori a network of targets with known 3D positions (CitationWestoby, Brasington, Glasser, Hambrey, & Reynolds, 2012). Instead, these are solved simultaneously using an iterative bundle adjustment procedure, based on a database of features automatically extracted from a set of multiple overlapping images (CitationRyan et al., 2015; CitationSnavely, 2008; CitationWestoby et al., 2012). Position information can then be introduced after model production in an arbitrary coordinate system, meaning that errors in ground control points (GCPs) will not propagate in the DEM.
The first stage of processing in Agisoft Photoscan involves image alignment. The software implements SfM algorithms to track features through a sequence of overlapping images in order to estimate the relative location of camera positions for each image and generate a 3D point-cloud of the tracked features (cf. CitationRyan et al., 2015, for further details). The point-cloud can subsequently be optimised and georeferenced using GCPs and/or using onboard telemetry data. Following image alignment, a multi-view reconstruction algorithm is applied to produce a 3D polygon mesh based on pixel values (CitationRyan et al., 2015; CitationVerhoeven, 2011). These 3D models can then be transformed and exported as DEMs and orthophotos. Using this approach, raster grid DEMs with cell sizes of 0.41 and 0.09 m were generated using the 2006 aerial photographs and 2013 UAV-imagery, respectively. An orthophoto mosaic of the foreland, with a cell size of 0.41 m, was also produced using the 2006 model for the purposes of landform mapping.
Positional ground control for the 2006 model was collected in the field using a Leica 1200 differential global positioning system (dGPS) between May and June 2014. The collected GCPs were processed using the Canadian Spatial Reference System Precise Point Positioning (http://webapp.geod.nrcan.gc.ca/geod/tools-outils/ppp.php?locale=en) tool, with the corrections then applied in Leica Geo Office 8.3. The Coordinate Conversion and Datum Transformation in Iceland (cocodati: http://cocodati.lmi.is/cocodati/cocodat-i.jsp) tool was then employed to generate orthometric heights for the GCPs and to convert the coordinates to Universal Transverse Mercator (UTM) projected coordinates for zone 28N. Orthometric heights generated using the cocodati tool are based on the ISN93 datum, ellipsoid GRS80 and applies the new Icelandic geoid model. For practical purposes GRS80 and WGS1984 can be considered approximately equal, since there is a difference of only 0.1 mm in the semi-minor axis (cf. CitationRennen, 2004). The point-cloud generated in Agisoft PhotoScan using the 2006 aerial photographs was optimised and georeferenced to WGS 1984/UTM Zone 28N (ESPG: 32628) using the processed GCPs (n = 50). This coordinate system is compatible with the system currently employed by Landmælingar Íslands (National Land Survey of Iceland) in the production of Icelandic maps. The final 2006 DEM had a total reprojection error of 0.64 m (x = 0.33 m, y = 0.29 m and z = 0.47 m).
The UAV surveys were undertaken in conjunction with a Leica dGPS deployed in real-time kinematic (RTK) mode to allow georeferencing of the UAV-captured imagery (see CitationHackney & Clayton, 2015). Positional information for the UAV-imagery was provided by 15 GCPs located in a grid network across the surveyed area, with the model also georeferenced to WGS 1984/UTM Zone 28N. The applied RTK corrections were accurate to ±0.01 and ±0.05 m in the horizontal and vertical dimensions, respectively. Moreover, the final DEM is considered geometrically stable, with no evidence of warping. The only issue encountered during the processing of the UAV-captured imagery relates to water bodies on the glacier foreland, which are poorly resolved in the model ((d)). Nonetheless, this was of minimal consequence to the mapping process.
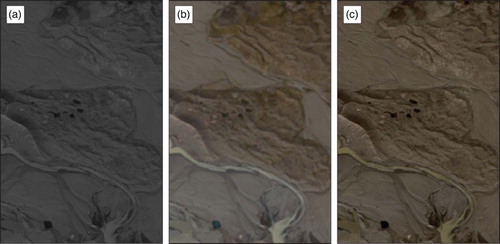
The satellite imagery obtained from European Space Imaging was purchased as Ortho Ready Standard and had been projected to UTM Zone 28N, spheroid WGS1984. The supplied imagery was orthorectified in ArcMap 10.2 using the DEM generated from the 2006 aerial photographs. Following orthorectification, a pan-sharpened, natural colour multispectral image (three-band: blue, red and green) with a resolution of 0.5 m GSD per pixel was generated using the intensity-hue-saturation (IHS) method in ArcMap (). The IHS method uses intensity, hue and saturation colour to merge the high-resolution panchromatic data (0.5 m GSD) with medium-resolution multispectral data (2.0 m GSD) in order to produce a multispectral image with higher-resolution properties.
Figure 4. Comparison of the processed satellite imagery used during the mapping process. (a) Panchromatic satellite image (0.5 m GSD). (b) Multispectral satellite image (2.0 m GSD). (c) Pansharpened three-band natural colour image (0.5 m GSD).
For meaningful graphical and analytical purposes, the DEM data were converted into hillshaded relief models using Spatial Analyst in ArcMap. Hillshaded relief models were produced using an illumination angle of 30° and azimuths set at orthogonal positions of 45° and 315° (). These properties have been extensively used in generating hillshaded relief models for the purposes of glacial geomorphological mapping and have been suggested as optimal settings for visualisation (CitationBoston, 2012; CitationChen & Rose, 2008; CitationHughes, Clark, & Jordan, 2010; CitationPearce, Rea, Bradwell, & McDougall, 2014; CitationSmith & Clark, 2005). Displaying the DEM data as hillshaded relief models with differing azimuths avoids azimuth bias and permits geomorphological features to be viewed under different lighting conditions, which can increase the visibility of subtle landforms (CitationPearce et al., 2014; CitationSmith & Clark, 2005).
Figure 5. Extracts from hillshaded relief models showing recessional push moraines on the foreland of Skálafellsjökull. The models are derived from the UAV-captured imagery. (a) Hillshaded relief model generated using an illumination angle of 30° and an azimuth of 45°. (b) Hillshaded relief model generated using an illumination angle of 30° and an azimuth of 315°. The difference in appearance of the recessional push moraines between the two models is apparent, demonstrating the value of visualising the data with different azimuths. Water bodies are poorly resolved in the DEM model, and this is reflected in the missing data towards the bottom right of the images.
3.2. Map production
Detailed glacial geomorphological mapping was conducted from the imagery discussed above, combined with field investigations conducted in May and June 2014 to ground truth the desk-based mapping. This approach of applying multiple remote sensing datasets, augmented by field-based geomorphological investigations, has been extensively applied in the context of both glacierised and glaciated landscapes, encompassing a variety of geographical locations (CitationBennett, Evans, Carbonneau, & Twigg, 2010; CitationBoston, 2012; CitationBradwell et al., 2013; CitationBrynjólfsson, Schomacker, & Ingólfsson, 2014; CitationDarvill, Stokes, Bentley, & Lovell, 2014; CitationEvans, Ewertowski, & Orton, 2015; CitationEvans, Young, & Ó Cofaigh, 2014; CitationJónsson, Schomacker, Benediktsson, Ingólfsson, & Johnson, 2014; CitationPearce et al., 2014; CitationReinardy, Leighton, & Marx, 2013). The application of both the interpretation of remote sensing data and field surveys permits a holistic approach to mapping, wherein the advantages of each method can be combined to produce an accurate map with robust genetic interpretations (CitationBoston, 2012; CitationBrown, Evans, & Evans, 2011).
Overlays of geomorphological features were digitally drawn in ArcMap 10.2 using the remote sensing data, with individual vector layers created for each geomorphological feature. The initial interpretation of the remote sensing data and on-screen digitisation was then checked in the field. In order to enhance the accuracy of mapping and reduce errors which may arise from misinterpretation of features, examination of the remote sensing data was conducted both prior to and after the field investigations (cf. CitationBoston, 2012; CitationLukas & Lukas, 2006; CitationPearce et al., 2014). The final digitised features were then exported to Adobe Illustrator CC for final editing and map production, along with a contour layer calculated at 20 m intervals using Spatial Analyst in ArcMap and the 2006 DEM to derive the elevation data. Following the tradition of previous glacial geomorphological maps of Icelandic glacier forelands, the glacier surface is represented on the maps by a mask generated directly from the processed imagery (cf. CitationEvans, 2009 and references therein).
4. Results
4.1. Moraine distribution and geomorphology
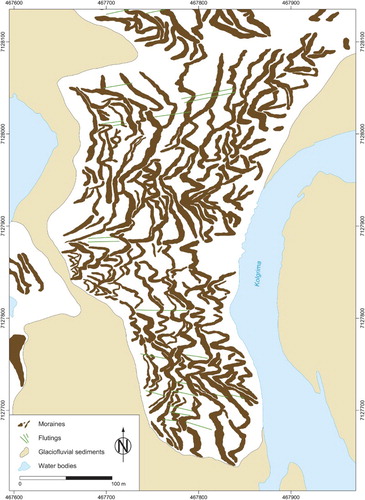
Glacial geomorphological mapping reveals a series of recessional push moraines distributed across the Skálafellsjökull foreland, with a total of 3201 moraine fragments mapped on the glacier foreland based on the 2012 satellite imagery. The individual moraine fragments form part of longer, discontinuous ridges that appear to reflect the geometry of the ice-margin. Long, largely uninterrupted sequences of moraines occur on the northern and central parts of the glacier foreland. The northern sequence comprises ∼32 chains of fragments/discontinuous ridges, made up of ∼536 fragments (average length: ∼54 m), and spread over ∼657 m of the foreland. In places, this sequence of recessional push moraines has been partially dissected by glaciofluvial activity. In the central area of the foreland, a sequence of 15 chains has been mapped, comprising ∼175 fragments (average length: ∼51 m) and spread over a distance of ∼320 m. In addition to these sequences, numerous recessional push moraines are evident in close proximity to the southeastern sector of the Skálafellsjökull margin. The geomorphology of this part of the foreland is highly complex, and it is more difficult to identify individual chains of moraine ridges. Many of the moraines in the southern part of the foreland have been overridden and exhibit fluted surfaces (see Section 4.2). In total 1633 individual moraine fragments (average length: ∼24 m) were mapped in the southern part of the foreland. Comparison of the 2006 and 2012 maps of the glacier foreland reveals that moraine formation has occurred at both the southeastern and northeastern sectors of the Skálafellsjökull ice-margin, with 281 moraine fragments formed during this period. Between 2006 and 2012, six chains of moraine ridges, made up of ∼20 fragments, formed at the northeastern sector of the ice-margin. The mapping also indicates that this period of moraine formation coincides with a phase of substantial glacier retreat and ice-marginal lake expansion.
Detailed analysis of recessional push moraine properties are not presented here, but some characteristic features are briefly outlined. Further detailed analysis will be presented in a subsequent paper. As highlighted above, the moraines typically take the form of discontinuous ridges, consisting of a number of smaller fragments which form part of longer chains (). The majority of the moraine fragments are less than 40 m in length, with the mean fragment length being ∼35 m. Crest-to-crest spacing (or longitudinal) spacing between individual chains of recessional push moraines ranges from ∼5 to 60 m on the Skálafellsjökull foreland. In planform, moraine ridges on the Skálafellsjökull foreland exhibit a distinctive ‘sawtooth’ or crenulate pattern, with teeth pointing in a down-ice direction and notches pointing upglacier (; cf. CitationMatthews, Cornish, & Shakesby, 1979). Teeth exhibit maximum wavelengths and amplitudes of ∼50 and ∼39 m, respectively, whilst notches exhibit maximum wavelengths and amplitudes of ∼47 and ∼41 m. Complexities in the general planview geometry occur locally, with individual moraine ridges exhibiting bifurcations and cross-cutting patterns. The high-resolution, sample mapping of moraines in two selected areas of the glacier foreland, based on UAV-captured imagery, provides a clear visualisation of the characteristic planform geometry and local complexities in this pattern ( and ). The recessional push moraines on the Skálafellsjökull foreland are typically asymmetrical in cross-section, with cross-profiles displaying shorter, steeper distal slopes and longer, gently sloping ice-proximal surface slopes. Individual moraines have heights ranging from ∼0.2 to 1.5 m, with moraine width being between ∼2 and 18 m.
Figure 6. Histogram and summary statistics of mapped moraine lengths for the entire dataset. Box-and-whisker plots show the 25th and 75th percentiles (grey box), and the 5th and 95th percentiles (whisker ends). The mean (horizontal line) is also shown.
Figure 7. Field photograph showing the characteristic ‘sawtooth’ planform of recessional push moraines on the Skálafellsjökull foreland (22 May 2014).
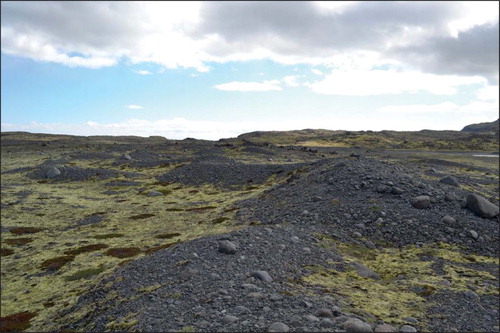
Figure 8. Glacial geomorphological map illustrating the distribution and planform of recessional push moraines in area A (see ). The mapping is based on the high-resolution DEM generated from UAV-captured imagery. Map projection is WGS 1984/UTM Zone 28N (ESPG: 32628). The map is at a scale of ∼1:2500 when printed as a full A4-sized figure.
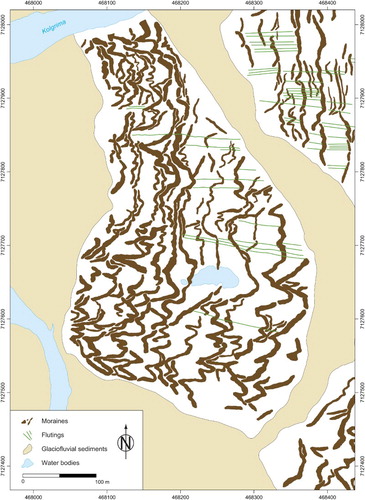
Figure 9. Glacial geomorphological map illustrating the distribution and planform of recessional push moraines in area B (see ). The mapping is based on the high-resolution DEM generated from UAV-captured imagery. Map projection is WGS 1984/UTM Zone 28N (ESPG: 32628). The map is at a scale of ∼1:2000 when printed as a full A4-sized figure.
4.2. Associated glacial geomorphological features
Moraines on the Skálafellsjökull foreland are frequently found in close association with flutings (), which may extend on to the ice-proximal slopes of moraines in places. Mapped flutings range in length from 7 to 201 m, with a mean value of ∼43 m (n = 951; 2012 imagery). On the reverse basalt bedrock slope near the southeastern sector of the Skálafellsjökull margin, recessional push moraines and flutings are also found in association with an abundance of roches moutonnées: flutings often extend from the lee-side faces of roches moutonnées. This area of the glacier foreland is also characterised by a number of recessional meltwater channels and a contemporary meltwater stream running along the ice-margin. Locally, meltwater accumulates along parts of the southeastern margin to form a small ice-marginal lake. At the time of the field surveys (May–June 2014), moraines in close proximity to the contemporary ice-margin could be found partially submerged by ponded and slow-moving meltwater. The close association of flutings and recessional push moraines on the Skálafellsjökull foreland suggests the formation of these geomorphological features may be intimately linked, as has previously been suggested at Icelandic glaciers (cf. CitationBenn, 1994; CitationBoulton, 1976; CitationBoulton & Hindmarsh, 1987; CitationEvans, 2003; CitationEvans & Twigg, 2002).
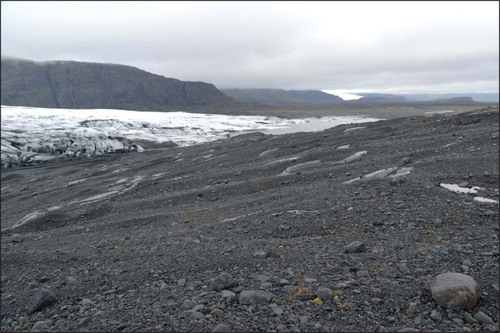
Figure 10. Field photograph across the southern part of the Skálafellsjökull foreland showing the close association of moraines and flutings (21 May 2014).
5. Summary and conclusions
Geomorphological mapping in this study, through a combination of desk- and field-based mapping, has resulted in the production of detailed, high-resolution glacial geomorphological maps showing the distribution of recessional push moraines and associated geomorphological features on the Skálafellsjökull foreland. The geomorphological mapping revealed a series of small-scale recessional push moraines, with long sequences of moraines occurring on the northern and central parts of the glacier foreland. These recessional push moraines display distinctive ‘sawtooth’ planform geometries (cf. CitationBradwell, 2004; CitationMatthews et al., 1979; CitationPrice, 1970). Complexities in the general pattern occur locally, with individual moraines exhibiting bifurcations and cross-cutting patterns. The inventory of geomorphological maps produced in this study provides a framework for subsequently exploring moraine chronology and sedimentology, from which recent ice-marginal fluctuations of Skálafellsjökull can be examined.
This study has also demonstrated potential of imagery captured using an UAV for the purposes of high-resolution mapping of small-scale geomorphological features. The acquisition of imagery using UAVs represents a potentially effective and low-cost technique for producing high-resolution, 3D georeferenced data (Citationd'Oleire-Oltmanns, Marzolff, Peter, & Ries, 2012; CitationHugenholtz, Levin, Barchyn & Baddock, 2012, CitationHugenholtz et al., 2013; CitationLucieer, Turner, King, & Robinson, 2014) but its application in glaciology and glacial geomorphology has so far been limited (CitationEvans et al., 2015; CitationRyan et al., 2015; CitationWhitehead, Moorman, & Hugenholtz, 2013). In the context of contemporary glacial environments, UAV imagery represents a potentially valuable tool for repeat surveying and monitoring, allowing further insights into ice-frontal fluctuations and proglacial landscape evolution to be gained.
Software
Image processing was conducted in Agisoft Photoscan Professional Edition, whilst processing of GPS data was performed in Leica Geo Office 8.3. Desk-based geomorphological mapping was undertaken in ESRI ArcMap 10.2, with the mapping exported to Adobe Illustrator CC for final editing and map production.
Glacial geomorphology of the Skálafellsjökull foreland, Iceland: A case study of ‘annual’ moraines
Download PDF (5.8 MB)Glacial geomorphology of the Skálafellsjökull foreland, Iceland: A case study of ‘annual’ moraines
Download PDF (6 MB)Acknowledgements
Thorough reviews by Danni Pearce, Anders Schomacker and Thomas Pingel, along with comments from Chris Clark (the Associate Editor), helped improve the clarity of this contribution. BMPC would like to thank Hannah Bickerdike, Jonathan Chandler and Bertie Miles for their assistance and companionship during fieldwork. Thanks are also due to Regína Hreinsdóttir (National Park Warden, South Territory) for granting permission to undertake fieldwork in the Vatnajökull National Park. Fieldwork was carried out under RANNÍS Agreement 4/2014.
Disclosure statement
No potential conflict of interest was reported by the authors.
Funding
This research was supported by a Quaternary Research Association (QRA) New Research Workers’ Award, Van Mildert College (Durham University) Principal's Award and Van Mildert College Postgraduate Award.
ORCID
Benjamin M. P. Chandler http://orcid.org/0000-0003-1532-9696
Marek Ewertowski http://orcid.org/0000-0002-0422-2327
Related Research Data
References
- Beedle, M. J., Menounos, B., Luckman, B. H., & Wheate, R. (2009). Annual push moraines as climate proxy. Geophysical Research Letters, 36, L20501. doi:10.1029/2009GL039533
- Benn, D. I. (1994). Fluted moraine formation and till genesis below a temperate valley glacier: Slettmarkbreen, Jotunheimen, southern Norway. Sedimentology, 41, 279–292. doi:10.1111/j.1365-3091.1994.tb01406.x
- Bennett, G. L., Evans, D. J. A., Carbonneau, P., & Twigg, D. R. (2010). Evolution of a debris-charged glacier landsystem, Kvíárjökull, Iceland. Journal of Maps, 6(1), 40–67. doi:10.4113/jom.2010.1114
- Bennett, M. R. (2001). The morphology, structural evolution and significance of push moraines. Earth-Science Reviews, 53, 197–236. doi:10.1016/S0012-8252(00)00039-8
- Björnsson, H., Pálsson, F., Guðmundsson, S., Magnússon, E., Adalgeirsdóttir, G., Jóhannesson, T., … Thorsteinsson, T. (2013). Contribution of Icelandic ice caps to sea level rise: Trends and variability since the Little Ice Age. Geophysical Research Letters, 40, 1546–1550. doi:10.1002/grl.50278
- Boston, C. M. (2012). A glacial geomorphological map of the Monadhliath Mountains, Central Scottish Highlands. Journal of Maps, 8(4), 437–444. doi:10.1080/17445647.2012.743865
- Boulton, G. S. (1976). The origin of glacially fluted surfaces: Observations and theory. Journal of Glaciology, 17, 287–309.
- Boulton, G. S. (1986). Push moraines and glacier-contact fans in marine and terrestrial environments. Sedimentology, 33, 677–698. doi:10.1111/j.1365-3091.1986.tb01969.x
- Boulton, G. S., & Hindmarsh, R. C. A. (1987). Sediment deformation beneath glaciers: Rheology and geological consequences. Journal of Geophysical Research: Solid Earth, 92(B9), 9059–9082. doi:10.1029/JB092iB09p09059
- Bradwell, T. (2004). Annual moraines and summer temperatures at Lambatungnajökull, Iceland. Arctic, Antarctic, and Alpine Research, 36, 502–508. doi:10.1657/1523-0430(2004)036[0502:AMASTA]2.0.CO;2
- Bradwell, T., Sigurðsson, O., & Everest, J. (2013). Recent, very rapid retreat of a temperate glacier in SE Iceland. Boreas, 42(4), 959–973. doi:10.1111/bor.12014
- Brown, V. H., Evans, D. J. A., & Evans, I. S. (2011). The glacial geomorphology and surficial geology of the South-West English lake district. Journal of Maps, 7(1), 221–243. doi:10.4113/jom.2011.1187
- Brynjólfsson, S., Schomacker, A., & Ingólfsson, Ó. (2014). Geomorphology and the little ice age extent of the Drangajökull ice cap, NW Iceland, with focus on its three surge-type outlets. Geomorphology, 213, 292–304. doi:10.1016/j.geomorph.2014.01.019
- Campbell, J. B., & Wynne, R. H. (2011). Introduction to remote sensing (5th ed.). London: Taylor and Francis, 667.
- Chen, C., & Rose, J. (2008). Assessment of remote sensed imagery on the analysis of landforms in Glen Roy. In A. P. Palmer, J. J. Lowe, & J. Rose (Eds.), The quaternary of Glen Roy and vicinity: Field guide (pp. 36–45). London: Quaternary Research Association.
- Darvill, C. M., Stokes, C. R., Bentley, M. R., & Lovell, H. (2014). A glacial geomorphological map of the southernmost ice lobes of Patagonia: The Bahía Inútil – San Sebastián, Magellan, Otway, Skyring and Río Gallegos lobes. Journal of Maps, 10(3), 500–520. doi:10.1080/17445647.2014.890134
- Davis, P. T., Briner, J. P., Coulthard, R. D., Finkel, R. W., & Miller, G. H. (2006). Preservation of arctic landscapes overridden by cold-based ice sheets. Quaternary Research, 65(1), 156–163. doi:10.1016/j.yqres.2005.08.019
- d'Oleire-Oltmanns, S., Marzolff, I., Peter, K. D., & Ries, J. B. (2012). Unmanned aerial vehicle (UAV) for monitoring soil erosion in Morocco. Remote Sensing, 4(11), 3390–3416. doi:10.3390/rs4113390
- Dowdeswell, J. A., & Sharp, M. J. (1986). Characterization of pebble fabrics in modern terrestrial glacigenic sediments. Sedimentology, 33, 699–710. doi:10.1111/j.1365-3091.1986.tb01970.x
- Evans, D. J. A. (2000). A gravel outwash/deformation till continuum, Skalafellsjokull, Iceland. Geografiska Annaler, Series A: Physical Geography, 82A(4), 499–512. doi:10.1111/j.0435-3676.2000.00137.x
- Evans, D. J. A. (2003). Ice-marginal terrestrial landsystems: Active temperate glacier margins. In D. J. A. Evans (Ed.), Glacial landsystems (pp. 12–43). London: Arnold.
- Evans, D. J. A. (2005). The glacier-marginal landsystems of Iceland. In C. Caseldine, A. Russell, J. Harðardóttir, & Ó. Knudsen (Eds.), Iceland – Modern processes and past environments. Developments in Quaternary Sciences (Vol. 5, pp. 93–126). Amsterdam: Elsevier.
- Evans, D. J. A. (2009). Glacial geomorphology at Glasgow. Scottish Geographical Journal, 125(3–4), 285–320. doi:10.1080/14702540903364310
- Evans, D. J. A., Archer, S., & Wilson, D. J. H. (1999). A comparison of the lichenometric and Schmidt hammer dating techniques based on data from the proglacial areas of some Icelandic glaciers. Quaternary Science Reviews, 18(1), 13–41. doi:10.1016/S0277-3791(98)00098-5
- Evans, D. J. A., Ewertowski, M., & Orton, C. (2015). Fláajökull (north lobe), Iceland: Active temperate piedmont lobe glacial landsystem. Journal of Maps. doi:10.1080/17445647.2015.1073185
- Evans, D. J. A., & Orton, C. (2015). Heinabergsjökull and Skalafellsjökull, Iceland: Active temperate piedmont lobe and outwash head glacial landsystem. Journal of Maps, 11(3), 415–431. doi:10.1080/17445647.2014.919617
- Evans, D. J. A., Phillips, E. R., Hiemstra, J. F., & Auton, C. A. (2006). Subglacial till: Formation, sedimentary characteristics and classification. Earth-Science Reviews, 78(1–2), 115–176. doi:10.1016/j.earscirev.2006.04.001
- Evans, D. J. A., & Twigg, D. R. (2002). The active temperate glacial landsystem: A model based on Breiðamerkurjökull and Fjallsjökull, Iceland. Quaternary Science Reviews, 21(20–22), 2143–2177. doi:10.1016/S0277-3791(02)00019-7
- Evans, D. J. A., Young, N. J. P., & Ó Cofaigh, C. (2014). Glacial geomorphology of terrestrial-terminating fast flow lobes/ice stream margins in the Southwest Laurentide ice sheet. Geomorphology, 204, 86–113. doi:10.1016/j.geomorph.2013.07.031
- Forman, S. L., Mann, D. H., & Miller, G. H. (1987). Late Weichselian and Holocene relative sea level history of Bröggerhalvöya, Spitsbergen. Quaternary Research, 27(1), 41–50. doi:10.1016/0033-5894(87)90048-2
- Gordon, J. E., & Sharp, M. (1983). Lichenometry in dating recent glacial landforms and deposits, southeast Iceland. Boreas, 12(3), 191–200. doi:10.1111/j.1502-3885.1983.tb00312.x
- Hackney, C., & Clayton, A. I. (2015). Section 2.1.7: Unmanned aerial vehicles (UAVs) and their application in geomorphic mapping. In L. Clarke (Ed.), Geomorphological techniques (Online Edition). London: British Society for Geomorphology. ISSN: .
- Hannesdóttir, H., Björnsson, H., Pálsson, F., Aðalgeirsdóttir, G., & Guðmundsson, S. (2015). Variations of southeast Vatnajökull ice cap (Iceland) 1650–1900 and reconstruction of the glacier surface geometry at the Little Ice Age maximum. Geografiska Annaler: Series A, Physical Geography, 97A(2), 237–264. doi:10.1111/geoa.12064
- Hättestrand, C., & Stroeven, A. P. (2002). A relict landscape in the centre of Fennoscandian glaciation: Geomorphological evidence of minimal quaternary glacial erosion. Geomorphology, 44, 127–143. doi:10.1016/S0169-555X(01)00149-0
- Hugenholtz, C. H., Levin, N., Barchyn, T. E., & Baddock, M. C. (2012). Remote sensing and spatial analysis of Aeolian sand dunes: A review and outlook. Earth-Science Reviews, 111(3–4), 319–334. doi:10.1016/j.earscirev.2011.11.006
- Hugenholtz, C. H., Whitehead, K., Brown, O. W., Barchyn, T. E., Moorman, B. J., LeClair, A., … Hamilton, T. (2013). Geomorphological mapping with a small unmanned aircraft system (sUAS): Feature detection and accuracy assessment of a photogrammetrically-derived digital terrain model. Geomorphology, 194, 16–24. doi:10.1016/j.geomorph.2013.03.023
- Hughes, A. L. C., Clark, C. D., & Jordan, C. J. (2010). Subglacial bedforms of the last British ice sheet. Journal of Maps, 6, 543–563. doi:10.4113/jom.2010.1111
- Jónsson, S. A., Schomacker, A., Benediktsson, Í. Ö., Ingólfsson, Ó., & Johnson, M. D. (2014). The drumlin field and the geomorphology of the Múlajökull surge-type glacier, central Iceland. Geomorphology, 207, 213–220. doi:10.1016/j.geomorph.2013.11.007
- Krüger, J. (1994). Glacial processes, sediments, landforms and stratigraphy in the terminus region of Mýrdalsjökull, Iceland. Folia Geographica Danica, 21, 1–233.
- Krüger, J. (1995). Origin, chronology and climatological significance of annual moraine ridges at Mýrdalsjökull, Iceland. The Holocene, 5, 420–427. doi:10.1177/095968369500500404
- Landvik, J. Y., Ingólfsson, Ó., Mienert, J., Lehman, S. J., Solheim, A., Elverhøi, A., & Ottesen, D. (2005). Rethinking Late Weichselian ice sheet dynamics in coastal NW Svalbard. Boreas, 34, 7–24. doi:10.1111/j.1502-3885.2005.tb01001.x
- Lillesand, T. M., Kiefer, R. W., & Chipman, J. W. (2008). Remote sensing and image interpretation (6th ed.). Hoboken, NJ: John Wiley & Sons, 804 pp.
- Lucieer, A., Turner, D., King, D. H., & Robinson, S. A. (2014). Using an unmanned aerial vehicle (UAV) to capture micro-topography of Antarctic moss beds. International Journal of Applied Earth Observation and Geoinformation, 27(Part A), 53–62. doi:10.1016/j.jag.2013.05.011
- Lukas, S. (2012). Processes of annual moraine formation at a temperate alpine valley glacier: Insights into glacier dynamics and climatic controls. Boreas, 41(3), 463–480. doi:10.1111/j.1502-3885.2011.00241.x
- Lukas, S., & Lukas, T. (2006). A glacial geological and geomorphological map of the far NW highlands, Scotland. Part 1. Journal of Maps, 2, 43–55. doi:10.4113/jom.2006.50
- Matthews, J. A., Cornish, R., & Shakesby, R. A. (1979). “Saw-tooth” moraines in front of Bødalsbreen, southern Norway. Journal of Glaciology, 88, 535–546.
- McKinzey, K. M., Orwin, J. F., & Bradwell, T. (2004). Re-dating the moraines at Skálafellsjökull and Heinabergsjökull using different Lichenometric methods: Implications for the timing of the Icelandic little ice age maximum. Geografiska Annaler, Series A: Physical Geography, 86A, 319–335. doi:10.1111/j.0435-3676.2004.00235.x
- Pearce, D., Rea, B. R., Bradwell, T., & McDougall, D. (2014). Glacial geomorphology of the Tweedsmuir Hills, Central Southern Uplands, Scotland. Journal of Maps, 10(3), 457–465. doi:10.1080/17445647.2014.886492
- Price, R. J. (1970). Moraines at Fjallsjökull, Iceland. Arctic and Alpine Research, 2(1), 27–42. doi:10.2307/1550139
- Reinardy, B. T. I., Leighton, I., & Marx, P. J. (2013). Glacier thermal regime linked to processes of annual moraine formation at Midtdalsbreen, southern Norway. Boreas, 42(4), 896–911. doi:10.1111/bor.12008
- Rennen, M. (2004). Cocodati: Coordinate conversion and datum transformation in Iceland version 1.3. Online Software – Manual and technical reference. Iceland: Landmælíngar Íslands, 28 pp. Retrieved July 2014, from http://cocodati.lmi.is/cocodati/cocodati-manual.pdf
- Ryan, J. C., Hubbard, A. L., Todd, J., Carr, J. R., Box, J. E., Christoffersen, P., … Snooke, N. (2015). Repeat UAV photogrammetry to assess calving front dynamics at a large outlet glacier draining the Greenland Ice Sheet. The Cryosphere, 9, 1–11. doi:10.5194/tc-9-1-2015
- Sharp, M. J. (1984). Annual moraine ridges at Skálafellsjökull, southeast Iceland. Journal of Glaciology, 30, 82–93.
- Sigurðsson, O. (1998). Glacier variations in Iceland 1930–1995: From the database of the Iceland Glaciological Society. Jökull, 45, 3–25.
- Sigurðsson, O., Jónsson, T., & Jóhannesson, T. (2007). Relation between glacier-termini variations and summer temperatures in Iceland since 1930. Annals of Glaciology, 42, 395–401. doi:10.3189/172756407782871611
- Smith, M. J., & Clark, C. D. (2005). Methods and visualization of digital elevation models for landform mapping. Earth Surface Processes and Landforms, 30, 885–900. doi:10.1002/esp.1210
- Snavely, N. (2008). Scene reconstruction and visualization from internet photo collections (Unpublished PhD thesis). University of Washington, DC.
- Thórarinsson, S. (1943). Oscillations of the Icelandic glaciers in the last 250 years. Geografiska Annaler, 25, 1–54. doi:10.2307/519895
- Verhoeven, G. (2011). Taking computer vision aloft – Archaeological three-dimensional reconstructions from aerial photographs with Photoscan. Archaeological Prospection, 18, 67–73. doi:10.1002/arp.399
- Westoby, M. J., Brasington, J., Glasser, N. F., Hambrey, M. J., & Reynolds, J. M. (2012). ‘Structure-from-Motion’ photogrammetry: A low-cost, effective tool for geoscience applications. Geomorphology, 179, 300–314. doi:10.1016/j.geomorph.2012.08.021
- Whitehead, K., Moorman, B. J., & Hugenholtz, C. H. (2013). Brief communication: Low-cost, on demand aerial photogrammetry for glaciological measurement. The Cryosphere, 7, 1879–1884. doi:10.5194/tc-7-1879-2013
- Worsley, P. (1974). Recent “annual” moraine ridges at Austre Okstindbreen, Okstindan, north Norway. Journal of Glaciology, 13(68), 265–277.