
ABSTRACT
A map of the logistic groups in the Republic of Panama and complementary maps of the distribution of the population density, GDP density, the economic activity ‘transport, storage and communications’, and the primary and secondary road network are presented. The clusters of territorial groups on each map were analyzed and created using the ‘decision tree’ data mining method in order to determine territorial groups with similar characteristics, including logistics infrastructure and nodes, socioeconomics and the environmental situation. At the reference scale of 1:800,000 these maps represent a planning tool to decision makers in land use matters.
KEYWORDS:
1. Introduction
Since the first experience of Land Use Planning (LUP) in 1933 to develop the Tennessee River System in the United States of America, and the integration of water control with the conservation and preservation of land resources (CitationMonod & De Castelbajac, 1987; CitationTennessee Writers, 1939), LUP's definitions have considered the perspective of sustainability (Agriculture Organization of the United Nations, Citation1993; Ministry of Agriculture and Land Affairs of the Republic of South, Citation2001). This planning process requires consideration of each logistic node impact on the spatial economy and regional development, and the possible synergies between them, even though planners often allocate nodes on the territorial space without considering the one effect over the others. Territorial logistic planning is an essential part of sustainable regional development. For the development of infrastructure, predicting the impact on regional growth in the long term is necessary in order to establish policies to reduce socio-economic differences between regions (CitationUrrunaga & Aparicio, 2012).
Over the last few decades, numerous techniques for analysis and modeling of data in different areas of statistics and artificial intelligence have been developed. Data mining is the process of discovering actionable and meaningful patterns, profiles, and trends by sifting through data using pattern recognition technologies (CitationMena, 1999). The relationships and summaries derived through a data mining exercise are often referred to as models or patterns (CitationHand, Mannila, & Smyth, 2001). Data mining can be considered the intersection of artificial intelligence and statistical techniques. Any problem with stored data is a problem to be dealt with using data mining. Some of these problems are: search of the unexpected through description of multivariate reality, search for associations, typology definition, detection of temporal sequences and prediction (CitationAluja Banet, 2001).
Some areas of data mining applications are: civil engineering (CitationGuo, Hu, & Peng, 2011; CitationChunchun, Nianxue, Xiaohong, & Wenzhong, 2011; CitationLee, Tseng, Shieh, & Chen 2011); medicine (CitationKoh & Tan, 2011; CitationShouman, Turner, & Stocker, 2012); education (CitationAsif, Merceron, & Pathan, 2012; CitationHung, Hsu, & Rice, 2012; CitationYadav, Bharadwaj, & Pal, 2012); banking and finance (CitationKwak, Shi, & Kou, 2012; CitationPrasad & Madhavi, 2012; CitationRavi, Nekuri, & Rao, 2012).
One data mining technique is termed the decision tree. A decision tree is a logical model represented as a binary (two-way split) tree that shows how the value of a target variable can be predicted by using the values of a set of predictor variables (CitationAluja Banet, 2001).
In particular, some decision tree applications involve the planning of logistic nodes (i.e. transport). For example, modeling on the environmental impact of airport de-icing activities to determine important explanatory variables for predicting levels of chemical oxygen demand and dissolved oxygen on the airport's waterways (CitationFan et al., 2011); evaluating countermeasures to secure cargo at United States south-western ports of entry (CitationBakir, 2008); spatial decision tree application to traffic risk analysis (CitationZeitouni & Chelghoum, 2001); deriving decision rules to locate export containers in container yards, including a decision tree from the set of the optimal solutions to support real time decisions (CitationKim, Park, & Ryu, 2000).
2. Research area
The research area is the Republic of Panama, located in Central America, between longitudes W and latitudes S 7° 12′ 07′′ to 9° 38′ 46′′ S and longitudes 77° 09′ 24′′ to 83° 03′ 07′′ W, corresponding to an area of 75,517 km2. The Republic of Panama borders the Republic of Costa Rica to the west, the Republic of Colombia to the east, the Caribbean to the north and the Pacific Ocean to the south.
The Republic of Panama is situated on the isthmus connecting North and South America. The Panama Canal connects the Atlantic Ocean with the Pacific Ocean, and concentrates the principal ports in the country in each of the Panama Canal entrances. The land adjacent to the Panama Canal presents unique logistic characteristics as its special economic areas are container ports, the transatlantic railroad and the Tocumen International airport. This strip of land includes Panama City and Colon City and has a high population density. The activities of transportation, storage, communication, wholesale and retail trades, and real estate activities make the greatest contribution to the provincial gross domestic product (GDP). The rest of the country has lower logistic node development.
3. Methodology
In order to determine the relationship between a target territorial logistic variable and their decision variables. The following methodology was developed: (1) determine the work stage; (2) develop the artificial intelligence model; and (3) draw the maps corresponding to the target variables.
3.1. Step 1: determination of the work stage
Determination of the work stage consists of a review of the state of the art to identify the set of variables used to characterize the target territorial logistic variable of study using specialized search services in two steps.
3.1.1. Determination of physical and functional decision variable
As systematic study of all the physical and functional decision variables (of ports, airports, road network, railroads, etc.) important to research for our target territorial logistic variable. It includes the study of the variables of territorial context such as population, environment and regional economic growth.
3.1.2. Collation of the decision variable
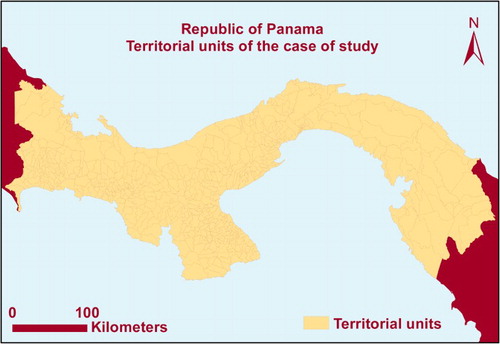
Once the decision variables to be studied are known, the variable values are collated using different information sources. The variable values have to be linked to territorial units identified in the country. The Republic of Panama is formed of three levels of political division: provinces, districts and a subdivision of the districts named ‘corregimientos’. The model of artificial intelligence considers 579 ‘corregimientos’ ().
Figure 1. Territorial units of the Republic of Panama.
The data set is compiled as follows:
The dependent variable M is the target variable and the vector n is composed of the predictor variables n1, n2, n3, … , nk. This data set is called the learning or training data set and is needed to build a decision tree model. The target variables are chosen according to the objective of the research.
3.2. Step 2: construction of the model of artificial intelligence and determination of the territorial clusters for each target variable
The software chosen to build the decision tree is DTREG (CitationSherrod, 2003), with the algorithms complex and computationally intensive. Here is an outline of the steps:
Build the tree.
Examine each node. Find the best possible split.
Create two child nodes.
Determine which child node each row goes into.
Continue the process until a stopping criterion is reached.
Prune the tree.
Build a set of cross-validation trees.
Compute the cross-validated misclassification cost for each possible tree size.
Prune the primary tree to the optimal size.
The method for evaluating the quality of splits when building classification trees is Gini, where each split is chosen to maximize the heterogeneity of the categories of the target variable in the child nodes.
The method used to determine the optimal tree size is V-fold cross validation, a technique for performing independent tree size tests without requiring separate test data sets and without reducing the data used to build the tree.
Once the decision tree is built, the territorial unit clusters are defined by every node in the decision tree, according to the values of the predictor variables indicated in the decision tree.
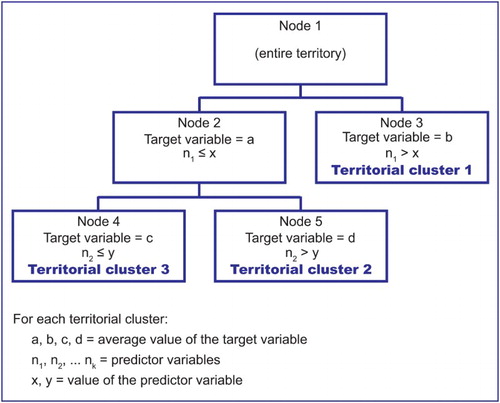
shows an example of a decision tree, where node 1 corresponds to the entire territory, node 2 and node 3 are the splits of node 1, and node 4 and node 5 are the splits of node 2. In these cases the nodes with no splits define the territorial cluster (node 3, node 4 and node 5), and the value of the predictor variables define how to identify the territorial units inside each cluster.
Figure 2. Example of a decision tree for territorial cluster analysis.
3.3. Step 3: draw the maps corresponding to the target variables
Once each of the decision trees are built for each target variable and every group of territorial clusters for each map have been determined, the next and final step is to draw the maps corresponding to each target variable.
4. Discussion and conclusions
For characterization of the Logistic Groups, population density distribution, GDP density distribution, distribution of economic activity (‘transportation, storage and communications’) and the primary road and the secondary road distribution is presented in the map of logistics groups.
4.1. Logistic groups map
The logistic group map represents an additional tool for land use planners and defines territorial units to consider as groups at a regional level of LUP.
Group A is comprised of the strip of land adjacent to the Panama Canal, and comprises the central parts of the provinces of Panama and Colon. This group has the containers ports, special economic areas, the transatlantic railroad, and Tocumen International airport. The province of Panama has the highest index of runway lengths per territorial area. Panama and Colon provinces with only 21% of the total area of the country generate more than 80% of the total GDP and have 57% of the total population. The activities of transport, storage, communication, wholesale and retail trades, and real estate activities make the greatest contribution to the provincial GDP and therefore to Group A.
Group B consists of the area called Panama Oeste and the provinces of Chiriquí and Coclé. Chiriquí and Coclé provide 10% of the total GDP of the country and have 22% of the total population. The activities of transportation, storage, communication, agriculture and animal husbandry make the greatest contribution to the provincial GDP and therefore to Group B, however none of these items reach 20% of the total provincial GDP.
Group C is comprised by the province of Veraguas, which contributes 2.5% of the total GDP of the country, and has 7% of the country's total population. The activities of transportation, storage, communication, agriculture, animal husbandry, and the Governmental activities makes the greatest contribution to the provincial GDP, however none of these items reach 20% of the total provincial GDP.
Group D comprises other areas of the country: The provinces of Bocas del Toro, Darién, Herrera, Los Santos and the Comarcas. Darien is notable for its large expanse of protected areas. The provinces of this group – after the province of Panama – present the highest index of airport runway length/area. Highlighting the province of Darien as the province with the largest number of track length. Agriculture and animal husbandry make the greatest contribution to the provincial GDP of Los Santos and Herrera.
The Main map represents an additional tool for land use planners and defines territorial units to consider as groups based upon population density distribution, GDP density distribution, the distribution of economic activity (‘transportation, storage and communications’) and the primary road and the secondary road distribution.
Software
All the maps were produced using ArcMap 10.1. The cluster analysis was produced using DTREG.
Logistic groups in the Republic of Panama.pdf
Download PDF (2.6 MB)Disclosure statement
No potential conflict of interest was reported by the authors.
ORCID
Nicoletta González Cancelas http://orcid.org/0000-0001-7167-1563
References
- Agriculture Organization of the United Nations. (1993). Guidelines for land-use planning. Rome: Food & Agriculture Org.
- Aluja Banet, T. (2001). La minería de datos, entre la estadística y la inteligencia artificial. Questiio: Quaderns d'Estadistica, Sistemes, Informatica i Investigaciio Operativa, 25(3), 479–498.
- Asif, R., Merceron, A., & Pathan, M. K. (2012). Mining student's admission data and predicting student's performance using decision trees. ICERI2012 Proceedings, 5121–5129.
- Bakir, N. O. (2008). A decision tree model for evaluating countermeasures to secure cargo at United States southwestern ports of entry. Decision Analysis, 5(4), 230–248. doi: 10.1287/deca.1080.0124
- Chunchun, H., Nianxue, L., Xiaohong, Y., & Wenzhong, S. (2011). Traffic flow data mining and evaluation based on fuzzy clustering techniques. International Journal of Fuzzy Systems, 13(4), 344–349. ISSN 1562–2479. Retrieved December 2011.
- Fan, H., Tarun, P. K., Shih, D. T., Kim, S. B., Chen, V. C., Rosenberger, J. M., & Bergman, D. (2011). Data mining modeling on the environmental impact of airport deicing activities. Expert Systems with Applications, 38(12), 14899–14906. ISSN 0957–4174. Retrieved November–December 2011. doi: 10.1016/j.eswa.2011.05.057
- Guo, Y., Hu, J., & Peng, Y. (2011). Research on CBR system based on data mining. Applied Soft Computing, 11(8), 5006–5014. ISSN 1568–4946. Retrieved December 2011. doi: 10.1016/j.asoc.2011.05.057
- Hand, D. J., Mannila, H., & Smyth, P. (2001). Principles of data mining. Cambridge: MIT press.
- Hung, J. L., Hsu, Y. C., & Rice, K. (2012). Integrating data mining in program evaluation of K-12 online education. Educational Technology & Society, 15(3), 27–41.
- Kim, K. H., Park, Y. M., & Ryu, K. R. (2000). Deriving decision rules to locate export containers in container yards. European Journal of Operational Research, 124(1), 89–101. ISSN 0377–2217. Retrieved January 7, from http://www.sciencedirect.com/science/article/pii/S0377221799001162 doi: 10.1016/S0377-2217(99)00116-2
- Koh, H. C., & Tan, G. (2011). Data mining applications in healthcare. Journal of Healthcare Information Management, 19(2), 64–72.
- Kwak, W., Shi, Y., & Kou, G. (2012). Bankruptcy prediction for Korean firms after the 1997 financial crisis: using a multiple criteria linear programming data mining approach. Review of Quantitative Finance and Accounting, 38(4),1–13.
- Lee, W. H., Tseng, S. S., Shieh, J. L., & Chen, H. H. (2011). Discovering traffic bottlenecks in an urban network by spatiotemporal data mining on location-based services. IEEE Transactions on Intelligent Transportation Systems, 12(4), 1047–1056. ISSN 1524–9050. Retrieved December 2011. doi: 10.1109/TITS.2011.2144586
- Mena, J. (1999). Data mining your website. Boston, MA: Digital Pr.
- Ministry of Agriculture and Land Affairs of the Republic of South. (2001). A white paper on spatial planning and land use management. Retrieved from http://www.info.gov.za/whitepapers/2001/spatialplanning.htm - local spatial planning
- Monod, J., & De Castelbajac, P. (1987). L'aménagement du territoire. Presses universitaires de France.
- Prasad, U. D., & Madhavi, S. (2012). Prediction of churn behavior of bank customers using data mining tools. Business Intelligence Journal, 5(1), 96–101.
- Ravi, V., Nekuri, N., & Rao, C. R. (2012). Privacy preserving data mining using particle swarm optimisation trained auto-associative neural network: an application to bankruptcy prediction in banks. International Journal of Data Mining, Modelling and Management, 4(1), 39–56. doi: 10.1504/IJDMMM.2012.045135
- Sherrod, P. H. (2003). DTREG predictive modeling software [Software]. Retrieved from http://www.dtreg.com
- Shouman, M., Turner, T., & Stocker, R. (2012). Using data mining techniques in heart disease diagnosis and treatment. Electronics, Communications and Computers (JEC-ECC), 2012 Japan-Egypt Conference on, 2012, IEEE, 173–177.
- Tennessee Writers, P. (1939). Tennessee: A guide to the state. Scholarly Pr. Nashville.
- Urrunaga, R., & Aparicio, C. (2012). Infrastructure and economic growth in Peru. CEPAL Review, 107, 145–163.
- Yadav, S. K., Bharadwaj, B., & Pal, S. (2012). Mining education data to predict student's retention: A comparative study. arXiv preprint arXiv:1203.2987.
- Zeitouni, K., & Chelghoum, N. (2001). Spatial decision tree-application to traffic risk analysis. Computer Systems and Applications, ACS/IEEE International Conference on 2001, 2001, 203–207.