
ABSTRACT
The Support Centre for Students with Special Needs at Masaryk University (the Teiresias Centre) in Brno, Czech Republic asked the team at the Department of Geography at the Faculty of Science to develop a technological procedure for the preparation of tactile maps from available sources of data. Most users would be blind and visually impaired students of Masaryk University. A set of scripts in Python language was prepared for the ArcGIS environment. The scripts prepare the source data, modify the layers, generate the layout of map sheets and export map sheets. The grid of map sheets covers the whole area of Brno City. Printed map sheets are combinable into larger areas. The scale of each map sheet is 1:2500.
1. Introduction
Tactile graphics are graphics in a tactile form. CitationLadner et al. (2005) describe tactile form as a ‘representation through which content can be accessed by touch’. Maps are a very efficient way for the presentation of information to users in the form of graphics. It means that maps in tactile form is unique tool for visually impaired people.
Seeing impaired users do not have to use only map in tactile form. Mobile devices combined with GPS and voice output can provide the user with navigation assistance (CitationHuang & Liu, 2004). Cell phones can be used for localisation of persons with reduced mobility in case of crisis situation (CitationŘezník, Horáková, & Szturc, 2015). However, this paper is focused on the use of paper maps by visually impaired people.
Persons with residual vision can use classic map if it is prepared with the proper colour, size, style and scale. One example of such solution is described by CitationKulyukin, Marston, Miele, and Kutiyanawala (2010). Adaptation of map for individual user according to situation, purpose and user’s background (e.g. knowledge) and needs (e.g. residual vision) is a scope of adaptive cartography. This concept is described by CitationErharuyi and Fairbairn (2005), CitationŠtampach, Kubíček, and Herman (2015), CitationKubíček, Kozel, Štampach, and Lukas (2013), CitationKubíček, Muličková, Konečný, and Kučerová (2011) and others.
For totally blind people, on the other hand, production of special maps in tactile form is necessary. Tactile maps (also called tyflomaps or haptic maps) are a very specific type of cartographic visualisation for visually impaired users. Their production is often very time demanding. ‘An automated technique for producing highly detailed, “one-off” maps would be of great benefit’ (CitationMiele, Landau, & Gilden, 2006, p. 94).
In the case of classic maps, authors try to place as much information as possible on the map, using various techniques of visualisation for this purpose – colours, hatching, etc. However, it is impossible to use all such techniques for tactile maps. Without the possibility to use colours, various types of points, lines and areas must be distinguished only by their different textures.
The differentiation ability of fingers is much less than the visual acuity of the eye. CitationČervenka (1999), as cited in CitationBodnárová (2012, p. 39), notes that the number of map objects on a tactile map is 13 times lower than on the equivalent classical map. A broad description of progress in tactile mapping with the citation of many other sources can be found, for example, in CitationPerkins (2002). Important sources of information about tactile maps are national authorities (e.g. The Braille Authority of North America) and organisations dedicated to the welfare of persons with visual impairment (e.g. The Support Centre for Students with Special Needs at Masaryk University).
Experts from the Support Centre for Students with Special Needs at Masaryk University (the Teiresias Centre) asked the team at the Department of Geography to develop a technological procedure for the preparation of tactile maps from available sources of data.
Tactile maps were to be prepared for relief printing on microcapsule paper. This process uses a fuser – a machine which uses the heat to create the relief. The process is as follows (CitationTeiresias, 2015):
The tactile map is prepared in a graphic editor.
The map is printed by laser printer on microcapsule paper – a special foil, whose surface layer, when covered with black dye, creates a tactile relief through the action of heat.
The printed foil is heated in the fuser to create a tactile relief. The fuser usually has a halogen bulb that supplies the heat needed to raise the grey and black areas on the microcapsule paper.
Some of the Teiresias Centre’s requirements concerning the maps are outlined as follows:
The map must be prepared for relief printing on microcapsule paper on fuser. This equipment is in possession of the Teiresias Centre, so generated maps can be printed nearly immediately on demand of users. It means that the maps can only use a single level of relief.
The most important information on the map is the location of buildings of Masaryk University and the main communication networks – tram lines, public transport stations, etc.
The visually impaired user of the map probably already knows the locations on his/her map; the map users are students that are studying in Brno. Most of the produced maps will present locations important to the students – the faculties, the locations of student hostels, railway stations, etc. The purpose of the map is not only to provide high-level details of streets but also to supplement the user’s knowledge of locations with additional information (information useful to students and clients of the Teiresias Centre).
The map must be usable for both the visually impaired user and his/her sighted assistant; labels must be printed both in Braille and in classic font.
Important streets must be labelled in Braille using the font developed by the Teiresias Centre. It is available at the Internet address: http://www.teiresias.muni.cz/download/braille/braille_font_cz.zip. A 24-pt size is mandatory for it. The font is a Czech version of Braille font – special Czech characters are included.
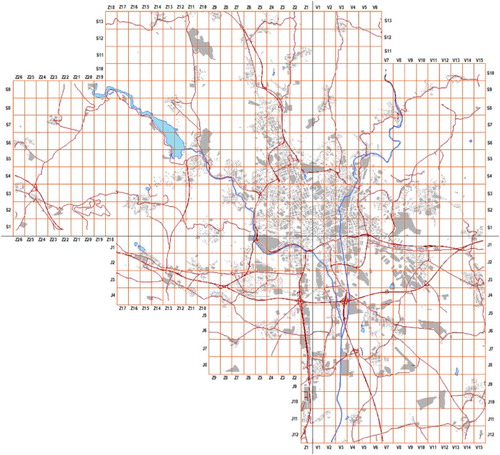
Individual printed maps must be combinable into a bigger area. This means that the City of Brno should be covered by a regular grid of map sheets, with no gaps between neighbouring map sheets (see ). It should be possible to generate both individual map sheets and a series of them. Each map sheet has its own identification in the grid.
Every map sheet should be named after the most important place or object on it – institution, public transport hub, etc. This object is called the ‘reference point’.
Figure 1. City of Brno covered by regular grid of 762 map sheets. Overview with grid of map sheets is not prepared for print. It is used only in ArcGIS for selecting map sheets for generation – in larger scale than on the figure.
2. Methods
Producing tactile maps from available data with the use of GIS software is not a new topic – for example, CitationClark and Clark (1994) undertook a similar task in 1994. CitationMiele et al. (2006, p. 93) presented TMAP prototype in 2006 as a ‘system capable of creating detailed and accurate audio-tactile street maps of any neighbourhood’. We decided to use ArcGIS software, which has a wide range of tools for data editing and also offers the possibility to create scripts in Python language.
2.1. Minimum widths and lengths of map objects
It is important to define the minimum widths and lengths of map objects in order for them to be readable by touch. Various authors recommend slightly different values.
CitationJehoel, McCallum, Rowell, and Ungar (2006, p. 71) researched the use of double lines in tactile maps. The authors suggested that separation distance between two lines is at least 1.3 mm, and that single lines that are wider than 2.2 mm might be perceived as double lines because the two edges of so wide single lines caused a sensation of two separate lines. However, the same work of CitationJehoel et al. (2006, p. 70) also cites works of other authors that have found different values of the smallest gap that is detectable by touch. Values are in the range from 0.87 (CitationJohnson & Phillips, 1981) to 2.81 mm (CitationStevens, Foulke, & Patterson, 1996). Recommended elevation of tactile features to be identified reliably is stated as 0.2 mm by CitationJehoel et al. (2006, p. 72).
The most reputable Czech authority on tactile maps, CitationJesenský (1988), as cited in CitationBodnárová (2012, p. 18), states that the minimum width of the relief point or relief line, as well as the distance between two of them should be 1.2 mm. The relief height should be at least 0.75 mm.
Slightly larger sizes for points and lines and a wider gap between them are suggested in CitationBANA (2012, Unit 3):
area: minimum size of area should be 1/4 square inch (6 millimetres square),
point: the minimum diameter should be at least 1/4 inch (6 millimetres). The space between a point symbol and any other component should be a minimum of 1/8 inch (3 millimetres),
line: primary lines should be a minimum of 1/2 inch (1.25 centimetres) in length.
CitationČervenka (1999, p. 11), as cited in CitationRůžičková et al. (2009, p. 6), recommends the following values based on the experience of the Teiresias Centre with the use and testing of tactile maps (Červenka is a member of Centre):
line or point width: 3–5 mm, preferably 5 mm,
minimum distance between two lines: 3–5 mm, preferably 5 mm,
minimum distance between two edges: 3–5 mm.
These values are recommended by the Teiresias Centre, which ordered the algorithm, and they are also similar to the values mentioned in CitationBANA (2012, Unit 3). These values were used as initial values for further work.
2.2. The size and scale of the map sheet; reference system and north orientation
The next issue to resolve was the size of the map sheet and the scale of the map. Experts from the Teiresias Centre recommended that the area which can be explored by both hands of the user should not be larger than 60 × 80 cm and should be even smaller (25 × 30 cm) in the case of detailed searching. CitationBANA (2012, Unit 3.4.4.1) writes that orientation and mobility maps that are portable and carried by the reader should be 11 × 17 inches in size (28 × 43 cm). This is very near to A3 format (29.7 × 42 cm).
An important factor was limitations with respect to the microcapsule paper and fuser in possession of the Teiresias Centre. The maximum size of paper that could be printed was A3 format (29.7 × 42 cm); however, the resulting map size was even smaller because of unprintable areas on the paper margins. Consequently, the size of the map face was determined to be 24 × 36 cm. We accepted these values because this size allows the user to search the map sheet in detail.
The scale of the map sheet was derived from the sizes of streets and their labels. In the opinion of CitationBANA (2012, Unit 3.4.4.12): ‘Labels should be placed a minimum of 1/8 inch (3 millimetres) to a maximum of 1/4 inch (6 millimetres) from any other component’. Also, the Teiresias Centre recommended that the size of the Braille should be 7–7.5 mm and that the distance of the label from the street margins should be no less than 3 mm. This means that the width of the labelled street should be 13 mm. The width of less important streets without labels was determined to be 5 mm. This is the minimum distance between two lines recommended by CitationČervenka (1999, p. 11) as cited in CitationRůžičková et al. (2009, p. 6).
From these limits, the scale of the map sheet was determined to be 1:2500. The size of the map face was determined to be 24 × 36 cm. This means that the map sheet presents an area of 600 × 900 m (). This size is smaller than A3 format (29.7 × 42 cm); thus, the margins of each map sheet can be used to place important information – the name and description of the map sheet and the symbol of north orientation, which is a row of points on the top margin of map sheet that produce a relief in the fuser. This type of north orientation was recommended by the Teiresias Centre. Also CitationBANA (2012, Unit 8.5.8) writes that a ‘north line’ is tactually and visually more helpful than the classic north arrow. The Universal Transverse Mercator coordinate system (zone 33 North) with WGS84 ellipsoid was chosen for the map. This system is the official reference system in the Czech Republic.
Figure 2. The scheme of the map sheet, size of paper and map face.
2.3. Map symbols and textures preparation and testing
The legend should not be part of each map sheet; it is situated on special sheet (see in Main Map). The map symbols and textures were designed by Lucie Friedmannová, the graphic designer of the Department of Geography team and approved by the Teiresias Centre.
The readability of the symbols was tested twice by experts and visually impaired clients of the Teiresias Centre. The first testing was focused on readability of textures used for landcover/landuse categories. Two experts and five visually impaired users participated. The reduction of number of categories used in maps and aggregation of some of them was recommended. Final number of types of used textures is five (urban housing, other built-up area, green area, other open area and water area).
The second testing was focused on readability of point and line symbols and two experts and three visually impaired users participated. Testers were selecting from two offered variants of some point and line symbols. Some symbols were changed according to the results of testing – for example, tram lines, reference points and the borders of areas. CitationLandau (1999) recommends that total number of tactile symbols used in one document should be limited to no more than 15. Three types of point and eight types of line symbols are used in map sheets.
Because of the limited number of distinguishable textures, some landcover/landuse categories were grouped. For example, the categories forest, meadow, park, garden and others were grouped with the category ‘green areas’. We decided to distinguish urban housing (blocks of buildings) and suburban housing (smaller buildings with a front garden or fence), since the difference might be important for a visually impaired user in a situation in which he/she prefers to use buildings or fences as guides when walking along the street.
2.4. Algorithm programming and functionality of scripts
Our team decided to implement the system as a set of consecutively executed scripts. This system was prepared for the ArcGIS environment; thus, we used some of the possibilities of ArcPy – a package for the automation of map production using Python. The scripts:
prepare the source data – including the reclassification of landuse/landcover categories,
modify the layers – including the generalisation and editing of streets, buildings blocks, etc.,
generate the layout of map sheets – including the assignment of prepared map symbols to layers, the labelling of streets, the selection of reference point, etc.,
export map sheets to the selected file format.
2.4.1. Data sources
The Teiresias Centre claims that the maps must be generated from data that are available from official data sources – from the Czech national mapping agency (ČÚZK) or the city of Brno:
Most of the used layers – water bodies, buildings, landcover areas and communication networks including railways, tram lines, roads and paths – were obtained from ZABAGED®, a basic vector database from the Czech national mapping agency.
Public transport stops were generated from data of the Public Transport System of Brno.
2.4.2. Modification and generalisation of layers
The modifications of layers and data generalisation were substantial and the most complex part of map creation. Some tasks could be achieved by using cartography tools implemented in ArcGIS (e.g. Thin Road Network). However, the rest of the required code had to be written in Python language from scratch. The main factor that influences the generalisation process is the width of labelled streets, which is 13 mm, as mentioned above.
From the viewpoint of map creation we can imagine the city area as a system of two features: ‘canyons’, that is, mobility corridors (streets, rivers, tram lines, etc.) and ‘islands’, that is, areas between canyons (built-up areas, parks, etc.). In the final map, canyons are represented by white areas, islands by polygons with texture. Map creation consists of two main tasks:
the generation of canyons and
the classification of islands.
Following description of generalisation is visualised on –. Situation on generated map sheet is compared with the Base map of the Czech Republic at scales of 1:10,000. They were obtained by Web Map Service from the Czech national mapping agency.
Figure 3. The elimination of loop at the end of tram line (1). Left: the Base map of the Czech Republic 1:10,000; right: generated tactile map.
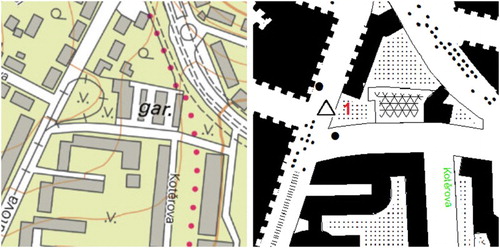
Figure 4. The tram line (1) which had been originally on the side of street (‘třída Generála Píky’) was translated to centre of street. The closed area of school (2) was classified to ‘other built-up area’, the lawn between houses (3) was classified to ‘green area’ and other non-built area (4) was classified to ‘other open area’.
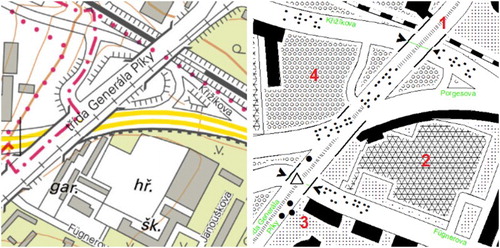
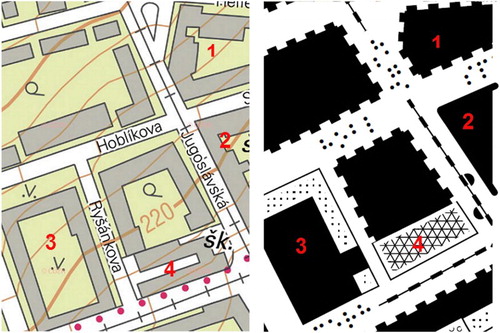
Figure 5. The generalisation of blocks of buildings – inner yards were removed.
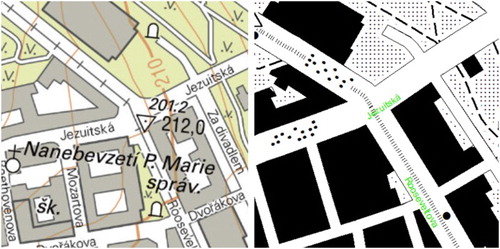
Figure 6. Reclassification of buildings. 1, suburban housing; 2, urban housing; 3, building in green area and 4, other built-up area.
2.4.2.1. Canyons
These are generated from a ‘canyon graph’, which is built from linear layers – streets, rivers, railways, tram lines and paths. Graph generation covers various generalisation tasks:
The elimination of dead ends (cul-de-sacs) on short streets and tram lines. shows eliminated loop at the end of tram line.
The amalgamation of parallel roads which are too close to each other.
The transposition of tram lines to streets which are parallel to them. shows that tram line which had been on the side of road originally was shifted to centre of it.
The simplification of the road network. The result is a hierarchy of streets distinguishing between important (labelled) and unimportant (non-labelled) streets.
Street displacement along railways, water bodies and other streets of different rank.
2.4.2.2. Islands
The next task is to divide and classify islands (i.e. areas complementary to canyons). The areas available for islands on the map are often much smaller than their areas in reality due to the widths of canyon lines. This means that some generalisation must be undertaken first – inner yards are removed and small residual areas are eliminated (). After this, the classification of islands can begin:
Islands are overlapped by polygons of original data that were earlier regrouped with other built-up areas, water areas and other open areas. Overlapped islands are classified according to the original type of polygons – other built-up areas, water areas and other open areas ().
This means that non-overlapped or partly overlapped islands are supposed to represent housing areas or green areas. On the map we distinguish two main types of housing – urban and suburban housing. The presence of a front garden is typical for suburban housing. Building in the street line is the main characteristic of urban housing. A special type of housing is buildings in green areas. These are typically high residential buildings in suburbs that are surrounded by non-private green areas. Buildings that are part of ‘other built-up areas’ are not depicted on the map because such areas are mostly not accessible. This type of area is only symbolised by texture. The differences are shown in .
2.4.3. Generation of layout, reference points and labelling
The last step of tactile map creation is the generation of the layout. The user can choose to generate:
all map sheets for the whole city of Brno,
only selected map sheets,
a special map sheet independent of the prepared grid of map sheets. This is useful when the required location is on the border between two map sheets.
For the labelling of streets and squares, the ArcGIS Maplex extension was used. Both Braille labels for visually impaired users and classic text labels were placed onto the map. Braille labels have higher priority in the case of lack of space. Braille labels are black and produce a relief in the fuser. Classic text labels are green. This means that they are visible but the fuser will not produce a relief. Names of streets and especially names of squares are too long to be placeable onto a map in Braille font. The Teiresias Centre suggested an algorithm for the generation of abbreviated names of streets. This was implemented into the scripts.
The Teiresias Centre required that every generated map sheet should be named after its reference point, that is, the most important place or object on it, for example, an institution, public transport hub, etc. Ideally, it should be placed near the centre of the map sheet. This point is symbolised by a special symbol (see the map legend in Main Map). The name of each map sheet is generated on the top part of the map sheet (see ) above the map face both in Braille in black (the label will be produced as a relief by the fuser) and in classic font in green (the label is visible but the fuser will not produce a relief). The co-ordinate identification of the map sheet in the grid of map sheets (e.g. V4 S5) is generated under the label also in Braille and classic font.
2.4.4. Exporting map sheets to selected file format
Before starting of map sheets generation the user chooses the file format for export. The plenty of formats are offered: BMP, JPG, PDF, PNG and others. It allows also manual editing of generated map sheets in graphic editors in situations when the result of automated algorithm is not satisfactory. However, no additional manual editing was done in map sheets presented in Main Map.
A comprehensive manual for tactile map generation was prepared and delivered to the Teiresias Centre as part of the final package. Some complex situations are not able to be fully and automatically represented by scripts. Human inspection and possibly some editing are necessary after some scripts before the following script is executed.
2.5. Examples of generated map sheets
All 762 map sheets covering the whole of Brno () were generated during testing of the algorithm. Two selected map sheets and the sheet with the legend are presented in Main Map. They are result of automated algorithm. No additional manual editing was done.
The first map sheet called ‘Railway Main Station’ (‘Hlavní nádraží’ in Czech) is an example of a map sheet from the city centre. Blocks of buildings (type ‘urban housing’), tram lines, railway and public transport stations are visible. The park with paths is located in the upper part of the map sheet. The second map sheet called ‘Park Street – Bridge’ (‘Most – Parková ulice’ in Czech) is an example of a map sheet from the suburbs. Most of the buildings are classified as ‘suburban housing’. A bridge, railway, the creek influent into the river and fields with paths can be seen on the map. The third sheet contains the legend for all map sheets in the version for sighted users. The legend for visually impaired users is similar but printed on more pages because of the extra space required for Braille font.
The legend cannot be part of each map sheet because of its large size. The space on the map sheet is very limited; thus, only information important to the visually impaired user is included. The Teiresias Centre did not require the inclusion of a scale bar and numeric scale. All map sheets have the same scale of 1:2500 and cover an area of 600 × 900 m. The Universal Transverse Mercator coordinate system (zone 33 North) with WGS84 ellipsoid was chosen for the map; however, this information is not included on the map sheet as it is not relevant to the user.
In contrast, the Teiresias Centre recommended the identification of the north direction on the map sheet because the correct orientation of the map is more important to visually impaired users than the exact measurement of length on the map. However, the classic North arrow is not ideal for visually impaired users (CitationBANA, 2012, Unit 8.5.8); thus, the north direction is identified by the row of points on the top of the map sheet.
3. Conclusion
The team at the Department of Geography implemented a partly automated mechanism for the generation of tactile maps from the official database of the national map agency. All results (scripts in Python, generated map sheets, manual, etc.) were conveyed to the Teiresias Centre.
Most situations on the map were resolved successfully. However, some complex situations could not be resolved automatically and manual editing is necessary after execution of scripts. This means that the algorithm could be improved. This could be the goal of further collaboration between the Department of Geography and the Teiresias Centre.
Software
Map sheet generation was implemented as a set of consecutively executed scripts in Python language. This system was prepared for the ArcGIS 10.1 environment with the use of ArcPy – a package for map production automation with Python.
Automated Generation of Tactile Maps.pdf
Download PDF (1.3 MB)Acknowledgement
We would have not accomplished our work without help from our colleagues from Department of Geography Lucie Friedmannová (map symbol preparation), Karel Staněk (Python language consultations) and Katka Tajovská (data analysis) and members of the Teiresias Centre Petr Červenka and Michaela Hanousková (both of them were consultants about tactile map design and map symbols and textures testing).
Disclosure statement
No potential conflict of interest was reported by the authors.
Additional information
Funding
Related Research Data
References
- BANA (2012). The Braille authority of North America. Guidelines and Standards for tactile Graphic. Web version: February 2012. Retrieved from http://www.brailleauthority.org/tg/web-manual/index.html
- Bodnárová, A. (2012). Tyflografické mapy v procesu prostorové orientace [Typhlographic maps in the process of spatial orientation] (Unpublished master's thesis). Masaryk University, Faculty of Science, Department of Geography, Brno, Czech Republic, 105 p. [ in Czech].
- Clark, D., & Clark, J. (1994). Creating tactile maps for the blind using a GIS. American Congress on Surveying and Mapping. Retrieved from http://hdl.handle.net/2014/32438
- Červenka, P. (1999). Mapy a orientační plány pro zrakově postižené [Maps and orientation plans for visual impaired]. Praha: Aula, 66 p. [ in Czech].
- Erharuyi, N., & Fairbairn, D. (2005). Task-centred adaptation of geographic information to support disaster management. In van P. Oosterom, S. Zlatanova, & E. M. Fendel (Eds.), Geo-information for disaster management (pp. 997–1008). Berlin: Springer.
- Huang, B. & Liu, N. (2004). Mobile navigation guide for the visually disabled. Journal of Transportation Research Board, 1885, 28–34. doi:10.3141/1885-05
- Jehoel, S., McCallum, D., Rowell, J., & Ungar, S. (2006). An empirical approach to the design of tactile maps and diagrams: The cognitive tactualization approach. British Journal of Visual Impairment, 24, 67–75. doi:10.1177/0264619606063402
- Jesenský, J. (1988). Hmatové vnímání informací s pomocí tyflografiky [Tactile perception of information using tyflographics]. Praha: Státní pedagogické nakladatelství, 226 p. [ in Czech].
- Johnson, K. O., & Phillips, J. R. (1981). Tactile spatial resolution I: Two-point discrimination, gap detection, grating resolution and letter recognition. Journal of Neurophysiology, 46, 1177–1191.
- Kubíček, P., Kozel, J., Štampach, R., & Lukas, V. (2013). Prototyping the visualization of geographic and sensor data for agriculture. Computers and Electronics in Agriculture, 97(9), 83–91. doi:10.1016/j.compag.2013.07.007
- Kubíček, P., Muličková, E., Konečný, M., & Kučerová, J. (2011). Flood management and geoinformation support within the emergency cycle (EU Example). In J. Hřebíček, G. Schimak & R. Denzer (Eds.), ISESS 2011, (pp. 77–86). Brno, Czech Republic.
- Kulyukin, V., Marston, J., Miele, J., & Kutiyanawala, A. (2010). Automated SVG map labeling for customizable large print maps for low vision individuals. RESNA Annual Conference. Las Vegas, Nevada: hh.
- Ladner, R., Ivory, M., Rao, R., Burgstahler, S., Comden, D., Hahn, S., … Croce, D. (2005). Automating tactile graphics translation. In Proceedings of the seventh international ACM SIGACCESS conference on computers and accessibility (pp. 50–57). Baltimore, MD. doi:10.1145/1090785.1090814
- Landau, S. (1999). Tactile graphics: Strategies for non-visual seeing. Thresholds, 19, 78–82.
- Miele, J., Landau, S., & Gilden, D. (2006). Talking TMAP: Automated generation of audio-tactile maps using Smith-Kettlewell's TMAP software. British Journal of Visual Impairment, 24, 93–100. doi:10.1177/0264619606064436
- Perkins, C. (2002). Cartography: Progress in tactile mapping. Progress in Human Cartography, 26, 521–530. doi:10.1191/0309132502ph383pr
- Řezník, T., Horáková, B., & Szturc, R. (2015). Advanced methods of cell phone localization for crisis and emergency management applications. International Journal of Digital Earth, 8, 259–272. doi:10.1080/17538947.2013.860197
- Růžičková, V., Stejskalová, K., Ludíková, L., Finková, D., Voženílek, V., Kozáková, M., & Šťávová, Z. (2009). Orientation and mobility of persons with visual impairment in the Czech Republic within the context of an evolving Europe. Conference report. ICEVI 2009, Dublin.
- Štampach, R., Kubíček, P., & Herman, L. (2015). Dynamic visualization of sensor measurements: Context based approach. Quaestiones Geographicae, 34(3), 117–128. doi:10.1515/quageo-2015-0020
- Stevens, J. C., Foulke, E., & Patterson, M. Q. (1996). Tactile acuity, aging and Braille reading in long-term blindness. Journal of Experimental Psychology: Applied, 2, 91–106. doi:10.1037/1076-898X.2.2.91
- Teiresias. (2015). Relief printing on microcapsule paper. Retrieved from http://www.teiresias.muni.cz/en/library-and-publishing/services/tactile-graphics/relief-print