
ABSTRACT
We report the results of geomorphological mapping of the high tablelands of Patagonia east of the Andes and between the Coyle and Gallegos river valleys. The map covers a low-relief area of about 3400 km2 at a scale of 1:85,000. It contributes to knowledge of a landscape shaped by lobes of the Patagonian ice sheet and can be used as a tool for further Quaternary studies. The map was built from remote-sensing data, compiled, and analyzed in geographical information system packages and supported by fieldwork. It features glacial landforms including moraine ridges and belts, ground moraine, outwash plains, outwash fans, meltwater channels, traces of glacial lakes, and erratic boulders. Fluvial, aeolian, and volcanic landforms and structural features were also mapped to provide a complete understanding of the landscape. We define three glacial units that record the frontal positions of former piedmont glaciers. The criteria used to define these units are the morphology, maximum relief, boulder content of moraine ridges, and crosscutting relations.
1. Introduction
The geomorphology of southern Patagonia offers clues for understanding Quaternary environmental change in southernmost South America. Glacial landforms and volcanic tablelands are very well preserved in this region due to the semiarid climate and low human modification of the landscape. They reveal an extraordinary record of alternating glaciations and volcanic episodes from 7 Ma to the Holocene (for complete syntheses see CitationRabassa, 2008 and CitationRutter, Coronato, Helmens, Rabassa, & Zárate, 2012).
The pioneering work of CitationNordenskjöld (1899), CitationCaldenius (1932), and CitationFeruglio (1950) established that the Patagonian tablelands of Argentina were at times covered by lobes of glacier ice flowing east from the Andes. Although early workers were unable to determine the ages of these glacial incursions, subsequent work has shown them to date to the Pliocene and Early Pleistocene (e.g. CitationMercer, 1976). Recent mapping based on readily available, high-resolution satellite imagery, and Digital Elevation Models (DEMs) have allowed geomorphologists and Quaternary geologists to analyze otherwise inaccessible areas and to improve interpretations formerly based on airphoto analysis (CitationDarvill, Stokes, Bentley, & Lovell, 2014; CitationGlasser & Janson, 2008; CitationLovell, Stokes, & Bentley, 2011). As a result of our work in the region (CitationBockheim, Coronato, Rabassa, Ercolano, & Ponce, 2009; CitationCoronato, Ercolano, Corbella, & Tiberi, 2013; CitationCoronato, Rabassa, & Meglioli, 2004), we wanted to increase knowledge of ancient piedmont glacial advances. The geomorphological map presented in this paper is a product of this effort. In addition to glacial landforms, we included fluvial, aeolian, volcanic, and structural landforms, and show their relationships to one another to provide a complete understanding of the landscape (see Main Map in Supplementary Material).
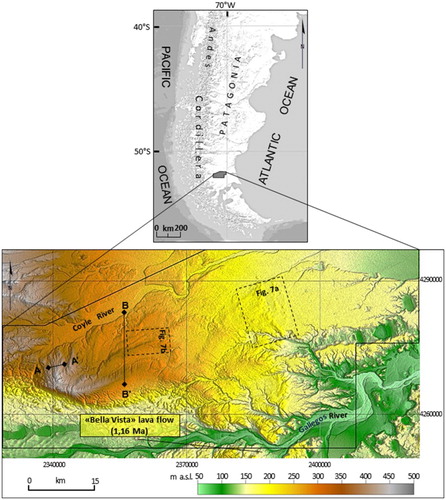
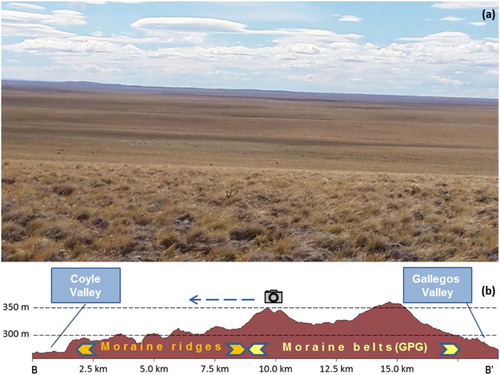
The study area is a tableland that extends up to 130 km east from the crest of the Andes between the Coyle and Gallegos river valleys (). Piedmont glaciers reached far from the Andes on this tableland. The area is part of an extensive physiographic unit known as Extra-Andean Patagonia, characterized by sedimentary and volcanic tablelands (‘mesetas’) that slope gently to the east and are dissected by a few east-trending valleys. Average elevations decline from 1000 m a.s.l. to less than 100 m a.s.l. from the Andes piedmont to the Atlantic coast. The present climate of this region is cold-temperate and semiarid and is affected by strong westerlies (mean speed: 4.6 m/s; maximum wind speed 360 m/s).
Figure 1. Location map of the study area. Topography is shown by shaded and colored SRTM elevation data. Topographic profiles along transects shown in and are noted and the position of the dated lava flow underlying the GPG (CitationMercer, 1976) till. Rectangles with dashes lines show the location and extent of subscenes of and .
Our study area encompasses the Pali Aike Volcanic Field (PAVF), which includes eruptive landforms produced by fissure and vent basaltic volcanism dating from the Pliocene to late Holocene (CitationCorbella, 2002). Some cones and lava flows have been overrun and eroded by ancient piedmont glaciers. Since glaciers last covered the area, the landscape has been modified by fluvial and aeolian erosion and deposition, periglacial activity, mass wasting, and volcanic activity (CitationCoronato et al., 2013).
2. Previous research on piedmont glaciations in southernmost Patagonia
Evidence of Middle Pleistocene glaciation on the tablelands at the east side of the Patagonian Andes between 46° and 52°S has been reported by several researchers. CitationCaldenius (1932) identified the limit of the Great Patagonian Glaciation (GPG, after CitationMercer, 1976), which CitationTon-That, Singer, Mörner, and Rabassa (1999) dated at 1.015–1.16 Ma based on 40Ar–39Ar on basalt. This event provides a baseline for identifying both older glaciations, with poorly known boundaries and younger, better delineated ones (CitationCoronato, Rabassa et al., 2004; CitationCoronato, Martínez, & Rabassa, 2004). Glacial advances assigned to the GPG and older events were recognized, dated and in some instances mapped by CitationCaldenius (1932); CitationFeruglio (1950); CitationFeck, Mercer, Nairn, and Peterson (1972); CitationMercer (1976); CitationMercer and Sutter (1982); CitationMörner and Sylwan (1989); CitationMeglioli (1992); CitationMalagnino (1995); CitationRabassa and Clapperton (1990); CitationStrelin (1995); CitationStrelin, Re, Keller, and Malagnino (1999); CitationWenzens (2000); CitationCoronato, Rabassa et al. (2004); CitationCoronato, Martínez et al. (2004); CitationSinger, Brown, Rabassa, and Guillou (2004); CitationSinger, Ackert, and Guillou (2004); CitationWenzens (2006); CitationGlasser and Janson (2008); CitationLagabrielle, Scalabrino, Suárez, and Ritz (2010); CitationLovell et al. (2011); CitationCoronato and Rabassa (2013); and CitationDarvill et al. (2014).
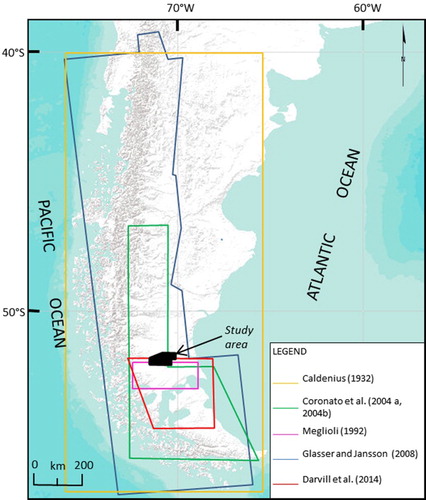
CitationMeglioli (1992) delineated the GPG in our study area based on mapping by CitationCaldenius (1932). He named it the ‘Bella Vista Glaciation’ and interpreted it to be the oldest and the most extensive piedmont glaciation in the region. More recently, CitationCoronato, Rabassa et al. (2004); CitationCoronato, Martínez et al. (2004); CitationGlasser and Janson (2008); CitationGlasser, Jansson, Harrison, and Kleman (2008) and CitationDarvill et al. (2014) digitized the most prominent features of the area at a broad scale, as part of a geomorphological regional map ().
Figure 2. Map of southern South America showing the extent of regional maps made by previous authors and the area mapped in this study.
3. Methodology
The map presented herein is based on spatial data interpretations and fieldwork. It was digitized from high-resolution satellite images available on the Google Earth platform combined with Landsat ETM+ and ASTER images. The map is presented at a scale of 1:85,000 to fit on A0 paper. The satellite imagery used in this study includes:
(1) SPOT 4 and SPOT 5, with a spatial resolutions of 2.5 m in bands 1–4. Dates: SPOT 4 – 2011/02/15; SPOT 5 – 2011/12/23 and 2012/01/22. Source: Google Earth™.
(2) Landsat ETM+ (Enhanced Thematic Mapper Plus), with a spatial resolutions of 30 m in bands 1–7 and 15 m in the panchromatic band (scene size: 180 km × 180 km). Date: 2002/02/21. Source: http://glovis.usgs.gov/.
(3) ASTER (Advanced Spaceborne Thermal Emission and Reflection Radiometer) with a spatial resolution of 15 m in VNIR bands 1 to 3 (scene size: 60 × 60 km). Date: 2007/03/07. Source: http://glovis.usgs.gov/.
The study area has low relief, therefore we used DEM-AR files provided by the Instituto Geográfico Nacional (National Geographical Service of Argentina) with a spatial resolution ∼45 m, based on Shuttle Radar Topography Mission data (30 m spatial resolution), for topographic support.
We processed Landsat ETM+ and ASTER images with ENVI version 4.3 software package, to enhance data prior to upload to the Google Earth platform and performing on-screen geomorphological mapping. Linear contrast stretch, histogram-equalized stretch and spatial filtering were used in image analysis. Hillslope shading at different sun angles was performed on DEMs to enhance low-relief features.
We initially digitized landscape elements as vector layers (.kmz) in Google Earth™ platform and then converted them to shape files (.shp) using Global Mapper version 15.2. We loaded shape files in to ESRI ArcMap version 9.2 to produce the final layout of the geomorphological map. The map projection is Gauss-Krüger, Zone 2, WGS 84 Datum. Several field verifications of preliminary maps were made during the 2013 and 2014 field campaigns.
4. Map features
Most of the mapped features are of glacial origin and include moraine ridges and belts, ground moraine, outwash plains and fans, meltwater channels, and glacial lake traces. Other landforms, which were mapped because of their importance for understanding landscape evolution, include gullies, closed basins, morphotectonic alignments, volcanic cones, and lava flows.
4.1. Glacial and meltwater landforms
In plan view, the glacial features are nested and oriented toward the northeast and have a lobate pattern; they decrease in elevation from 450 to 200 m a.s.l., as shown in .
4.1.1. Moraine ridges
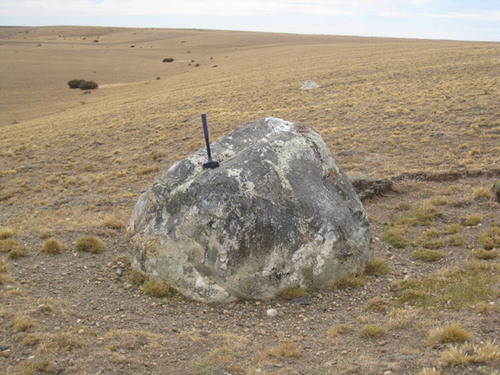
In the northern half of the map area, moraine ridges are individual elongate hills or aligned mounds. They are arcuate and appear to delineate the lobate form of a former glacier lobe. The terminal moraines have a maximum relief of 20 m and are 10s to 100s m wide and several kilometers long. They enclose recessional moraines, in contrast, thinner and sinuous or saw-toothed in plan view. The moraine field contains isolated erratic boulders and small fields of erratics ().
Figure 3. Isolated erratic boulders on a moraine ridge, most of them Andean in origin.
In the southern half of the map area, numerous prominent individual moraine ridges form two belts, 2–3 km in width ( and ). The belts have a festooned shape in plan view and a maximum relief of 25 m. Huge erratic boulders, some more than 10 m in length, are present. The moraine belts are severely gullied, particularly along the eastern side of the study area. Narrow outwash plains have developed between the belts. Basalt underlying the outer belt till, beyond the southeast boundary of the study area, have provided the maximum age for the GPG ().
Figure 4. Topographic profile across a moraine belt composed of prominent individual ridges. Transect A–A′ location is indicated in .
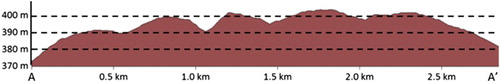
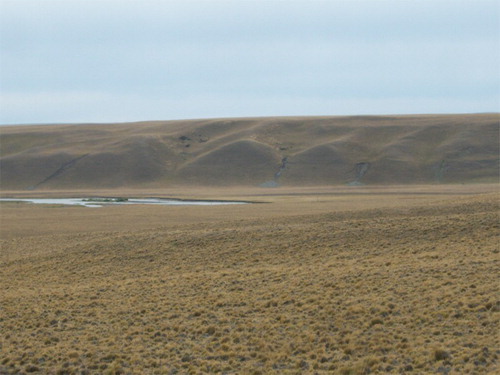
Figure 5. Morainal topography on the tablelands. (a) Gently undulating topography of moraine ridges seen from one of the moraine forming belts. (b) Terrain profile along the line of sight of (a). The relative level among these moraines is the largest in the glacial landscape.
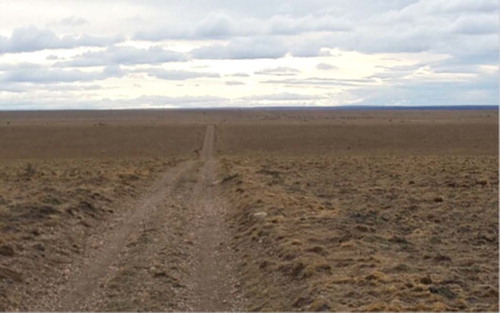
In the northeast corner of the map area, there is a lower set of ridges, about 10 m high and a few kilometers long (). Erratic boulders in this part of the map area are uncommon and generally smaller than 4 m in length; some are partially buried by till. These ridges are remnants of former continuous terminal and recessional moraines that were dissected by glacial meltwater streams.
Figure 6. Low, elongated and rounded frontal moraine ridge in the northeast corner of the study area (seen from east).
Crosscutting relations are apparent among the three morainal areas described above (). Based on the relations and the characteristics summarized in , we define three glaciogenic units and represent them with different colored polygons on the map.
Figure 7. Grayscale SRTM elevation data subscenes. (a) Crosscutting contacts between moraines of Glacial Unit I (I) and Glacial Unit II (II); note the smooth topography of Glacial Unit I. (b) Crosscutting contacts between moraines of Glacial Unit I (II) and moraines of Glacial Unit III (II). White arrows indicate where truncation can be clearly seen. Location shown in .
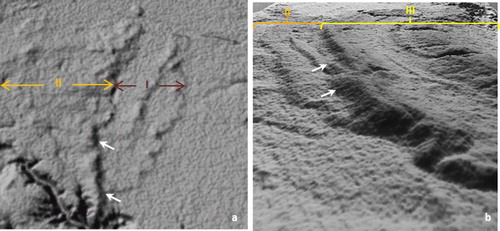
Table 1. Summary of ridge morphology and boulder content for moraines in the northeast corner and northern and southern halves of the map areas.
4.1.2. Ground moraine
Ground moraine within the map area forms flat to gently sloping, irregular surfaces with low relief. It is characterized by alternating small till mounds and hollows. Glaciofluvial and glaciolacustrine landforms are present within ground moraine areas. The ground moraine are represented by polygons that are lighter in color than moraine ridges.
4.1.3. Outwash plains
The Patagonian plains east of the Andes were sites of widespread proglacial meltwater deposition. Broad outwash plains extend far beyond the outermost moraines. The largest of these plains, at the northeast corner of the map area, has a uniform gradient of 0.06% and extends to 70°14′W, where its outwash gravel merges with that of the tableland. The morphology of the outwash plains is masked by up to 1 m of aeolian sands. The typical surficial drainage pattern of the outwash plains is suggested by the alignment of some small deflation basins following former meltwater courses. The outermost outwash plains are related to one or more distal moraines and are shown on the map with a neutral color. In contrast, the innermost outwash features are clearly nested into the moraines of Glacial Unit III (), and so are depicted with a yellow color.
4.1.4. Outwash fans
Outwash fans have a well-defined semi-conical shape and a gentle (0.10%), smooth gradient. They have a spatial relationship with moraines of Glacial Unit III and are shown as yellow polygons. They have been highly dissected by younger fluvial activity. We did not identify outwash fans related to Glacial Units I and II.
4.1.5. Meltwater channels
Ancient meltwater channels extend from former ice margins. They are represented on the map as lines with arrows pointing in the downstream direction. Glaciofluvial processes during successive glaciations eroded and covered parts of the previous glacial landscape with sand and gravel. Most of these former watercourses contain no streams, setting them apart from contemporary deep and wide waterways.
4.1.6. Glacial lake traces
We identified a few former glacial lakes using DEM data, verified them in the field, and recorded them as polygons on the map. The largest, at the southeastern side of the map area, is probably a moraine-dammed lake. Its floor has been deeply incised due to headward gully erosion. Small basins have been deflated on its dry surface.
4.2. Fluvial landforms
Features formed by fluvial erosion are valleys up to 10 m deep and 100s m wide. They have straight sections that are possibly fault-controlled. They form part of the dense and ephemeral drainage network of the Coyle and Gallegos rivers. Only the major valleys were mapped as polygons.
4.3. Hydro-aeolian landforms
Closed depressions 10s of meters deep and 0.1–6 km2 in area are informally known in the region as ‘bajos sin salida’. The largest basins have been eroded in the sedimentary rock underlying the tableland and are located at the eastern side of the map area, beyond the limit of glaciation. The smallest basins appear to be kettles within the moraine belts. The highest density of small basins is found on the outwash plains. The aeolian mantles or elongate dunes on the down-wind side of many of the large basins indicate that they are aeolian in origin. Some of them follow ancient drainage lines. The large depressions contain temporary shallow water bodies and are fed by ephemeral streams, and eventually by groundwater. We do not distinguish between different types of closed basins on the map; rather we show them with a single polygon symbol.
4.4. Structural lineaments
The principal fault systems on the map area strike in a northwest direction. Younger faults strike west and west-southwest. (CitationCorbella, 2002). Most of the Neogene and Quaternary eruptive activity in the area is localized along these structures. The fault systems appear in false-color images and DEMs as rectilinear lineaments.
The main fault extends in a northwest direction along the north margin of the Gallegos river valley. It is marked in the field by a 60 m-high scarp that is masked in most places by slump blocks; a few triangular facets are visible (). The Gallegos valley is tectonic in origin and part of a rift system that opened at the southern tip of Patagonia during the Neogene (CitationDiraison, Cobbold, Gapais, & Rosello, 1997). It is also the southern boundary of the glacial landscape of the tablelands. The Gallegos valley fault is represented by a line with triangles pointing toward the hanging wall. Other structural lineaments are delineated with dashed lines.
Figure 8. Fault scarp along the northern margin of the Río Gallegos valley, where triangular facets are still recognizable.
4.5. Volcanic landforms
Scoria cones, small lava flows, and a maar edifice are the main mapped volcanic features. These features are part of the PAVF which has been active since the Pliocene (CitationCorbella, 2002).
4.5.1. Scoria cones
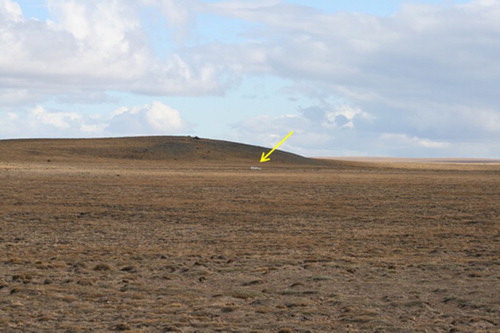
A few isolated scoria cones have heights of 100–200 m and are products of Strombolian eruptive activity and are mapped as points. Most of them have lost their original conical shape and, in some cases, have been almost leveled by erosion (). They were degraded during glacial periods and by cryogenesis when the area was a periglacial environment (CitationBockheim et al., 2009).
Figure 9. Scoria cone overrun by glaciers and degraded by cryogenic processes. A huge erratic boulder at the slope foot is pointed out by the arrow.
4.5.2. Maars
Over 100 maars are present in the PAVF (CitationCorbella, 2002). A large maar with an elliptical shape is located near the center of the map area, just down-ice from a terminal moraine. A remnant of the tephra rim is preserved as a rounded hill east of the maar depression, suggesting strong westerly winds during the eruption. The depression and the tephra hill are shown as polygons.
4.5.3. Lava flow fields
Lava flow fields are formed of multiple lava flows that built plateaus. The flows cover the emission centres that fed them. We delineated the buried remnants of lava flow fields with lines. In contrast, lava flows that are partially or fully exposed, are represented by polygons.
5. Conclusion
The availability of high-resolution satellite data, both multiband images and DEMs, supported in a geographical information system (GIS) allowed us to construct a detailed geomorphological map of a low relief, formerly glaciated landscape with few natural or anthropic subsurface exposures The map, produced at a scale of 1:85,000, records the extent of former lobes of the Patagonian ice sheet on the tableland between the Coyle and Gallegos rivers in southernmost Patagonia. Mapped landforms produced by glacial, fluvial, aeolian, volcanic, and tectonic processes provide a framework for further analyses of landscape evolution.
Three glacial units of different ages were identified on the basis of the morphology, maximum relief, and boulder content of moraine ridges, coupled with crosscutting contacts. The moraine belts and ridges of Glacial Units II and III have an arcuate, lobular pattern reflecting ice flow from the southwest.
The two moraine belts that we identified record the GPG (Unit III). In front of them are terminal and recessional moraines associated with more extensive, pre-GPG glacier advances (Units I and II).
Software
The landforms have been digitalized using the Google Earth platform. DEM processing and topographic profiles were constructed using Global Mapper version 15.2. ENVI version 4.3 was used to process Landsat ETM+ and ASTER imagery. The final layout of the map was produced in ESRI ArcMap version 9.2.
Glacial geomorphology of the tableland east of the Andes between the Coyle and Gallegos river valleys, Patagonia, Argentina.pdf
Download PDF (21.5 MB)Acknowledgements
We deeply thank Jorge Rabassa (CADIC-CONICET) for his helpful comments and suggestions that improve the text on an earlier version of the manuscript. We are also grateful to Elizabeth Mazzoni and Daniel Grima (ICASUR-UNPA) for their cartographic advice, and to the owners and administrators of Sofía, Bella Vista and Alquinta ranches, who facilitated access to their fields and private roads. We wish to thank the peer reviewers Ch. Darvill, A. Hein, and Ch. Jayasuriya for their helpful comments that improved the text and the map. We express our gratitude to John Clague (Simon Fraser University) who kindly improved the English style of the final version of the manuscript.
Disclosure statement
No potential conflict of interest was reported by the authors.
Additional information
Funding
Related Research Data
References
- Bockheim, J., Coronato, A., Rabassa, J., Ercolano, B., & Ponce, J. (2009). Relict sand wedges in southern Patagonia and their stratigraphic and paleo-environmental significance. Quaternary Science Reviews, 28, 1188–1199. doi:10.1016/j.quascirev.2008.12.011
- Caldenius, C. Cz. (1932). Las glaciaciones cuaternarias en la Patagonia y Tierra del Fuego. Geografiska Annaler, 14, 1–164. doi: 10.2307/519583
- Corbella, H. (2002). El campo volcano-tectónico de Pali Aike. In M. Haller (Eds.), Geología y recursos naturales de santa cruz (pp. 285–302). Buenos Aires: Asociación Geológica Argentina.
- Coronato, A., Ercolano, B., Corbella, H., & Tiberi, P. (2013). Glacial, fluvial and volcanic landscape evolution in the Laguna Potrok Aike maar area, southernmost Patagonia, Argentina. Quaternary Science Reviews, 71, 13–26. doi:10.1016/j.quascirev.2012.06.019
- Coronato, A., Martínez, O., & Rabassa, J. (2004). Pleistocene glaciations in Argentine Patagonia, South America. In J. Ehlers & P. Gibbard (Eds), Quaternary glaciations – extent and chronology. Part III (pp. 49–67). Amsterdam: Quaternary Book Series, Elsevier. doi:10.1016/s1571–0866(04)80111–8
- Coronato, A., & Rabassa, J. (2013). Middle pleistocene glaciations in the Southern Hemisphere. In S. A. Elias (Ed.), The encyclopedia of quaternary science (Vol. 2, pp. 187–190). Amsterdam: Elsevier.
- Coronato, A., Rabassa, J., & Meglioli. (2004). Glaciations in the Magellan straits and Tierra del Fuego, Southernmost South America. In J. Ehlers & P. Gibbard (Eds.), Quaternary glaciations – extent and chronology. Part III (pp. 45–48). Amsterdam: Quaternary Book Series, Elsevier. doi:10.1016/s1571–0866(04)80111–8
- Darvill, C. M., Stokes, C. R., Bentley, M. J., & Lovell, H. (2014). A glacial geomorphological map of the southernmost ice lobes of Patagonia: The Bahía Inútil–San Sebastián, Magellan, Otway, Skyring and Río Gallegos lobes. Journal of Maps, 1–21. doi:10.1080/17445647.2014.890134
- Diraison, M., Cobbold, P. R., Gapais, D., & Rosello, E. A. (1997). Magellan strait: Part of a Neogene rift system. Geology, 25, 703–706. doi:10.1130/0091-7613(1997)025<0703:MSPOAN>2.3.CO;2
- Feck, R. J., Mercer, J. H., Nairn, A. E. M., & Peterson, D. M. (1972). Chronology of late pliocene and early pleistocene glacial and magnetic events in southern Argentina. Earth and Planetary Science Letters, 16, 15–22. doi:10.1016/0012-821X(72)90231-2
- Feruglio, E. (1950). Descripción Geológica de la Patagonia. Dirección General Y.P.F., Tomos 1-3, 430 pp. Buenos Aires.
- Glasser, N., & Janson, K. (2008). The glacial map of southern South America. Journal of Maps, 4, 175–196. doi:10.4113/jom.2008.1020
- Glasser, N. F., Jansson, K. N., Harrison, S., & Kleman, J. (2008). The glacial geomorphology and pleistocene history of South America between 38°S and 56°S. Quaternary Science Reviews, 27, 365–390. doi:10.1016/j.quascirev.2007.11.011
- Lagabrielle, Y., Scalabrino, B., Suárez, M., & Ritz, J. F. (2010). Mio-Pliocene glaciations of Central Patagonia: New evidence and tectonic implications. Andean Geology, 37, 276–299. doi:10.5027/andgeoV37n2-a02
- Lovell, H., Stokes, C. R., & Bentley, M. J. (2011). A glacial geomorphological map of the seno skyring-seno otway-strait of Magellan region, southernmost Patagonia. Journal of Maps, 7, 318–339. doi:10.4113/jom.2011.1156
- Malagnino, E. (1995). The discovery of the oldest extra-andean glaciation in the Lago Buenos Aires Basin, Argentina. Quaternary of South America and Antarctic Peninsula, 9, 69–83.
- Meglioli, A. (1992). Glacial geology of Southernmost Patagonia, the Strait of Magellan and Northern Tierra del Fuego (Unpublished doctoral dissertation). Lehigh University, Bethlehem, Pennsylvania, USA.
- Mercer, J. (1976). Glacial history of Southernmost South America. Quaternary Research, 6, 125–166. doi:10.1016/0033–5894(76)90047–8
- Mercer, J., & Sutter, J. (1982). Late miocene – earliest pliocene glaciation in southern Argentina: implications for global ice-sheet history. Palaeogeography, Palaeoclimatology, Palaeoecology, 38, 185–206. doi:10.1016/0031-0182(82)90003-7
- Mörner, N., & Sylwan, C. (1989). Magnetostratigraphy of the Patagonian moraine sequence at Lago Buenos Aires. Journal of South American Earth Sciences, 2, 385–389. doi:10.1016/0895-9811(89)90016-3
- Nordenskjöld, O. (1899). Geologie, geographie und anthropologie. Schwedischen expedition nach den magellansländern, 1895–1897. Stockholm: Norstedt and Söner.
- Rabassa, J. (2008). Late Cenozoic glaciations in Patagonia and Tierra del Fuego. In J. Rabassa (Ed.), Developments in quaternary sciences (pp. 151–204). Amsterdam: Elsevier. doi:10.1016/s1571-0866(07)10008-7
- Rabassa, J., & Clapperton, Ch. (1990). Quaternary glaciations of the Southern Andes. Quaternary Science Reviews, 9, 153–174. doi: 10.1016/0277-3791(90)90016-4
- Rutter, N., Coronato, A., Helmens, K., Rabassa, J., & Zárate, M. (2012). Glaciations in North and South America from the Miocene to the last glacial maximum. Comparisons, linkages and uncertainties. Dordrecht: Springer Briefs in Earth System Sciences, 67. doi:10.1007/978-94-007-4399-1
- Singer, B. S., Brown, L. L., Rabassa, J. O., & Guillou, H. (2004). 40Ar/39Ar chronology of late pliocene and early pleistocene geomagnetic and glacial events in southern Argentina, in timescales of the paleomagnetic field. In J. E. T. Channell, D. V. Kent, W. Lowrie, & J. G. Meert (Eds.), Timescales of the paleomagnetic field (pp. 173–190). Washington, DC: American Geophysical Union. doi:10.1029/145GM13
- Singer, B. S., Ackert, R. P., & Guillou, H. (2004). 40Ar/39Ar and K-Ar chronology of pleistocene glaciations in Patagonia. Geological Society of America Bulletin, 116, 434–450. doi:10.1130/b25177.1
- Strelin, J. (1995). New evidence on the relationships between the oldest extra-andean glaciations in the Río Santa Cruz area. Quaternary of South America and Antarctic Peninsula, 9, 105–116.
- Strelin, J., Re, G., Keller, R., & Malagnino, E. (1999). New evidence concerning the plio-pleistocene landscape evolution of southern Santa Cruz region. Journal of South American Earth Sciences, 12, 333–341. doi:10.1016/S0895-9811(99)00022-X
- Ton-That, T., Singer, B., Mörner, N. A., & Rabassa, J. (1999). Datación por el método 40Ar/39Ar de lavas basálticas y geología del Cenozoico Superior en la región del Lago Buenos Aires, provincia de Santa Cruz, Argentina. Asociación Geológica Argentina, Revista, 54, 333–352.
- Wenzens, G. (2000). Pliocene piedmont glaciation in the Río Shehuen valley, southwest Patagonia, Argentina. Arctic, Antarctic and Alpine Research, 32, 46–54. Retrieved from http://www.jstor.org/stable/1552409 doi: 10.2307/1552409
- Wenzens, G. (2006). Terminal moraines, outwash plains and lake terraces in the vicinity of Lago Cardiel (49°S, Patagonia, Argentina): Evidence for Miocene Andean foreland glaciation. Arctic, Antarctic and Alpine Research, 38, 276–291. doi:10.1016/j.yqres.2006.06.001