
ABSTRACT
The conservation of soil resources is increasingly becoming a critical issue worldwide, with growing interest in carbon stocks and water storage within the soil. Hungary is no exception, and there has been a demand for a country level soil erosion map that incorporates digital information available from the latest surveys and digital mapping campaigns. The map presented in this paper in based on the extremely wet year of 2010, and thus provides users a 1:100,000 scale ‘worst case scenario’ of soil erosion risk in Hungary (see Main Map). Results from both the Universal Soil Loss Equation and the Pan-European Soil Erosion Risk Assessment models were combined in order to achieve a map that can be used by a wide range of professionals. Both models estimate soil erosion by water in tonnes per hectare per year.
1. Introduction
Soil erosion by water is a natural process driven, primarily by precipitation and topography. It is also influenced by other factors, such as soil characteristics, surface cover, temperature and land use practices. The European Commission recognized soil erosion as one of the main threats to soil resources in its Thematic Strategy on Soil Protection (Citation2002).
There are a variety of approaches for mapping soil erosion susceptibility. The first widely used method for soil loss calculation was the Universal Soil Loss Equation (USLE) model created by CitationWischmeier and Smith (1978). Their work calls attention to the importance of local measurements and parametrization of the USLE model in order to reach proper values during the use of the model. The most important improvement to the model was the conversion of the dimensions from US to SI units (CitationFoster, McCool, Renard, & Moldenhauer, 1981). Many scientists are using the USLE model for various purposes, even in situations, where in situ data are lacking. CitationBaban and Wan Yusof (2001) used the USLE model to prepare an erosion risk map for Langkaey Island of Malaysia. CitationLahloi, Rhinane, Hilali, Lahssini, and Khalile (2015) used the USLE with remote sensing for potential erosion risk calculations in Morocco. USLE, and its revised version RUSLE, are used mainly for estimation of the yearly amount of soil loss in tonnes per hectare per year (t/ha/y) (CitationChen et al., 2010; CitationDoğan et al., 2015; CitationFantappiè, Priori, & Costantini, 2014).
Input parameters of USLE and its developed versions MUSLE (CitationOdongo, Onyando, Mutua, van Oel, & Becht, 2013; CitationSadeghi et al., 2007) and RUSLE (CitationConforti et al., 2015) have been thoroughly studied as summarized in .
Table 1. Studies on USLE input parameters.
As emphasized by CitationWischmeier and Smith (1978), in situ analyses of the modelled values should not normally be avoided. Many good examples for this practice exist: for example, CitationMagliulo (2010) integrated the analysis of aerial photos and topographic maps with field observations. In the case of Hungary, however, there is a lack of a harmonized, country-wide erosion monitoring network that could support the appropriate validation of such model results (CitationKertész & Centeri, 2006). Such works, therefore, are limited to the use of relatively well-established models and the use of cross-validation between different modelling results.
The Pan-European Soil Erosion Risk Assessment (PESERA) model was developed for rill and inter-rill erosion estimates, primarily for applications at a regional scale, with a focus on Europe-wide input data availability (CitationKirkby, Irvine, Jones, & Govers, 2008). As opposed to the USLE, it is a process-based model, and has a significantly higher demand for input data, with a possible total of 128 data layers (CitationIrvine & Kosmas, 2003). The model breaks up precipitation into overland flow, evapotranspiration and soil moisture. A generic model is used to calculate plant growth based on transpiration and land use information. The total amount of erosion is calculated based on soil erodibility, slope parameters and overland flow (CitationKirkby et al., 2008).
Hungary has a rich heritage of soil maps, with multiple mapping campaigns carried out over the twentieth century (CitationVárallyay, 2002). However, the assessment of soil erosion was not the main purpose of these campaigns and therefore the first national level map of soil erosion was only published in the 1960s (CitationStefanovits, 1964).
With the advancement of computers and information systems, it later became possible to apply erosion models at a national scale. CitationCenteri and Pataki (2000) applied the USLE at 1:100,000 scale for Hungary based on currently available spatial data layers.
Unfortunately, there is limited availability of continuous in situ monitoring data on soil erosion in Hungary (CitationKertész & Centeri, 2006). This limits the reliability of such models, but also raises the importance of cross-validation and the use of reliable, well-established models, such as the USLE and the PESERA models (CitationGobin, Govers, & Kirkby, 2006)
The aim of the work presented here was to develop an up-to-date soil erosion map for the whole area of Hungary, using a combination of the two methods discussed above, thus providing a common reference for future work in the field. There is a significant increase in the occurrence of extreme precipitation events in Europe in recent decades (CitationAlexander et al., 2006; CitationKlein Tank & Können, 2003; CitationZolina, Simmer, Belyaev, Kapala, & Gulev, 2009). Soil water erosion research should therefore focus on high precipitation years because they are when most of the severe soil erosion events will occur (Citationvan den Besselaar, Klein, Tank, & Buishand, 2012). Because it was a year with extreme precipitation rates (CitationBissolli, Friedrich, Rapp, & Ziese, 2011), 2010 was selected as the baseline year.
2. Materials and methods
2.1. USLE input data
In order to achieve compatibility between the two models, the same data sources were used as input data in both cases. The target cell size for the map grid was 100 m × 100 m. presents the maps for the input factors used for the USLE model. The model area itself covers the whole of Hungary (approximately 93,000 km2).
Figure 1. Maps of USLE input factors.
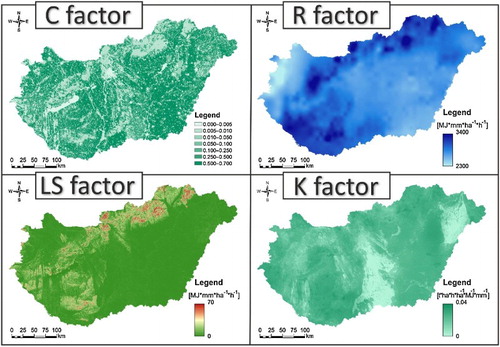
Climatic information was derived primarily from the CARPATCLIM database (CitationSzalai et al., 2013), with the addition of AGRI4CAST MARS data (https://ec.europa.eu/jrc/en/mars) where the former was not available. Where the data were not directly available from the dataset, it was calculated from the source data. For the USLE model, mean monthly rainfall data were used as a basis for calculating the R factor.
EU-DEM (CitationBashfeld & Keim, 2011) was used for the calculation of the terrain characteristics. In the USLE model, the LS factors describe the effect of topography on soil erosion, which combines slope length (L) and slope gradient (S). The LS factor was calculated using Moore’s method (CitationMoore, Grayson, & Ladson, 1991) in SAGA GIS.
For land use related layers, the 100 m resolution CORINE Land Cover (CLC2006) dataset was used, with maize as a default crop cover for arable land.
Soil-related parameters were derived from the Digital Kreybig Soil Information System (DKSIS; CitationPásztor, Szabó, Bakacsi, Matus, & Laborczi, 2012) and Hungarian Soil Information and Monitoring System (SIMS; CitationVárallyay, 2002) databases. Both USLE and PESERA models require different soil property maps to calculate the soil-related parameters. These maps were created using digital soil mapping (DSM) methods – these are spatially exhaustive, environmental auxiliary variables related to soil forming processes for the spatial inference of point data (CitationMcBratney, Mendonça-Santos, & Minasny, 2003). The most commonly used environmental covariates refer to topography, climate, lithology, land cover and land use. The soil-landscape relation can be modelled by geostatistical and data-mining methods. In the present study we used regression kriging, a method widely used in DSM. Regression kriging is a spatial prediction technique that combines the regression of the dependent variable on auxiliary variables with kriging of the regression residuals (CitationHengl, Heuvelink, & Rossiter, 2007).
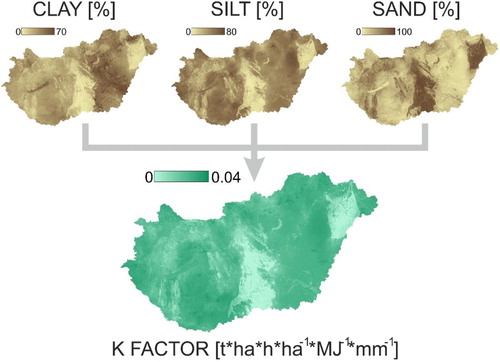
In the USLE model, the K factor characterizes soil erodibility, which means the susceptibility of the soil to erosion by rainfall and runoff. Soil erodibility is primarily determined by particle size and organic matter content. A numeric estimation of K can be calculated by the following formula (CitationSharply & Williams, 1990), where SAN, SIL, CLA and OM are the sand, silt, clay and organic matter content of the soil and SN1 = 1−SAN/100 (see also ).The following soil property maps were compiled to satisfy the demands of the USLE and PESERA models: particle size distribution maps (percentage sand, silt and clay), organic matter content and carbonate content according to the objectives of the DOSoReMI.hu initiative (CitationPásztor et al., 2015). The particle size maps were compiled using SIMS as a reference data source (see CitationLaborczi, Szatmári, Takács, & Pásztor, 2015); the soil organic content and carbonate content maps were created based on the data of DKSIS.
Figure 2. Input data used for the calculation of the USLE K factor.
2.2. PESERA input data
Data sources for the PESERA model were the same as used for the USLE model input parameters, unless stated otherwise.
The PESERA model grid cell size had to be reduced to 120 m × 120 m due to limitations in the model. The output was later resampled to match the USLE output grid.
The PESERA model required the following climate data for input: mean monthly rainfall, mean monthly rainfall per rain day, coefficient of variation of monthly rainfall per rain day, mean monthly temperature and monthly temperature range.
The topographic factor of PESERA focuses on the effect of local relief on soil erosion. The topographic factor is derived from the standard deviation of elevation within a 1.5 km distance around each cell.
For land use related layers, the 100 m resolution CORINE Land Cover (CLC2006) dataset was used, based on the PESERA manual (CitationIrvine & Kosmas, 2003). In the case of arable land, maize was used as the crop cover.
In the PESERA model, the soil parameter is more complex and is composed of multiple factors. Soil erodibility is the most important factor, which characterizes the sensitivity of a soil to erosion. Soil erodibility is primarily related to soil texture, but it is also affected by organic matter and carbonate content. The erodible fraction (EF) was calculated by the following formula (CitationFryrear et al., 2000), where SAN, SIL, OM, CaCO3 are the sand, silt, clay, organic matter and carbonate content and Sc is the ratio of sand to clay content.The mechanical impact of raindrops leads to soil surface crusting, which determines the lower limit of water storage capacity. The soil crust factor (SCF) is affected mostly by the clay content and organic matter content of the soil. This was calculated according to CitationFryrear et al. (2000):
where CLA and OM are the clay content and the organic matter content.
The readily available soil water capacity provides the maximum storage capacity of the soil before runoff. PESERA derives this complex soil feature from three components: soil water available to plants, effective soil water capacity and scale depth. The applied Hungarian soil profile databases do not contain information on these parameters. To achieve the necessary input at the proper spatial resolution the original European PESERA data layers were downscaled. Virtual reference point sets were created by point sampling the low resolution maps. Ten points per 100 km2 were randomized in the geographical space, representing virtual sampling locations. Conditional generalization was applied, prescribing a minimum spacing of 100 m (equal to the cell size applied in spatial modelling) between the generated points. The values of the dependent (predicted) and independent (predictor) variables were identified at the randomized locations and their records were used in the further spatial inference. Since all three parameters were quantitative, regression kriging was also applied in the disaggregation process.
3. Results
3.1. Running the models
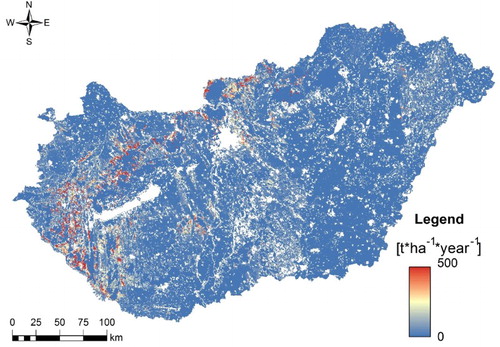
Both the USLE and the PESERA models have been applied for the year 2010. Due to the extreme precipitation rates of that year, the output layers of both models represent a ‘worst case scenario’ from a climatic point of view for soil erosion potential in Hungary. The extreme precipitation represents a 20 year return frequency. The models are limited by a lack of information for arable land. We can only prepare scenarios for a given crop, crop rotation or land cover for arable areas as the exact crop rotation information is not available at a national scale. In this present case, the C factor of maize was applied, which represents a ‘worst case scenario’.
Raw, unclassified output results from the USLE and PESERA models are presented in and , respectively. Since both methods provided the output as t/ha/y, soil loss comparison and combination of the two maps is possible.
Figure 3. Output results from the USLE model.
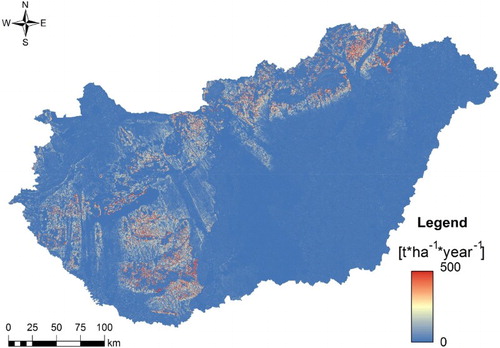
Figure 4. Output results from the PESERA model.
3.2. Harmonization of model results
In order to provide one unified map of results, a simple ensemble model was applied. The mean value of the two output maps was calculated for each grid cell. Detailed analysis of the differences between results is beyond the scope of the present work and will be published as a separate study.
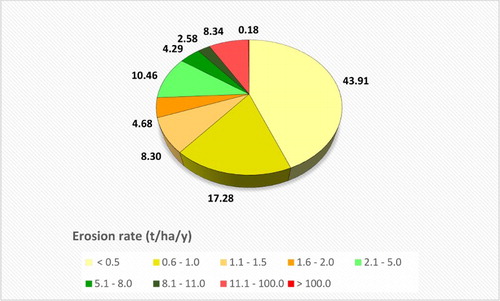
presents the areas affected by soil erosion as a percentage of Hungary’s total land area. About 74% of the area is affected only weakly, 18% is moderately affected, and only about 8% is affected by strong erosion.
Figure 5. Spatial extent of erosion categories in Hungary (as % of total area).
The resulting map – the main result of the present study (see Main Map) – provides an overview not only of the rate of erosion in Hungary, but also its spatial distribution. Looking at the map it is clear how the values presented in relate to Hungary’s geography. As expected, high erosion rates mostly occur in mountainous and hilly regions, such as Northern Hungary, or Southern Transdanubia. The latter shows the highest erosion rates in some areas. This is due to the fact that the mountains in the north have greater forest coverage, while in the south many hills are cultivated. The Great Plain in general shows low erosion rates, with a few regions where mostly sandy soils dominate. The large area covered by the plains explains the high percentage of area affected only by low erosion rates, while it is clear that in the hills and mountains erosion rates are significantly higher.
4. Conclusions
The map presented here is the first attempt in Hungary to provide a model-based soil erosion map at the national level, combining two previously applied methods. The use of a harmonized input data set provided a base for comparison and synthesis of the two methods.
The results show that about 26% of the country’s total area is prone to moderate to high erosion rates. The map presented here supports previous studies, presenting a distribution of erosion risk that is similar to earlier works in both spatial patterns and magnitude. The new map is more detailed and the use of the best available data sets also makes it more reliable. Nevertheless, it should be noted that in order to provide a more dependable output, field validation of the model results would be required. To be able to do that, a country-wide network of erosion monitoring sites is needed as this does not presently exist in Hungary.
Future research will focus on a more detailed evaluation of combining the two models, with special focus on field validation of the modelled results, and on local discrepancies.
Software
SAGA GIS 2.2.0 (CitationBöhner, McCloy, & Strobl, 2006) was used for the preparation of data layers. Esri ArcGIS 9.0 and ArcInfo Workstation 9.0 were used for running the PESERA model, including pre- and post-processing. Spatial analysis and map layout compilation were carried out in Esri ArcGIS 10.3.
Soil erosion of Hungary assessed by spatially explicit modelling.pdf
Download PDF (12 MB)Disclosure statement
No potential conflict of interest was reported by the authors.
Additional information
Funding
Related Research Data
References
- Alexander, L., Zhang, X., Peterson, T., Caesar, J., Gleason, B., Klein Tank, A., … Griffiths, G. (2006). Global observed changes in daily climate extremes of temperature and precipitation. Journal of Geophysical Research, 111, D05, 109. doi:10.1029/2005JD006290
- Alexandridis, T. K., Sotiropoulou, A. M., Bilas, G., Karapetsas, N., & Silleos, N. G. (2014). The effects of seasonality in estimating the C-factor of soil erosion studies. Land Degradation and Development, 26(6), 596–603. doi:10.1002/ldr.2223
- Alkharabsheh, M. M., Alexandridis, T. K., Bilas, G., Misopolinos, N., & Silleos, N. (2013). Impact of land cover change on soil erosion hazard in northern Jordan using remote sensing and GIS. Procedia Environmental Sciences, 19, 912–921. doi: 10.1016/j.proenv.2013.06.101
- Ambar, S., & Wiersum, K. F. (1980). Comparison of different erodibility indices under various soil and land use conditions in West Java. Indonesian Journal of Geography, 1, 1–15.
- Auerswald, K., Kainz, M., Angermüller, S., & Steindl, H. (1996). Influence of exchangable potassium on soil erodibility. Soil Use and Management, 12, 117–121. doi: 10.1111/j.1475-2743.1996.tb00531.x
- Baban, S. M. J., & Wan Yusof, K. (2001). Modelling soil erosion in tropical environments using remote sensing and geographical information systems. Hydrological Sciences Journal, 46(2), 191–198. doi: 10.1080/02626660109492815
- Bashfeld, A., & Keim, A. (2011, April 10–15). Continent-wide DEM creation for the European Union. 34th International Symposium on Remote Sensing of Environment, Sydney, Australia.
- Basic, F., Kisic, I., Mesic, M., Nestroy, O., & Butorac, A. (2004). Tillage and crop management effects on soil erosion in central Croatia. Soil and Tillage Research (Soil Quality as an Indicator of Sustainable Tillage Practices), 78(2), 197–206.
- van den Besselaar, E. J. M., Klein Tank, A. M. G., & Buishand, T. A. (2012). Trends in European precipitation extremes over 1951–2010. International Journal of Climatology. doi:10.1002/joc.3619.
- Biscaia, R. C., Rufino, R. L., & Henklain, J. C. (1981). Estimation of soil erodibility factor (K factor) in two soils of Parana state. Revista Brasileira de Ciência do Solo, 5(3), 183–186.
- Bissolli, P., Friedrich, K., Rapp, J., & Ziese, M. (2011). Flooding in eastern central Europe in May 2010 – reasons, evolution and climatological assessment. Weather, 66(6), 147–153. doi: 10.1002/wea.759
- Bolline, A., Laurant, A., Rosseau, P., Pauwels, J. M., Gabriels, D., & Aelterman, J. (1980). Provisional rain erosivity map of Belgium. In M. DeBoodt, & D. Gabriels (Eds.), Assessment of erosion. (pp. 111–120). Chichester: John Wiley & Sons.
- Böhner, J., McCloy, K. R., & Strobl, J. (Eds.). (2006). SAGA – Analysis and modelling applications. Göttinger Geographische Abhandlungen, 115.
- Centeri, C. S., & Pataki, R. (2000, September 2–6). Erosion map of Hungary. Proceedings of the Conference on Environmental Management of the Rural Landscape in Central and Eastern Europe, Podbanske, Slovakia, 20–22.
- Chang, W. W., Hromadka, T. V., & Chang, H. H. (2011). Calibrating the USLE P-factor using program FLUVIAL-12. Journal of Soil and Water Conservation, 66(2), 40A–44A. doi: 10.2489/jswc.66.2.40A
- Chen, T., Niu, R., Wang, Y., Li, P., Zhang, L., & Du, B. (2010). Assessment of spatial distribution of soil loss over the upper basin of Miyun reservoir in China based on RS and GIS techniques. Environmental Monitoring and Assessment. doi:10.1007/s10661-010-1766-z
- Conforti, M., Buttafuocoa, G., Ragob, V., Aucellic, P. P. C., Robustellib, G., & Scarciglia, F. (2015). Soil loss assessment in the Turbolo catchment (Calabria, Italy). Journal of Maps. doi:10.1080/17445647.2015.1077168
- Desmet, P. J. J., & Govers, G. (1996). A GIS procedure for automatically calculating the USLE LS factor on topographically complex landscape units. Journal of Soil and Water Conservation, 51(5), 427–433.
- Doğan, H. M., Kılıç, O. M., Yılmaz, D. S., Buhan, E., Polat, F., & Buhan, S. D. (2015). Integration of GIS and remote sensing with the USLE model in the assessment of annual soil loss and sediment input of Zinav Lake basin in Turkey. Fresenius Environmental Bulletin, 24(1a), 172–179.
- European Commission. (2002). Communication of 16 April 2002 from the Commission to the Council, the European Parliament, the Economic and Social Committee and the Committee of the Regions: Towards a thematic strategy for soil protection. COM 2002, 179final.
- Fantappiè, M., Priori, S., & Costantini, E. A. C. (2014). Soil erosion risk, Sicilian Region (1:250,000 scale). Journal of Maps, 11(2), 323–341. doi: 10.1080/17445647.2014.956349
- Folly, A., Bronsveld, M. C., & Clavaux, M. (1996). A knowledge-based approach for C-factor mapping in Spain using Landsat TM and GIS. International Journal of Remote Sensing, 17(12), 2401–2415. doi: 10.1080/01431169608948780
- Formaggio, A. R., Gameiro, M. G., & Epiphanio, J. C. N. (1998). Soil erosion modeling using ‘USLE’: Two approaches for evaluating the parameters ‘L’ and ‘S’. Geoscience and Remote Sensing Symposium Proceedings. IGARSS ‘98. 1998 IEEE International 2: 856–858.
- Foster, G. R., & Highfill, R. E. (1983). Effect of terraces on soil loss: USLE P factor values for terraces. Journal of Soil and Water Conservation, 38(1), 48–51.
- Foster, G. R., McCool, D. K., Renard, K. G., & Moldenhauer, W. C. (1981). Conversion of the universal soil loss equation to SI metric units. Journal Soil Water Conservation, 36, 355–359.
- Fryrear, D. W., Bilbro, J. D., Saleh, A., Schomberg, H. M., Stout, J. E., & Zobeck, T. M. (2000). RWEQ: Improved wind erosion technology. Journal of Soil Water Conservation, 55, 183–189.
- Gabriels, D., Ghekiere, G., Schiettecatte, W., & Rottiers, I. (2003). Assessment of USLE cover-management C-factors for 40 crop rotation systems on arable farms in the Kemmelbeek watershed, Belgium. Soil and Tillage Research, 74(1), 47–53. doi: 10.1016/S0167-1987(03)00092-8
- García-Ruiz, J. M. (2010). The effects of land uses on soil erosion in Spain: A review. Catena, 81(1), 1–11. doi: 10.1016/j.catena.2010.01.001
- Gitas, I. Z., Douros, K., Minakou, C., Silleos, G. N., & Karydas, C. G. (2009). Multi-temporal soil erosion risk assessment in N. Chalkidiki using a modified usle raster model. EARSeL eProceedings, 8(1), 40–52.
- Gobin, A., Govers, G., & Kirkby, M. (2006). Pan-European soil erosion assessment and maps. In J. Boardman, & J. Poesen (Eds.), Soil Erosion in Europe (pp. 661–674). Chichester: John Wiley & Sons.
- Hengl, T., Heuvelink, X., & Rossiter, Y. (2007). About regression kriging: From equations to case studies. Computer & Geosciences, 33, 1301–1315. doi: 10.1016/j.cageo.2007.05.001
- Irvine, B., & Kosmas, C. (2003). PESERA User’s manual. PESERA Technical Report Deliverable 15, European Commission funded fifth framework project contract QLK5-CT-1999-01323, 34pp.
- Joshua, W. D. (1977). Soil erosive power of rainfall in the different climatic zones of Sri Lanka. Publication No. 122, IAHS, Washington, pp. 51–61.
- Karydas, C. G., Sekuloska, T., & Silleos, G. N. (2008). Quantification and site-specification of the support practice factor when mapping soil erosion risk associated with olive plantations in the Mediterranean island of Crete. Environmental Monitoring and Assessment, 149(1), 19–28. doi:10.1007/s10661-008-0179-8
- Kertész, Á., & Centeri, C. S. (2006). Hungary in: Soil erosion in Europe (J. Boardman, & J. Poesen (Eds.), (pp. 139–153)). Chichester: John Wiley & Sons.
- Kirkby, M. J., Irvine, B. J., Jones, R. J., & Govers, G. (2008). The PESERA coarse scale erosion model for Europe. I – Model rationale and implementation. European Journal of Soil Science, 59(6), 1293–1306. doi: 10.1111/j.1365-2389.2008.01072.x
- Klein Tank, A., & Können, G. (2003). Trends in indices of daily temperature and precipitation extremes in Europe, 1946–99. Journal of Climate, 16, 3665–3680. doi: 10.1175/1520-0442(2003)016<3665:TIIODT>2.0.CO;2
- Laborczi, A., Szatmári, G., Takács, K., & Pásztor, L. (2015). Mapping of topsoil texture in Hungary using classification trees. Journal of Maps. doi:10.1080/17445647.2015.1113896
- Lahloi, H., Rhinane, H., Hilali, A., Lahssini, S., & Khalile, L. (2015). Potential erosion risk calculation using remote sensing and GIS in Oued El Maleh Watershed, Morocco. Journal of Geographic Information System, 7, 128–139. doi:10.4236/jgis.2015.72012
- Liu, H., Kiesel, J., Hörmann, G., & Fohrer, N. (2011). Effects of DEM horizontal resolution and methods on calculating the slope length factor in gently rolling landscapes. Catena, 87(3), 368–375. doi: 10.1016/j.catena.2011.07.003
- Magliulo, P. (2010). Soil erosion susceptibility maps of the Janare Torrent Basin (Southern Italy). Journal of Maps, 6, 435–447. doi:10.4113/jom.2010.1116
- Mannaerts, C. M., & Gabriels, D. (2000). Rainfall erosivity in Cape Verde. Soil and Tillage Research, 55, 207–212. doi: 10.1016/S0167-1987(00)00104-5
- McBratney, A. B., Mendonça-Santos, M. L., & Minasny, B. (2003). On digital soil mapping. Geoderma, 117, 3–52. doi: 10.1016/S0016-7061(03)00223-4
- Moore, I. D., Grayson, R. B., & Ladson, A. R. (1991). Digital terrain modelling: A review of hydrological, geomorphological, and biological applications. Hydrological Processes, 5(1), 3–30. doi: 10.1002/hyp.3360050103
- Morgan, K. M., & Nalepa, R. (1982). Application of aerial photographic and computer analysis to the USLE for areawide erosion studies. Journal of Soil and Water Conservation, 37(6), 347–350.
- Odongo, V. O. Onyando, J. O., Mutua, B. M., van Oel, P. R., & Becht, R. (2013). Sensitivity analysis and calibration of the Modified Universal Soil Loss Equation (MUSLE) for the upper Malewa Catchment, Kenya. International Journal of Sediment Research, 28(3), 368–383. doi: 10.1016/S1001-6279(13)60047-5
- Panagos, P., Borrelli, P., Meusburger, K., Alewell, C., Lugato, E., & Montanarella, L. (2015a). Estimating the soil erosion cover-management factor at the European scale. Land Use Policy, 48, 38–50. doi: 10.1016/j.landusepol.2015.05.021
- Panagos, P., Borrelli, P., Meusburger, K., van der Zanden, E. H., Poesen, J., & Alewell, C. (2015b). Modelling the effect of support practices (P-factor) on the reduction of soil erosion by water at European scale. Environmental Science & Policy, 51, 23–34. doi: 10.1016/j.envsci.2015.03.012
- Pásztor, L., Laborczi, A., Takács, K., Szatmári, G., Dobos, E., Illés, G., … Szabó, J. (2015). Compilation of novel and renewed, goal oriented digital soil maps using geostatistical and data mining tools. Hungarian Geographical Bulletin, 64, 49–64. doi: 10.15201/hungeobull.64.1.5
- Pásztor, L., Szabó, J., Bakacsi, Z. S., Matus, J., & Laborczi, A. (2012). Compilation of 1:50,000 scale digital soil maps for Hungary based on the Digital Kreybig Soil Information System. Journal of Maps, 8(3), 215–219. doi: 10.1080/17445647.2012.705517
- Renard, K. G., & Freimund, J. R. (1994). Using monthly precipitation data to estimate the R-factor in the revised USLE. Journal of Hydrology, 157, 287–306. SSDI 0022-1694(93)02436-2 doi: 10.1016/0022-1694(94)90110-4
- Roose, E. J. (1980). Approach to the definition of rain erosivity and soil erodibility in West Africa. In M. De Boodt, & D. Gabriels (Eds.), Assessment of Erosion (pp. 154–164). Chichester: Wiley.
- Sadeghi, S. H. R., Mizuyama, T., Miyata, S., Gomi, T., Kosugi, K., Mizugaki, S., & Onda, Y. (2007). Is MUSLE apt to small steeply forested watershed? Journal of Forest Research, 12(4), 270–277. doi:10.1007/s10310-007-0017-9
- da Silva, A. M. (2004). Rainfall erosivity map of Brasil. Catena, 57, 251–259. doi:10.1016/j.catena.2003.11.006
- Sharply, A. N., & Williams, J. R. (1990). EPIC – erosion/productivity impact calculator: 1. Model documentation. U.S. Department of Agriculture Technical Bulletin No. 1768. 235 p.
- Smithen, A. A., & Schulze, R. E. (1982). The spatial distributions in Southern Africa of rainfall erosivity for use in the universal soil loss equation. Water South Africa, 8(2), 74–78.
- Stefanovits, P. (1964). Soil degradation in Hungary (in Hungarian). OMMI. Budapest.
- Szalai, S., Auer, I., Hiebl, J., Milkovich, J., Radim, T., Stepanek, P., … Spinoni, J. (2013). Climate of the Greater Carpathian Region. Final Technical Report. Retrieved from www.carpatclim-eu.org
- Várallyay, G. Y. (2002). Soil survey and soil monitoring in Hungary. European Soil Bureau, Research Report No.9
- Wischmeier, W. H., & Smith, D. D. (1978). Predicting rainfall erosion losses: A guide to conservation planning. Science, US Department of Agriculture Handbook, No. 537, Washington DC
- Zanchi, C. (1988). Soil loss, seasonal variation of erodibility in two soils with differents texture in the Muguello valley in central Italy. Catena Supplement 12, 167–173.
- Zhang, K. L., Shu, A. P., Xu, X. L., Yang, Q. K., & Yu, B. (2008). Soil erodibility and its estimation for agricultural soils in China. Journal of Arid Environments, 72(6), 1002–1011. doi: 10.1016/j.jaridenv.2007.11.018
- Zolina, O., Simmer, C., Belyaev, K., Kapala, A., & Gulev, S. (2009). Improving estimates of heavy and extreme precipitation using daily records from European rain gauges. Journal of Hydrometeorology 10, 701–716. doi:10.1175/2008JHM1055.1