
 ?Mathematical formulae have been encoded as MathML and are displayed in this HTML version using MathJax in order to improve their display. Uncheck the box to turn MathJax off. This feature requires Javascript. Click on a formula to zoom.
ABSTRACT
The presence of supraglacial debris on glaciers in the Himalaya-Karakoram affects the ablation rate of these glaciers and their response to climatic change. To understand how supraglacial debris distribution and associated surface features vary spatially and temporally, geomorphological mapping was undertaken on Baltoro Glacier, Karakoram, for three time-separated images between 2001–2012. Debris is supplied to the glacier system through frequent but small landslides at the glacier margin that form lateral and medial moraines and less frequent but higher volume rockfall events which are more lobate and often discontinuous in form. Debris on the glacier surface is identified as a series of distinct lithological units which merge downglacier of the convergence area between the Godwin-Austen and Baltoro South tributary glaciers. Debris distribution varies as a result of complex interaction between tributary glaciers and the main glacier tongue, complicated further by surge events on some tributary glaciers. Glacier flow dynamics mainly controls the evolution of a supraglacial debris layer. Identifying such spatial variability in debris rock type and temporal variability in debris distribution has implications for glacier ablation rate, affecting glacier surface energy balance. Accordingly, spatial and temporal variation in supraglacial debris should be considered when determining mass balance for these glaciers through time.
1. Introduction
Debris-covered glaciers, where the majority of the ablation area is covered in rock debris, are ubiquitous in mountainous regions globally (CitationBenn & Lehmkuhl, 2000), including the Southern Alps of New Zealand, European Alps, the Andes and in High Asia. The Himalaya and Karakoram ranges contain the largest area of glacial ice outside of the Polar Regions, with one-fifth of the world’s population depending on the run-off from these glaciers as a water resource (CitationBolch et al., 2012). Approximately 23% of glacier area in the Himalaya is covered by debris, increasing to 33% in the Everest region (CitationScherler, Bookhagen, & Strecker, 2011; CitationThakuri et al., 2014). The input of debris to glaciers in the Karakoram is driven by high rates of rock uplift in the mountain range and correspondingly high rates of erosion, ranging between 0.06 and 2.5 mm a−1 (CitationSeong et al., 2007). Debris distribution is controlled by the delivery of rock debris and debris-transport by ice flow, which slows as the glacier loses mass, resulting in a constantly changing distribution of supraglacial debris (CitationBolch, Buchroithner, Pieczonka, & Kunert, 2008; CitationRowan, Egholm, Quincey, & Glasser, 2015; CitationThakuri et al., 2014). Understanding the nature of these changes in debris distribution is currently limited, due to the lack of data describing how supraglacial debris layers evolve through time. However, our knowledge of these glaciers needs to progress to determine their response to current climatic change, and the impact these changes will have on the people who rely on them.
Supraglacial debris distribution is important when calculating glacier mass balance, as such debris layers attenuate the ablation of the underlying ice depending on the debris thickness (CitationEvatt et al., 2015; CitationØstrem, 1959). A thin debris layer (up to around 0.02 m thick), when compared to clean ice, enhances melt by increasing the albedo of the glacier surface, causing it to absorb more solar radiation and melt more quickly than debris-free ice. At a critical debris thickness, the melt rates of the debris-covered ice and the clean ice are equal. Above the critical thickness, which differs between glaciers, the ablation rate of underlying ice decreases exponentially with increasing debris thickness (CitationKayastha, Takeuchi, Nakawo, & Ageta, 2000; CitationNicholson & Benn, 2006; CitationØstrem, 1959). In addition to meteorological parameters, the resultant ablation rate of ice under a debris layer is affected by debris characteristics, including lithology and porosity of the debris layer. The thermal capacity and conductivity of the debris clasts is partially dependent on the lithology of the debris and so will affect how much thermal energy is held in and transferred through the debris layer (CitationConway & Rasmussen, 2000; CitationNicholson & Benn, 2013). Incorporating the evolution of debris distribution, thickness and lithology into calculations of the mass balance of debris-covered glaciers will result in better constraint of the role of debris in modifying the response of these glaciers to climatic change.
Geomorphological mapping of debris distribution using satellite imagery is a useful tool to identify temporal changes in debris distribution across an entire glacier surface, reducing the need for expensive and often challenging fieldwork. By identifying the sources of debris, and the interaction of different debris units and glacier flow, controls on spatio-temporal variations in debris distribution can be determined. A greater understanding of the interaction between hillslope and glacial processes can also be developed with regard to the input of supraglacial debris into the glacial system. Baltoro Glacier is highly appropriate for supraglacial debris mapping due to its location in a region of high erosion rates and concurrently extensive debris cover, and the large number of tributary glaciers which form the glacier system and lead to a complex flow regime and spatially varied debris distribution.
2. Study site
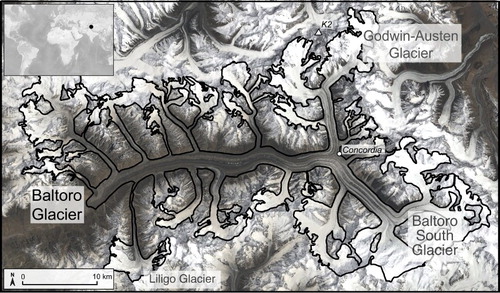
Baltoro Glacier is located in the Karakoram mountain range in northern Pakistan. The glacier and its tributaries cover an area of ∼660 km2, with a centre-line length of ∼62 km (). The second highest mountain in the world, K2, is located ∼12 km north of the main glacier tongue. The main tongue of Baltoro Glacier flows from Concordia (4600 m) in an east to west direction, to its terminus at ∼3410 m, and has 12 tributary glaciers along its lengths (Tributary Glaciers (TGs) 3–14, Main Map). Above Concordia Godwin-Austen Glacier (TG 1) and Baltoro South Glacier (TG 2) converge to form the main tongue of Baltoro Glacier. Baltoro Glacier has an extensive debris cover, with ∼38% of its area covered by supraglacial debris (CitationMayer, Lambrecht, Belò, Smiraglia, & Diolaiuti, 2006). Debris thickness has a general pattern of increasing thickness downglacier, reaching around 3 m in thickness at the glacier terminus (CitationMihalcea et al., 2008).
Figure 1. The regional extent of the Baltoro Glacier system and relevant locations, including Concordia and named tributary glaciers.
3. Previous work
Baltoro Glacier is relatively well studied despite its location in a remote and politically unstable region. Much of the existing research literature is almost exclusively based on remote sensing datasets (e.g. CitationCollier et al., 2014; CitationQuincey et al., 2009a), although some studies have been complemented by fieldwork (e.g. CitationMayer et al., 2006; CitationMihalcea et al., 2008; CitationSearle et al., 2010). Supraglacial debris thickness for the entire glacier was calculated by CitationMihalcea et al. (2008) and CitationMinora et al. (2015) for 2004 and 2011, respectively, but these maps only consider debris thickness. These maps therefore disregard lithology and the potential impact of spatial differences in thermal energy stored in the debris due to different lithologies across the glacier surface. Lack of segregation between debris lithology may cause errors in these debris thickness output maps, as thermal capacity of rock debris influences debris surface temperature, the parameter used to calculate debris thickness in these two studies (CitationSteiner & Pellicciotti, 2015). CitationCollier et al. (2013) incorporated a debris layer with a simulated thickness into a distributed energy balance model for the glacier, but did not consider spatial variations in debris lithology either. Omitting lithological variation is a potential error in the resultant ablation rates calculated by the study, as differing thermal capacity and rates of heat transfer for different debris lithologies were not incorporated into calculations. Other studies focused on different aspects of the Baltoro Glacier system; CitationQuincey et al. (2009a) investigated the changing velocity of the glacier between 1993 and 2008 and linked their observations to climatic variability, while both CitationDiolaiuti, Pecci, and Smiraglia (2003) and CitationBelò, Mayer, Smiraglia, and Tamburini (2008) identified the surging nature of the confluent Liligo Glacier (TG 7) () and reconstructed its recent dynamic history.
4. Methods
Geomorphological features of Baltoro Glacier were mapped using three time-separated and orthorectified Advanced Spaceborne Thermal Emission and Reflection Radiometer (ASTER) images. The three images were acquired in August 2001 (29th), 2004 (14th) and 2012 (20th), at a resolution of 15 m, and were selected because of low levels of cloud cover (46%, 1% and 13%, respectively). Images from the same month in each year also allowed direct comparison of seasonally controlled aspects of the glacier geomorphology (e.g. supraglacial water bodies and mass movement scars). ASTER images were georeferenced and orthorectified in ENVI (v.5.0) prior to using them for mapping surface cover on Baltoro Glacier. Georeferencing was undertaken using the ASTER georefering tool in ENVI (v.5.0) and a Landsat 7 ETM+ image (acquired on 9 August 2002), which is georeferenced and orthorectified prior to downloading. Tie points between each ASTER and the Landsat 7 ETM+ images were created as part of the georeferencing process. Georeferenced ASTER images were then compared to the Landsat 7 ETM+ image and to each other to confirm that there was no pixel shift present between images. Orthorectification was then undertaken on each ASTER image using the ENVI (v.50) ASTER orthorectification tool, which corrects the effects of sensor tilt and terrain, and creates a planmetric image.
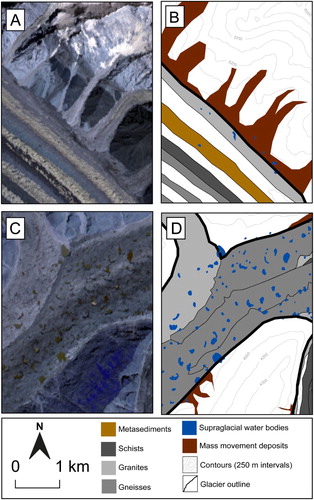
An additional Landsat 7 Enhanced Thematic Mapper (ETM+) image, acquired in August 2001 at 30 m resolution, was used to map upper regions of the glacier that were covered in cloud in the ASTER 2001 imagery. Additionally, Quickbird data, accessed through CitationGoogle Earth (2016) were used to investigate specific features at a horizontal resolution of 2.4 m. Features were mapped from ASTER imagery using a false-colour composite (Bands 3N, 2, 1) at 15 m resolution and were manually digitised in ESRI ArcGIS 10.1. Geomorphological features were initially mapped at a glacier-wide scale, then the boundaries of features identified at a finer scale to increase mapping accuracy. Debris units were identified manually using colour differences between pixels on the glacier surface, aided by comparison of the red, green and blue spectral signal of these pixels with different colours (CitationLillesand, Keifer, & Chipman, 2014). The units were then traced up-glacier to their source area and lithology was identified by matching the source area with geological units identified by CitationSearle et al. (2010) in the geology map of the Karakoram. Mass movement deposits were identified by the presence of two features: a scar, identified as a lighter, elongate feature on the valley side, and an associated debris fan deposit on or near the glacier surface ((a,b)). Pixels containing supraglacial water were identified using a normal difference water index (NDWI) (CitationGao, 1996) in ENVI, (v. 5.0) calculated from ASTER Bands 3 and 4 using Equation (1).(1)
(1) Manual identification and digitisation of supraglacial features resulted in some misclassification of pixels, particularly where changes in debris distribution or supraglacial pond size were on the order of a few pixels. The extent of this error was reduced by repeated digitisation of each feature three times and the three outputs were then compared against the imagery to determine the most appropriate outline. Digitised margins of debris-covered glaciers in previous studies have been calculated to have errors between 2.5% and 4.5% (e.g. CitationBolch, Menounos, & Wheate, 2010; CitationPaul, Frey, & Le Bris, 2011). Consequently, changes on the order of less than 4.5% of the feature area were disregarded in this study.
Figure 2. Examples of mass movement deposits (a,b) and supraglacial water bodies (c,d) in original ASTER 2012 images and mapped examples, respectively.
The map associated with this paper is the 2012 geomorphological map of Baltoro Glacier, with insets from 2001, 2004 and 2012 showing changes in surface cover through time. The map is in a Universal Transverse Mercator (UTM) WGS 1984 projected coordinate system with off-ice 250 m contours derived from the ASTER Global digital Elevation Model (GDEM) (2000, 30 m resolution) using the contour tool in ArcGIS. The glacier outline used is adapted from the Randolph Glacier Inventory (CitationArendt, Bolch, Cogley, Gardner, & Hagen, 2012; CitationBajracharya, Shrestha, Bajracharya, Maharjan, & Guo, 2014).
5. Features related to debris distribution
5.1. Debris units
The schist, gneiss and granitic debris units are part of the Baltoro Batholith and associated metamorphosed rock units, while the metasediment debris unit originates from a small exposure of metamorphosed limestone near the headwall of TG2. The debris-covered glacier area has varied between 2001 and 2012 by ∼5%, but gneiss debris dominates the debris distribution on Baltoro Glacier throughout this period, covering ∼53% of the area (). The metasedimentary debris has the most variable area between 2001 and 2012 and does not reach the glacier terminus. It is likely that the increase in the area of the metasediment debris unit is due to it being a younger deposit than other debris units, and so it has not reached the terminus yet, or that it has reached the terminus but has been mixed or covered by other debris units before the terminus. All debris units form moraine structures, both lateral and medial, which are fed by debris input from the glacially incised valley walls and associated valley spurs at the confluences of glacier flow units through small but frequent landslide events, as seen in mountain valley environments (CitationRowan et al., 2015). These units are initially separated by debris-free ice, but converge below Concordia. The debris units have distinct margins in the upper and mid-sections of the main glacier tongue, converging to a massive debris unit in the lower 10 km of the glacier. The moraines increase in width with increasing distance from their source until they converge, due to increased debris input from englacial meltout and slumping of the moraines over time (CitationHambrey & Glasser, 2003). Little change in the main debris unit boundaries occurs in the mid- and lower sections of the main glacier tongue between 2001 and 2012, suggesting that once units converge their width is constrained by the other debris units.
Table 1. The total area of each debris unit type, based on lithology, for 2001, 2004 and 2012, and the percentage of each debris type as a proportion of the total debris cover for Baltoro Glacier and its tributary glaciers.
5.2. Supraglacial water bodies
The number of supraglacial water bodies, also referred to as ‘ponds’, increases from 234 to 570 over the study period, occupying 0.66 km2 of the debris surface in 2001, and 2.04 km2 in 2012, an increase in pond area of 209% (). Pond formation is associated with spatially varying ablation which results in the formation of hummocky topography where water accumulates in the depressions on the debris surface (CitationReynolds, 2000). Identifying areas of supraglacial water bodies is important for determining the state of a debris-covered glacier. Over decadal timescales, increasing supraglacial ponds can suggest build-up of debris cover and a lowering of the glacier surface gradient, resulting in a reduction of the driving stress and hence glacier stagnation (CitationQuincey, Luckman, & Benn, 2009b; CitationWessels, Kargel, & Kieffer, 2002). In the case of this study, it is likely that increased pond number and area are responses to temporal variation in climatic conditions, specifically an increase in precipitation since 2000, which was also attributed to increasing surface velocity in 2005 (CitationQuincey et al., 2009a). Such water bodies increase the local glacier ablation rate through increased absorption of incoming shortwave radiation (CitationSakai, Nakawo, & Fujita, 2002). Ice cliffs are often concomitant with supraglacial ponds, and are a focus for a large proportion of a debris-covered glacier’s net ablation (CitationJuen, Mayer, Lambrecht, Han, & Liu, 2014; CitationReid & Brock, 2014; CitationSakai, Nakawo, & Fujita, 1998). Identifying the number of supraglacial ponds is therefore integral to understanding the controls on the ablation rate of a debris-covered glacier and the relative importance of these controls over time as the debris cover evolves. Although conditions may not be entirely comparable, a similar increase in pond number and area on Khumbu Glacier was thought to be a result of a period of recession following a period of heightened activity during the middle part of last decade (CitationQuincey et al., 2009a), and similar conditions could also be true for Baltoro Glacier, but would need further investigation of variations in past surface velocity and mass balance.
Table 2. The total area and number of supraglacial waterbodies identified using an NDVI index for each time step between 2001 and 2012.
5.3. Areas of mass movement
Mass movement scars and deposits are visible along most of the tributary and main glacier margins, with an increasing number appearing between 2001 and 2012, particularly between 2001 and 2004. An increasing number of mass movement events may be related to a higher frequency of seismic activity or increased precipitation between 2001 and 2004 (CitationBarnard, Owen, Sharma, & Finkel, 2001; CitationBookhagen, Thiede, & Strecker, 2005). The most evident mass movement deposits in the Baltoro Glacier system are found on TGs 4 and 5 (Inset B). Two mass movement deposits on TG5 and a series of smaller but more frequent protrusions on TG4 are interpreted as being sourced from intermittent mass movement events. The mounds of debris have then been transported with glacier flow to the north, at a rate of ∼20 m a−1 (calculated from the distance the deposits have travelled between images, divided by the number of years between images). These periodic events, occurring on sub-decadal to decadal timescales, deliver an additional source of supraglacial debris to the glacier system, which are subsequently dissipated and result in thickening of the debris layer.
5.4. Tributary glacier convergence
In addition to Godwin-Austen and Baltoro South Glaciers, 12 tributary glaciers flow into the main tongue of Baltoro Glacier (Tributary Glacier inset, Main Map). These tributary glaciers, flowing perpendicular to the main tongue, have spatially and temporally varying covers of supraglacial debris, which affects the distribution of debris onto the main glacier tongue. TG4 in Inset B is predominantly debris free, with the exception of two longitudinal schistose debris bands. A series of supraglacial ponds have developed on the main glacier tongue to the east of the two debris bands on TG4 between 2001 and 2012. Pond development also occurs on TG3 and on the glacier surface below Concordia, where TGs 1 and 2 converge. Pond development in the convergence area below Concordia is likely due to the same process as found on clean ice glaciers where water ponding occurs in surface depressions (CitationBanwell, Arnold, Willis, Tedesco, & Ahlstrøm, 2012). For TGs 4 and 3, the formation of the water bodies is likely due to a constriction of the main glacier tongue causing an undulant surface topography. These constrictions in glacier flow also manifested in debris thickening in the same areas, observed on the debris thickness map of Baltoro Glacier produced by CitationMinora et al. (2015). TG8, flowing southeast into the terminus of Baltoro Glacier, is unique in the Baltoro Glacier system, as no obvious extensive debris cover is identifiable on its surface in satellite imagery. The lack of debris cover is attributed to its steep surface slope and high velocities likely to be associated with this, resulting in little time for debris to accumulate on the surface, as well as its relatively short length in comparison to all other tributary glaciers in the system, reducing the valley side area from which debris can be supplied (CitationYoung & Hewitt, 1993).
5.4.1. Surging tributary glaciers
The schistose debris unit on Liligo Glacier (TG7, Inset C) shows an apparent advance and subsequent retreat of the schistose debris unit extent between 2001 and 2004 and 2004 and 2012, respectively. Retreat of the debris unit is, however, unlikely, as movement of rock debris upslope would have had to occur. Therefore, the changes in debris unit boundary between 2001 and 2012 are attributed to dissipation and reorganisation of the debris, as the surface morphology changes following the active surge phase of Liligo Glacier between 1973 and 2001 (CitationBelò et al., 2008; CitationDiolaiuti et al., 2003). The distribution of the debris unit succeeds the ultimate advance of the glacier, likely to result from slumping of the debris into the depression in the proglacial area as the tributary glacier commences its quiescent phase and decouples from the main Baltoro Glacier tongue. The associated supraglacial pond identified by CitationBelò et al. (2008) in 2001 persists until 2004, but had drained by 2012, likely due to downwasting of ice and redistribution of the debris in the area between Liligo Glacier and Baltoro Glacier. Changes in surface morphology associated with pond drainage may have also contributed to the shift in debris unit boundary.
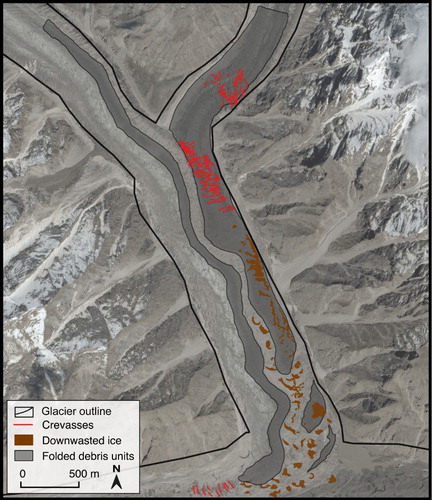
Geomorphological features present on TG12 (Inset A) also suggest that a surge event has occurred recently and that the glacier is now in a quiescent phase. This tributary glacier has not been documented to surge previously. The sinuous nature of the debris unit margins at the confluence of TGs 12 and 13, and the development of a fold-type structure on the eastern schistose debris unit ∼1 km from the convergence of these glaciers (), are both evidence for a surge event, where TG13 would have accelerated and its terminus advanced, folding the debris units downglacier from this confluence, analogous to folding of the debris bands on Susitna Glacier, Alaska (CitationMeier & Post, 1969). Additional evidence for the occurrence of a surge event include heavy crevassing of the TG13, upglacier from the main fold in the schistose debris unit, while the area below the folded schist units are heavily ponded with a hummocky surface, suggesting downwasting of the ice below the surge front as the glacier recedes following a surge event (CitationEvans & Rea, 1999).
Figure 3. The geomorphological features on Baltoro Glacier’s tributary glacier showing evidence of a surge event (CitationGoogle Earth, 2016).
6. Conclusions
Supraglacial debris units were segregated into four lithologies, with each debris type, particularly metasediments, being composed of different minerals that would cause them to have different thermal capacities and albedo. Supraglacial cover varies both spatially and temporally on Baltoro Glacier. Temporal variations in supraglacial pond number and area are attributed to climatic conditions in this study, but should be monitored on Baltoro Glacier in the future to determine whether this trend continues and if it is linked to other aspects of glacier dynamics. Debris distribution is controlled by the input of material from frequent rockfalls in the upper reaches of the glaciers upglacier of Concordia, subsequently entrained into medial and lateral moraines. Larger and less frequent mass movement events in the ablation area add additional debris to the system and occur on sub-decadal to decadal timescales. Once debris has entered the glacial system, variability in its distribution is controlled by the interaction of flow units between tributary glaciers and the main Baltoro Glacier, complicated by the advance and recession of tributary glacier termini due to surge events. The changes in debris unit areas between 2001 and 2012 are attributed to error in identification of debris-covered pixels in the analysis of remotely sensed data, as the difference in glacier area is near to the assumed error value and so may due to error in manual digitisation. However, it is likely that variations in debris distribution do occur through time due to variations in glacier dynamics and input of debris to the glacier system. Consequently, analyses of variations in debris distribution over longer timescales are needed as spatial variation in debris unit lithology and layer thickness will affect the energy balance of the supraglacial debris layer, which would cause spatio-temporal variation in glacier ablation. It is therefore appropriate to undertake further investigations into rates of change in supraglacial debris distribution and debris thickness through time, as well as to determine the influence of debris lithology on heat transfer and subsequent ablation of underlying ice. Such spatial and temporal variations could then be incorporated into glacier surface energy balance modelling to refine subsequent calculations of ablation rates for debris-covered glaciers, to aid in determining the role of a supraglacial debris layer in the response of these glaciers to climatic change.
Software
ENVI (v. 5.0) was used to prepare the remotely sensed data for mapping. ESRI ArcGIS (v. 10.1) was used for mapping all features and for production of the Main Map and insets, alongside CitationGoogle Earth (2016) to investigate and identify features in more detail. The final map was constructed in Adobe Illustrator (v. 15.1.0).
Geomorphological map of Baltoro Glacier showing the different debris units and supraglacial features on the glacier in 2012, with inserts of change in supraglacial cover between 2001 and 2012.pdf
Download PDF (36 MB)Acknowledgements
The authors would like to thank Dr Tom Holt and Stephen Jennings for consultation on glacial structures and associated processes. The reviewers are also thanked, in particular Dr Christoph Mayer, for providing useful comments on the manuscript, as these comments greatly improved the final map and associated paper.
Disclosure statement
No potential conflict of interest was reported by the authors.
ORCID
M. J. Gibson http://orcid.org/0000-0003-1707-5562
Related Research Data
References
- Arendt, A., Bolch, T., Cogley, J. G., Gardner, A., Hagen, J. O., Hock, R., … Radic, V. (2012). Randolph Glacier Inventory [v2. 0]: A dataset of Global Glacier outlines, Global Land Ice Measurements from Space. [Data set]. Retrieved February 9, 2016, from http://glims.colorado.edu/glacierdata/
- Bajracharya, S. (submitter), Shrestha, F., Bajracharya, S., Maharjan, S. B., & Guo, W. (analyst(s)). (2014). GLIMS Glacier database. Boulder, CO: National Snow and Ice Data Center. doi:10.7265/N5V98602
- Banwell, A. F., Arnold, N. S., Willis, I. C., Tedesco, M., & Ahlstrøm, A. P. (2012). Modeling supraglacial water routing and lake filling on the Greenland Ice Sheet. Journal of Geophysical Research: Earth Surface, 117(F4). doi:10.1029/2012JF002393
- Barnard, P. L., Owen, L. A., Sharma, M. C., & Finkel, R. C. (2001). Natural and human-induced landsliding in the Garhwal Himalaya of northern India. Geomorphology, 40(1–2), 21–35. doi:10.1016/S0169-555X(01)00035-6
- Belò, M., Mayer, C., Smiraglia, C., & Tamburini, A. (2008). The recent evolution of Liligo Glacier, Karakoram, Pakistan, and its present quiescent phase. Annals of Glaciology, 48(1), 171–176. doi:10.3189/172756408784700662
- Benn, D. I., & Lehmkuhl, F. (2000). Mass balance and equilibrium-line altitudes of glaciers in high-mountain environments. Quaternary International, 65–66, 15–29. doi:10.1016/S1040-6182(99)00034-8
- Bolch, T., Buchroithner, M., Pieczonka, T., & Kunert, A. (2008). Planimetric and volumetric glacier changes in the Khumbu Himal, Nepal, since 1962 using Corona, Landsat TM and ASTER data. Journal of Glaciology, 54(187), 592–600. doi:10.3189/002214308786570782
- Bolch, T., Kulkarni, A., Kääb, A., Huggel, C., Paul, F., Cogley, J. G., … Stoffel, M. (2012). The state and fate of Himalayan Glaciers. Science, 336(6079), 310–314. doi:10.1126/science.1215828
- Bolch, T., Menounos, B., & Wheate, R. (2010). Landsat-based inventory of glaciers in western Canada, 1985–2005. Remote Sensing of Environment, 114(1), 127–137. doi:10.1016/j.rse.2009.08.015
- Bookhagen, B., Thiede, R. C., & Strecker, M. R. (2005). Late quaternary intensified monsoon phases control landscape evolution in the Northwest Himalaya. Geology, 33(2), 149–152. doi:10.1130/G20982.1
- Collier, E., Mölg, T., Maussion, F., Scherer, D., Mayer, C., & Bush, A. B. G. (2013). High-resolution interactive modelling of the Mountain Glacier–atmosphere interface: An application over the Karakoram. The Cryosphere, 7(3), 779–795. doi:10.5194/tc-7-779-2013
- Collier, E., Nicholson, L. I., Brock, B. W., Maussion, F., Essery, R., & Bush, A. B. G. (2014). Representing moisture fluxes and phase changes in glacier debris cover using a reservoir approach. The Cryosphere, 8(4), 1429–1444. doi:10.5194/tc-8-1429-2014
- Conway, H., & Rasmussen, L. A. (2000). Summer temperature profiles within supraglacial debris on Khunibu Glacier, Nepal. In M. Nakawo, C. Raymond, & A. Fountain (Eds.), Debris covered glaciers (pp. 89–97). Wallingford: IAHS Publication.
- Diolaiuti, G., Pecci, M., & Smiraglia, C. (2003). Liligo Glacier, Karakoram, Pakistan: A reconstruction of the recent history of a surge-type glacier. Annals of Glaciology, 36(1), 168–172. doi:10.3189/172756403781816103
- Evans, D. J. A., & Rea, B. R. (1999). Geomorphology and sedimentology of surging glaciers: A land-systems approach. Annals of Glaciology, 28(1), 75–82. doi:10.3189/172756499781821823
- Evatt, G. W., Abrahams, D., Heil, M., Mayer, C., Kingslake, J., Mitchell, S. L., … Clark, C. D. (2015). Glacial melt under a porous debris layer. Journal of Glaciology, 61(229), 825–836. doi:10.3189/2015JoG14J235
- Gao, B. C. (1996). NDWI – A normalized difference water index for remote sensing of vegetation liquid water from space. Remote Sensing of Environment, 58, 257–266. doi:10.1016/S0034-4257(96)00067-3
- Google Earth v. 7.1.5.1557. (2016, May 1). Baltoro Glacier, northern Pakistan. 35°44′53.97″N, 76°18′33.66″E, Eye altitude 10.09 km. DigitalGlobe 2016. Retrieved April 30, 2016, from http://earth.google.com
- Hambrey, M. J., & Glasser, N. F. (2003). The role of folding and foliation development in the genesis of medial moraines: Examples from Svalbard Glaciers. The Journal of Geology, 111(4), 471–485. doi:10.1086/375281
- Juen, M., Mayer, C., Lambrecht, A., Han, H., & Liu, S. (2014). Impact of varying debris cover thickness on ablation: A case study for Koxkar Glacier in the Tien Shan. The Cryosphere, 8(2), 377–386. doi: 10.5194/tc-8-377-2014
- Kayastha, R. B., Takeuchi, Y., Nakawo, M., & Ageta, Y. (2000). Practical prediction of ice melting beneath various thickness of debris cover on Khumbu Glacier, Nepal, using a positive degree-day factor. In M. Nakawo, C. Raymond, & A. Fountain (Eds.), Debris covered glaciers (pp. 71–81). Wallingford: IAHS Publication.
- Lillesand, T., Keifer, R., & Chipman, J. (2014). Remote sensing and image interpretation. Chichester: John Wiley and Sons.
- Mayer, C., Lambrecht, A., Belò, M., Smiraglia, C., & Diolaiuti, G. (2006). Glaciological characteristics of the ablation zone of Baltoro Glacier, Karakoram, Pakistan. Annals of Glaciology, 43(1), 123–131. doi:10.3189/172756406781812087
- Meier, M. F., & Post, A. (1969). What are glacier surges? Canadian Journal of Earth Sciences, 6(4), 807–817. doi:10.1139/e69-081
- Mihalcea, C., Brock, B. W., Diolaiuti, G., D’Agata, C., Citterio, M., Kirkbride, M. P., … Smiraglia, C. (2008). Using ASTER satellite and ground-based surface temperature measurements to derive supraglacial debris cover and thickness patterns on Miage Glacier (Mont Blanc Massif, Italy). Cold Regions Science and Technology, 52(3), 341–354. doi:10.1016/j.coldregions.2007.03.004
- Minora, U., Senese, A., Bocchiola, D., Soncini, A., D’agata, C., Ambrosini, R., … Diolaiuti, G. (2015). A simple model to evaluate ice melt over the ablation area of glaciers in the Central Karakoram National Park, Pakistan. Annals of Glaciology, 56(70), 202–216. doi:10.3189/2015AoG70A206
- Nicholson, L., & Benn, D. I. (2006). Calculating ice melt beneath a debris layer using meteorological data. Journal of Glaciology, 52(178), 463–470. doi:10.3189/172756506781828584
- Nicholson, L., & Benn, D. I. (2013). Properties of natural supraglacial debris in relation to modelling sub-debris ice ablation. Earth Surface Processes and Landforms, 38(5), 490–501. doi:10.1002/esp.3299
- Østrem, G. (1959). Ice melting under a thin layer of moraine, and the existence of ice cores in moraine ridges. Geografiska Annaler, 41, 228–230.
- Paul, F., Frey, H., & Le Bris, R. (2011). A new glacier inventory for the European Alps from Landsat TM scenes of 2003: Challenges and results. Annals of Glaciology, 52(59), 144–152. doi:10.3189/172756411799096295
- Quincey, D. J., Copland, L., Mayer, C., Bishop, M., Luckman, A., & Belò, M. (2009a). Ice velocity and climate variations for Baltoro Glacier, Pakistan. Journal of Glaciology, 55(194), 1061–1071. doi:10.3189/002214309790794913
- Quincey, D. J., Luckman, A., & Benn, D. I. (2009b). Quantification of Everest region glacier velocities between 1992 and 2002, using satellite radar interferometry and feature tracking. Journal of Glaciology, 55(192), 596–606. doi:10.3189/002214309789470987
- Reid, T. D., & Brock, B. W. (2014). Assessing ice-cliff backwasting and its contribution to total ablation of debris-covered Miage glacier, Mont Blanc massif, Italy. Journal of Glaciology, 60(219), 3–13. doi:10.3189/2014JoG13J045
- Reynolds, J. M. (2000). On the formation of supraglacial lakes on debris-covered glaciers. In M. Nakawo, C. Raymond, & A. Fountain (Eds.), Debris covered glaciers (pp. 153–161). Wallingford: IAHS Publication.
- Rowan, A. V., Egholm, D. L., Quincey, D. Q., & Glasser, N. F. (2015). Modelling the feedbacks between mass balance, ice flow and debris transport to predict the response to climate change of debris-covered glaciers in the Himalaya. Earth and Planetary Science Letters, 430(C), 427–438. doi:10.1016/j.epsl.2015.09.004
- Sakai, A., Nakawo, M., & Fujita, K. (1998). Melt rate of ice cliffs on the Lirung Glacier, Nepal Himalayas, 1996. Bull Glacier Research, 16, 57–66.
- Sakai, A., Nakawo, M., & Fujita, K. (2002). Distribution characteristics and energy balance of ice cliffs on debris-covered glaciers, Nepal Himalaya. Arctic, Antarctic, and Alpine Research, 34(1), 12–19. doi:10.2307/1552503
- Scherler, D., Bookhagen, B., & Strecker, M. R. (2011). Spatially variable response of Himalayan glaciers to climate change affected by debris cover. Nature Geoscience, 4(3), 156–159. doi:10.1038/ngeo1068
- Searle, M. P., Parrish, R. R., Thow, A. V., Noble, S. R., Phillips, R. J., & Waters, D. J. (2010). Anatomy, age and evolution of a collisional mountain belt: The Baltoro granite batholith and Karakoram Metamorphic Complex, Pakistani Karakoram. Journal of the Geological Society, 167(1), 183–202. doi:10.1144/0016-76492009-043
- Seong, Y. B., Owen, L. A., Bishop, M. P., Bush, A., Clendon, P., Copland, L., … Shroder, J. F. (2007). Quaternary glacial history of the Central Karakoram. Quaternary Science Reviews, 26(25–28), 3384–3405. doi:10.1016/j.quascirev.2007.09.015
- Steiner, J. F., & Pellicciotti, F. (2015). Variability of air temperature over a debris-covered glacier in the Nepalese Himalaya. Annals of Glaciology, 57(71), 295–307. doi:10.3189/2016AoG71A066
- Thakuri, S., Salerno, F., Smiraglia, C., Bolch, T., D’Agata, C., Viviano, G., & Tartari, G. (2014). Tracing glacier changes since the 1960s on the south slope of Mt. Everest (central Southern Himalaya) using optical satellite imagery. The Cryosphere, 8(4), 1297–1315. doi:10.5194/tc-8-1297-2014
- Wessels, R. L., Kargel, J. S., & Kieffer, H. H. (2002). ASTER measurement of supraglacial lakes in the Mount Everest region of the Himalaya. Annals of Glaciology, 34(1), 399–408. doi:10.3189/172756402781817545
- Young, G. J., & Hewitt, K. (1993). Glaciohydrological features of the Karakoram Himalaya: Measurement possibilities and constraints. In L. Molnar (Ed.), Hydrology of mountainous areas (pp. 273–284). Wallingford: IAHS Publication.