
ABSTRACT
Geo- and palaeoecological studies in the Carpathian Basin require a detailed knowledge of the distribution of aeolian sediments. Existing maps are not detailed enough and erroneous as a result of the basic input data and scale used. Here we present a map showing the detailed distribution of loess sediments in the Carpathian Basin at the border of Hungary and Romania using a Geographic Information System and the vectorized, statistically analysed geological map of Hungary (scale 1:300,000) and the Romanian pedological map (scale 1:500,000). Both, the Hungarian and the Romanian data sets were combined and transferred into a common loess sediment classification system resulting in a seamless cross-border map showing the loess distribution in the Carpathian Basin at a scale of about 1:500,000.
1. Introduction
Palaeoecological studies in the Carpathian Basin require detailed knowledge of the distribution of Quaternary aeolian sediments (CitationLehmkuhl et al., 2015; CitationObreht et al., 2015). The spatial distribution of these sediments, especially loess and loess-like sediments is usually provided in maps and geospatial data. The first general overview of the loess distribution in the Carpathian Basin was provided by CitationHorusitzky (1898), his map is still of undoubted value although a more modern classification of sediments is useful. The most often used loess distribution map for this region by CitationHaase et al. (2007) is not detailed enough and in some parts faulty due to its small scale, and the multinational and cross-border source data, respectively. Therefore, some areas with loess presence are missing and the distribution of loess sediments is underestimated in some parts, for example, Western Romania (CitationLindner, 2016). Many of the maps presenting the distribution of loess and other geological features in Europe display inconsistencies at national borders or even between different maps within one country such as displacements, shifts or even abrupt delimitations of different geological units such as loess. In fact, if geoscientific data from different regions or countries are combined, national borders in many medium- and large-scale thematic data sets appear as artificial breaks (cf. CitationNilson, Köthe, & Lehmkuhl, 2007 and references therein). Such artificial breaks result from the need to simplify geodata sets from different countries or even different surveys within one country (CitationWitschas, 2004, Citation2005, Citation2007).
Studies discussing the palaeoenvironment in the context of surface sediment distribution in the Carpathian Basin require a new and, more detailed map where national borders do not represent changes in surface sediment due to different mapping at a larger scale.
Our first approach was to create a map of loess distribution using geological maps of the region. Throughout, the Hungarian geological map (CitationBalogh et al., 1956; scale 1:300,000) was detailed enough for the presented purposes, however the Romanian geological map at a similar scale (CitationOvejanu, Candrea, & Crǎciunescu, 1968; scale 1:200,000) did not meet these requirements, because of the content and composition of the map. Signatures and explanations do not allow unambiguous identification of the represented rocks or sediments, but rather focus on age. In particular, loess and loess-like sediments are not displayed. Instead, the map shows detailed information about the chronostratigraphy. These cannot be related to the needed geological and sedimentological information required here. Due to the lack of appropriate geological maps an alternative approach was needed.
Therefore we used soil maps from Romania, because soil development depends on the underlying parent material, like rocks. Some specific soils, such as Chernozems, Phaeozems or Kastanozems, predominantly develop on loess sediments. Therefore the new approach was to estimate the loess distribution using the spatial extent of soils in the eastern part of the study area. The Romanian pedological map at 1:500,000 scale (CitationFlorea, Conea, & Munteanu, 1971) is at a comparable scale and turned out to be applicable.
As a case study region, the border area between Hungary and Romania is chosen here to create a seamless map of loess and loess-like surface sediments.
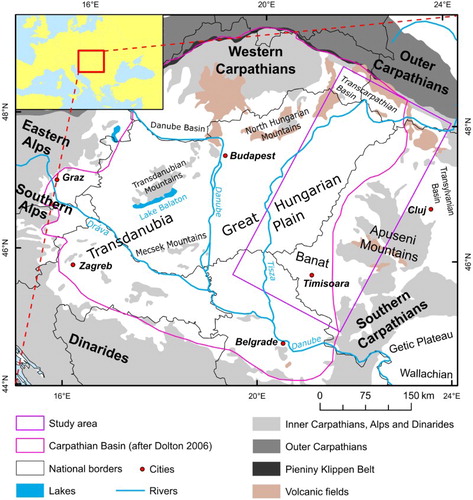
2. Study area
The Carpathian Basin is an intra-montane basin in south eastern Central Europe; it measures about 500–600 km in diameter. It is geomorphologically and geologically delimited by surrounding Mountains. The southern border is formed by the Dinarides, the western by the Alps (CitationSchönenberg & Neugebauer, 1997). The main study area is situated along the border between Hungary and Romania and about 100 km in an eastern and western direction (). By this, the whole Hungarian and the eastern part of the Carpathian Basin to the Apuseni mountain range could be examined. The elevation of the Carpathian Basin lies between 90 and ∼150 m asl; the surrounding mountains reach elevations up to 2000 m asl. The climate is rather continental with precipitation ranging between 450 and 600 mm in the basin. Precipitation, however, is much higher in the surrounding mountains. The mean annual air temperature lies between 10°C and 11°C.
The morphological formation of the Carpathian Basin is a result of tectonic movement and corresponds to the geological basin. During the early Quaternary, fluvial, deltaic and marshy medium and fine grained sandy sediments predominated, later silty and fine grained sandy sediments also of fluvial, lacustrine and aeolian origin played a major role (CitationDolton, 2006; CitationFöldvary, 1988; CitationMagyar et al., 2013). The accumulation of lacustrine, fluvial and later aeolian sediments leads to the recent predominantly flat topography of the basin.
Land use is characterized by agriculture in the lower regions, with vineyards and forests in the foothills and mountainous regions, respectively. The predominantly agricultural land can be ascribed to the loess sediments and the particularly fertile soils.
3. Methods
3.1. Source maps, spatial data and processing
For mapping and modelling of the loess distribution, primarily two maps were used as data sources: the geological map of Hungary (CitationBalogh et al., 1956) and the pedological map of Romania (CitationOvejanu et al., 1968). The Hungarian geological map already provides detailed information on Quaternary sediments including loess and loess-like sediments in a practicable classification. The similar scaled Romanian geological map does not provide comparable information on aeolian sediments. Quaternary sediments are displayed in 22 classes, 7 of these represent Holocene sediments. The information is more chronostratigraphical and does not provide useful information about the rocks or sediments. Correlation of stratigraphic units and possible sediments cannot be undertaken. Therefore, here the pedological map of Romania was used to gather information on the parental material of the presented soils.
The Hungarian part was mapped by vectorization of the Quaternary sediments exclusively. Aeolian sediments were adopted and subsequently reclassified applying a modified loess sediment classification from CitationKoch and Neumeister (2005), see Section 3.2. The Romanian soil map was re-evaluated by vectorization, aiming for the creation of two layers containing soil type and soil texture and soil feature interpretation as follows. For quality assessment, probability classes for the occurrence of loess were also built using the CORINE Landcover CLC2006 data (CitationBüttner, Kosztra, Maucha, & Pataki, 2010; CitationEEA, 2014) and integrated into the calculation (CitationLindner, 2016).
In addition, the 1-arc-second Shuttle Radar Topography Mission (SRTM) digital elevation data (DEM) with a spatial ground resolution of about 26 × 26 m was used to extract the topography. We assume that sedimentological conditions of loess distribution (or dust deposition) and sediment relocation are related to relief conditions.
The modelled loess sediment deposits were also classified after CitationKoch and Neumeister (2005). All data sets for the Romanian part were transformed into raster format, combined with the calculation and retransformed into vector format. Finally, the Hungarian vector layer was combined with the modelled layer for Romania.
When dealing with the cross-border spatial data, one issue was transferring of the maps’ original reference systems into a common system. This was solved by reprojecting the maps into the European Union INSPIRE directive’s recommended European Terrestrial Reference System (ETRS) 1989 Lamberts Equal Area projection to the representative scale of areas and to ensure applicability in further projects (CitationINSPIRE, 2014).
3.2. Classification of loess sediments
Loess and loess-like sediments are principally defined by several characteristic features, mainly its grain size and carbonate content. Formed by dust mobilization, transport and deposition, it is typically formed by loessification as a quasi-diagenetic process (CitationKoch & Neumeister, 2005; CitationPécsi, 1990; CitationPye, 1995; CitationSmalley, Markovic, & Svircev, 2011; CitationSprafke & Obreht, 2016; CitationSümegi, Nafradi, Molnar, & Savai, 2015).
Creating a cross-border loess map required a classification meeting both the Hungarian and modelled Romanian loess features. The classification by CitationKoch and Neumeister (2005) was adapted here, as presented in . This approach accounts for the genesis of loess sediments, and relates syn- and post-sedimentary processes (specifically the development of soils) for loess sediments with topographic conditions. Further, it combines sedimentological criteria (specifically grain size distributions) and empirically obtained data. The original Hungarian classification as presented in the Hungarian geological map is too detailed for a generalized approach extrapolating aeolian sediment distribution to other countries. It was summarized and simplified using the mentioned classification of CitationKoch and Neumeister (2005). Additionally, the term ‘Infusion Loess’ was changed to alluvial loess as suggested by CitationSümegi et al. (2015). Alluvial or infusion loess, respectively, displayed as the green patch on the CitationHaase et al. (2007) map, seems to be overrepresented in Hungary and largely absent in other countries. This modified classification was also adapted to the loess sediment model for the Romanian part of the map.
Table 1. Comparison of several loess sediment classifications.
3.3. Soil interpretation
The key challenge of this approach was the allocation of each soil to its parent substrate, such as loess sediments, for the Romanian part of the study area. Initially, soils are characterized by type and texture. The soil type determines the diagnostic or genetic properties of each soil while the soil texture represents the composition of grain sizes of the parent material and also gives indications of pedogenetic processes.
Figure 1. The study area in the Carpathian Basin. Modified according to CitationDolton (2006).
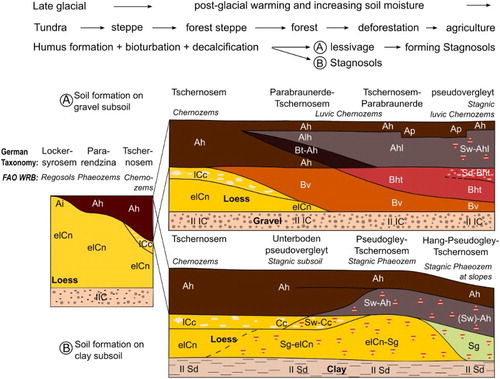
Loess and loess-like sediments are characterized by quite unique geochemistry and grain size composition (CitationPécsi, 1990; CitationPye, 1995; CitationSmalley et al., 2011). Also, several typical soils predominantly develop on loess (; CitationBlume et al., 2010; CitationKuntze, Roeschmann, & Schwerdtfeger, 1995).
Figure 2. Soil formation on loess sediments (modified after CitationKuntze et al., 1995).
Because of the composition of the Romanian pedological map with one layer for each soil type and texture, both layers could be used as independent indicators for the respective parental sediment. According to this the following research was undertaken in two phases.
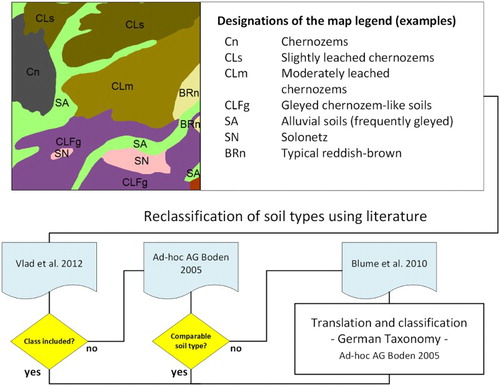
First, typical soil types accompanied with loess sediments were identified. Here the soil type classification of the German soil taxonomy was applied, because it describes soil types from a genetic perspective (CitationAd-hoc AG Boden, 2005). Through this, information on the underlying sediment was obtained. The international standard FAO World Reference Base for Soil Resources (WRB) taxonomy is descriptive instead and therefore less useful in this case. However, the WRB system was used to translate and reclassify the soil types from the Romanian pedological map into international standards.
All soil types of the Romanian pedological map were transferred into the WRB system initially using CitationVlad et al. (2012). If the soil types were not translated by CitationVlad et al. (2012), the descriptive remarks of the Romanian map’s legend were taken and compared with the official soil mapping instructions of CitationAd-hoc AG Boden (2005). If a soil type was still not identifiable the descriptions of pedogenetical processes were interpreted and referred to correlating soils using CitationBlume et al. (2010). In most cases the final translation into German taxonomy was done using CitationAd-hoc AG Boden (2005) ().
Figure 3. Process of translation of the Romanian soil map.
Thirteen major soil types could be identified and translated in this way. These were classified into four loess probability (LP) classes (LP0–LP3) and sand () in order to indicate the possibility of occurring loess sediments by soil type (CitationLindner, 2016). For example, Tschernozeme (WRB: Chernozems) are typical soils developing on loess sediments (CitationKuntze et al., 1995) and were ascribed the highest LP value LP3. Parabraunerden (Lessivés) often develop on loess, but can occur on other sediments as well. Both can be used as indicators for loess sediments, while Podsol (Podzols) are common on sand and make the presence of loess unlikely (CitationBlume et al., 2010; CitationKuntze et al., 1995). Additionally, Fahlerden (Albeluvisols) at the foothills of the Banat region were identified as soils on loess, too (CitationKels et al., 2014).
Table 2. Soil types and LP classes.
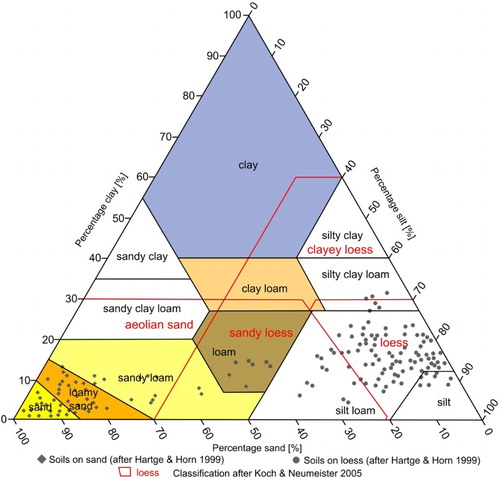
In a second step, the grain size distribution was examined. Thirteen classes of grain size composition were identified in the pedological map and transformed to a grain size ternary diagram (; CitationBlott & Pye, 2012; CitationHartge & Horn, 1999). Typical grain size ranges of loess sediments were taken from relevant literature and also integrated into the diagram (CitationKoch & Neumeister, 2005; CitationPécsi, 1990). The diagram was interpreted and classified analogous to the prior LP classification.
Figure 4. Comparison of grain sizes to soils and loess sediment classification (after CitationBlott & Pye, 2012).
Blending these two layers in a Geographic Information System enabled the basic distinction of loess sediments and sand from other rocks.
3.4. Determination of loess sediment classes by hypsometry and morphometry
Transportation and sedimentation of dust is determined by its specific grain size, weight and also regional atmospheric and geomorphological conditions. Sand can only be horizontally transported by wind over several metres, up to kilometres, while grains of silt or clay size can be transported in suspension over long distances of hundreds of kilometres and more. Also the vertical transportation is determined by size and weight of the grains. Sedimentation of dust occurs as dry and wet deposition (CitationHassenpflug, 1998; CitationMahowald et al., 2014; CitationPye, 1995; CitationPye & Tsoar, 2009; CitationTsoar & Pye, 1987; CitationWashington & Wiggs, 2011).
Through these mechanisms, and basic atmospheric conditions such as surface roughness or orographic precipitation, transport distances can be limited for example, at topographic barriers (CitationMahowald et al., 2014; CitationPye, 1995). Therefore a vertical zoning in grain size sorting of aeolian sediments can be observed at several slopes.
In order to classify the modelled loess sediments by grain size for the Romanian part of the Carpathian Basin, the assumption was made that atmospheric conditions during sediment deposition in Romania were comparable to those in Hungary.
Hypsometrical features of the already classified Hungarian sediment polygons were statistically analysed. Therefore zonal statistics were applied for each sediment class evaluating measures of central tendencies (minimum, mean, median, standard deviation and maximum values) on a 1-arc-second SRTM-DEM (CitationFarr et al., 2007). Bands of altitudes were identified and raster values corresponding to these bands were isolated ().
Figure 5. Hypsometric analysis of loess sediments in Hungary based on SRTM-Elevation Data.
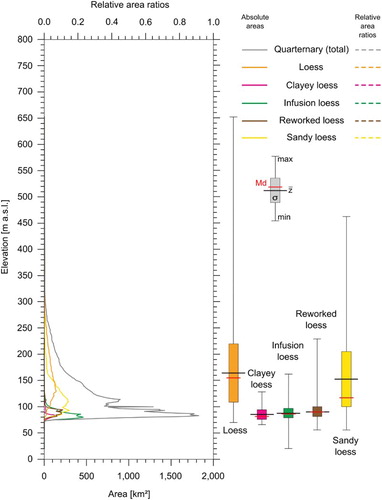
Deposition and fixation probably only occurs at slopes up to the natural angle of repose, therefore slope angles were also calculated and combined within the elevation bands. By this, loess and loess derivatives were separated. Assuming that deposited dust is relocated by eroding processes, in-situ loess needed to be distinguished from reworked loess. Therefore relative elevation changes were calculated. The topographic position index (TPI) and its deviation (DEV) was calculated over a cell size of 300 × 300 m (CitationDe Reu et al., 2013; CitationGallant & Wilson, 2000; CitationWeiss, 2001). Dune fields, gorges and valleys can be mapped and displayed at this scale. Afterwards the DEV was averaged using focal statistics over 3000 × 3000 m cell size. Relative high and relative flat areas were determined and put as a raster data set. Finally loess sediment deposits could be classified in grain size classes by their depositional behaviour or the corresponding deposition locations, respectively.
4. Map design
Based on the issues of previous loess distribution maps (CitationHaase et al., 2007; Main Map A) we improved the spatial loess data by using the geological map of Hungary (Main Map B), the translated and simplified soil map of Romania (Main Map C) and relief data (Main Map D). We created an improved map of the distribution of aeolian sediments in the eastern part of the Carpathian Basin (Main Map E).
The major aim was the creation of a seamless, more detailed map of loess sediment distribution for the project area (Hungary and western Romania) and to discover unmapped loess sediment deposits. The focus in designing the final map was to present the modelled data in a detailed but still legible way. Symbolization was done following CitationHaase et al. (2007) to keep both maps as comparable as possible. Major rivers and lakes were inserted to show possible dust sources as these may be relicts of the palaeo-landscape. Cities and national borders enable orientation in the study area.
A section of the loess distribution map by CitationHaase et al. (2007) is also shown to present the status quo of loess distribution maps in the study region (Main Map A) and to enable recognition of differences to the new map. Three synthesis maps (Main Maps B–D) are presented to display the results of the main steps: vectorization and Classification of the Hungarian geological map, translation of the Romanian soil map and the calculated TPI-DEV.
5. Discussion and interpretation
The new distribution map of loess and loess-like sediments and sand (Main Map E) provides information on the distribution of sediments in the western part of Romania. Importantly, it directly links to sediments in Hungary and challenges the break in aeolian sediments summarized by CitationHaase et al. (2007). It shows typical patterns of loess distribution in flat areas and lowlands and also in valleys and on terraces of the mountainous regions. The altitudinal behaviour of dust deposition and relocation of sediments is depicted by the in-situ loess and loess derivatives, and is visible in the mountainous regions. Related to the sedimentological behaviour of more heavy grains like sandy loess sediments or sand, these can only be found in lower and flat areas, at valley bottoms or at the more gentle slopes of the foot hills.
These results may be validated using actual scientific work in the study area. For example, CitationKels et al. (2014) mentioned thin loess and clayey loess on piedmont plains and valley terraces near Româneşti, located in the southeastern part of the study area.
6. Conclusions
The final map shows the potential loess and loess sediment distribution in the eastern Carpathian Basin at a large scale. Using several independent databases, our approach considers features of dust transportation, deposition with respect to the local topography and relates it to mapped soils, which may be a result of loess sediments as their parental material.
An English and generalized map of Quaternary sediments in Hungary is a welcome side product of this work. From this work we can conclude:
Soil maps may be valuable information when searching for information on the underlying geology.
In western Romania, loess and loess-like deposits (including sand) occur as may be expected.
The previously suggested difference between loess in Hungary and no loess occurring in western Romania is solely an artefact of different mapping.
The appearance of alluvial loess only in Hungary may be an artefact from regional classification and mapping. This should be validated by further studies on this kind of sediment in this region.
Care must be taken when interpreting geoscientific maps of for example, Quaternary deposits across borders. Differences may be caused by different mapping in several cases for the European Loess map.
7. Software
Mapping, processing and modelling were performed using Esri ArcGIS 10.3. Calculations and statistical analyses of raster data sets were also performed in ArcGIS 10.3. Further analysis of tables was done in Microsoft Excel 2013. The main graphics were created using Inkscape 0.91 and Corel Draw or Adobe Illustrator.
Spatial loess distribution in the eastern Carpathian Basin: a novel approach based on geoscientific maps and data.pdf
Download PDF (36.4 MB)Acknowledgements
The investigations were carried out as part of the CRC 806 ‘Our way to Europe’, subproject B1 ‘The Eastern Trajectory’: ‘Last Glacial Palaeogeography and Archaeology of the Eastern Mediterranean and of the Balkan Peninsula’, We thank Pal Sümegi and Daniel Veres for help with the Hungarian and Romanian maps. D. Haase is thanked for sharing shapefiles of the loess distribution map. We are grateful to Janek Walk for help with GIS and finalization of the maps. We thank the three reviewers P. Gibbard, G. Varga and T. Pingel for the valuable comments which improved the paper and maps.
Disclosure statement
No potential conflict of interest was reported by the authors.
ORCID
Frank Lehmkuhl http://orcid.org/0000-0002-6876-7377
Additional information
Funding
Related Research Data
References
- Ad-hoc AG Boden. (2005). Bodenkundliche Kartieranleitung KA 5. Hannover: BGR.
- Balogh, K., Erdélyi, M., Kretzoi, M., Rónai, A., Schréter, Z., Sümeghy, J., … Urbancksek, J. (1956). Magyarország földtani térképe, 1: 300,000. Budapest: Magyar Állami Földtani.
- Blott, S. J., & Pye, K. (2012). Particle size scales and classification of sediment types based on particle size distributions: Review and recommended procedures. Sedimentology, 59, 2071–2096. doi:10.1111/j.1365-3091.2012.01335.x
- Blume, H. P., Brümmer, G. W., Horn, R., Kandeler, E., Kögeler-Knabner, I., Kretzschmar, R., … Wilke, B.-M. (2010). Scheffer/Schachtschabel Lehrbuch der Bodenkunde. Heidelberg: Spektrum.
- Büttner, G., Kosztra, B., Maucha, G., & Pataki, R. (2010). Implementation and achievements of CLC2006. Brüssel: European Environment Agency.
- De Reu, J., Bourgeois, J., Bats, M., Sweertvaegher, A., Gelorini, V., De Smedt, P., … Crombé, P. (2013). Application of the topographic position index to heterogeneous landscapes. Geomorphology, 186, 39–49. doi:10.1016/j.geomorph.2012.12.015
- Dolton, G. L. (2006). Pannonian Basin Province, Central Europe (Province 4808) – Petroleum Geology, Total Petroleum Systems, and Petroleum Resource Assessment. US Geological Survey Bulletin, 2204-B, 1–53. Retrieved from http://pubs.er.usgs.gov/publication/b2204B
- European Environment Agency. (2014). CORINE Land Cover 2006 raster data. Version 17 (12/2013) – raster data on land cover for the CLC2006 inventory. 1–7.
- Farr, T. G., Rosen, P. A., Caro, E., Crippen, R., Doren, R., Hensley, S., … Alsdorf, D. (2007). The shuttle radar topography mission. Reviews of Geophysics, 45, RG2004. doi:10.1029/2005RG000183
- Florea, N., Conea, A., & Munteanu, I. (1971). Harta Pedologica a Repulicii Socialiste Romania – soil map of Romania. Institutul Geologic si Institutil de Studie si cercetari Pedologice. Retrieved from http://esdac.jrc.ec.europa.eu/images/Eudasm/RO/hun_x14.jpg; http://esdac.jrc.ec.europa.eu/images/Eudasm/RO/hun_x14_2.jpg
- Földvary, G. Z. (1988). Geology of the Carpathian region. Singapore: World Scientific Publishing.
- Gallant, J. C., & Wilson, J. P. (2000). Primary topographic attributes. In J. P. Wilson & J. C. Gallant (Eds.), Terrain analysis: Principles and applications (pp. 51–85). New York, NY: Wiley.
- Haase, D., Fink, J., Haase, G., Ruske, R., Pécsi, M., Richter, H., … Jäger, K. D. (2007). Loess in Europe – its spatial distribution based on a European Loess Map, scale 1:2,500,000. Quaternary Science Reviews, 26(9–10), 1301–1312. doi:10.1016/j.quascirev.2007.02.003
- Hartge, K. H., & Horn, R. (1999). Einführung in die Bodenphysik. Stuttgart: Schweizerbart.
- Hassenpflug, W. (1998). Bodenerosion durch wind. In G. Richter (Ed.), Bodenerosion – Analyse und Bilanz eines Umweltproblems (pp. 69–82). Darmstadt: Wissenschaftliche Buchgesellschaft.
- Horusitzky, H. (1898). Löszterületek Magyarországon [Loess areas in Hungary]. Paper. Retrieved from http://epa.oszk.hu/01600/01635/00026/pdf/Foldtani_kozlony_EPA01635_1898_01-04_029-036.pdf (in Hungarian). Map (in Hungarian and German legends) http://epa.oszk.hu/01600/01635/00026/pdf/Foldtani_kozlony_EPA01635_1898_01-04_tablak.pdf
- INSPIRE (2014). D2.8.I.1 data specification on coordinate reference systems – technical guidelines. Brüssel: INSPIRE Thematic Working Group Coordinate Reference Systems & Geographical Grid Systems.
- Kels, H., Protze, J., Sitlivy, V., Hilger, A., Zander, A., Anghelinhu, M., … Lehmkuhl, F. (2014). Genesis of loess-like sediments and soils at the foothills of the Banat Mountains, Romania. Examples from the paleolithic sites Româneşti and Coşava. Quaternary International, 351, 213–230. doi:10.1016/j.quaint.2014.04.063
- Koch, R., & Neumeister, H. (2005). Zur Klassifikation von Lößsedimenten nach geneti-schen Kriterien. Zeitschrift für Geomorphologie NF, Jahrgang, 49 S, 183–203.
- Kuntze, H., Roeschmann, G., & Schwerdtfeger, G. (1995). Bodenkunde. Stuttgart: UTB.
- Lehmkuhl, F., Hambach, U., Markovic, S., Zeeden, C., Bösken, J., Chu, W., … Timar-Gabor, A. (2015). Danube loess – paleoenvironmental record and potential eastern European corridor for the dispersal of modern humans (26.7.– 2.8.). Nagoya: INQUA.
- Lindner, H. (2016). Lössverbreitung im Pannonischen Becken – Problematik grenzüberschreitender Geodaten und Lösungsansätze mit GIS für eine Beispielregion (Grenzregion Ungarn-Rumänien) (MSc Thesis). RWTH Aachen University.
- Magyar, I., Radivojević, D., Sztanó, O., Syna, R., Ujszászi, K., & Pócsik, M. (2013). Progradation of the paleo-Danube shelf margin across the Pannonian Basin during the Late Miocene and Early Pliocene. Global and Planetary Change, 103, 168–173. doi:10.1016/j.gloplacha.2012.06.007
- Mahowald, N., Albani, S., Kok, J. F., Engelstaeder, S., Scanza, R., Ward, D. S., & Flanner, M. G. (2014). The size distribution of desert dust aerosols and its impact on the earth system. Aeolian Research, 15, 53–71. doi:10.1016/j.aeolia.2013.09.002
- Nilson, E., Köthe, R., & Lehmkuhl, F. (2007). Categorising inconsistencies between national GIS data in central Europe: Case studies from the country triangle of Belgium, the Netherlands and Germany. Applied GIS, 3(10), 1–20.
- Obreht, I., Zeeden, C., Schulte, P., Schulte, P., Hambach, U., Eckmeier, E., … Lehmkuhl, F. (2015). Aeolian dynamics at the Orlovat loess-paleosol sequence, northern Serbia, based on detailed textural and geochemical evidence. Aeolian Research, 18, 69–81. doi:10.1016/j.aeolia.2015.06.004
- Ovejanu, I., Candrea, B., & Crǎciunescu, V. (1968). Harta Geologică a Republicii Socialiste România 1:200.000. Bukarest: Comittul de stat al geologiei Institutul geologic. Retrieved March 26, 2016, from http://www.geo-spatial.org/file_download/27833
- Pécsi, M. (1990). Loess is not just the accumulation of dust. Quaternary International, 7–8, 1–21. doi:10.1016/1040-6182(90)90034-2
- Pye, K. (1995). The nature, origin, and accumulation of loess. Quaternary Science Reviews, 14, 653–667. doi:10.1016/0277-3791(95)00047-X
- Pye, K., & Tsoar, H. (2009). Aeolian sand and sand dunes. Berlin: Springer.
- Schönenberg, R., & Neugebauer, J. (1997). Einführung in die Geologie Europas. Freiburg: Rombach Verlag.
- Smalley, I. J., Markovic, S. B., & Svircev, Z. (2011). Loess is [almost totally formed by] the accumulation of dust. Quaternary International, 240, 4–11. doi:10.1016/j.quaint.2010.07.011
- Sprafke, T., & Obreht, I. (2016). Loess: Rock, sediment or soil – what is missing for its definition. Quaternary International, 399, 198–207. doi:10.1016/j.quaint.2015.03.033
- Sümegi, P., Nafradi, K., Molnar, D., & Savai, S. (2015). Results of paleoecological studies in the loess region of Szeged-Öthalom (SE Hungary). Quaternary International, 372, 66–78. doi:10.1016/j.quaint.2014.09.003
- Tsoar, H., & Pye, K. (1987). Dust transport and the question of desert loess formation. Sedimentology, 34, 139–153. doi:10.1111/j.1365-3091.1987.tb00566.x
- Vlad, V., Florea, N., Toti, M., Raducu, D., Munteanu, I., Seceleanu, I., … Vranceanu, A. (2012). Definition of the soil units of the 1:200,000 soil map of Romania using an extended terminology of the WRB system. Annals of the University of Craiova – Agriculture Montanology Cadastre Series, XLII – 2012/1, 615–639.
- Washington, R., & Wiggs, G. S. F. (2011). Desert dust. In D. S. G. Thomas (Ed.), Arid zone geomorphology – process, form and change in drylands (pp. 517–537). Chichester: Wiley.
- Weiss, A. D. (2001). Topographic position and landforms analysis. Poster Presentation. ESRI Users Conference, San Diego, CA. Retrieved from http://www.jennessent.com/downloads/tpi-poster-tnc_18×22.pdf
- Witschas, S. (2004). Cross-border mapping – geodata and geonames. In Borders in a new Europe. Association for Borderland Studies European Conference 2004, Graz, September 15–19, Proceedings.
- Witschas, S. (2005). Cross-border mapping – experiences with geodata and geonames. In XXII International cartographic conference, A Coruna 2005. Mapping approaches into a changing world. A Coruna: The International Cartographic Association.
- Witschas, S. (2007). Some aspects of “cross-border mapping” – spatial typology, geodata and geonames. 4th International conference, recent problems in geodesy and related fields with international importance. February 28–March 2, 2007, Inter Expo Centre, Sofia, Bulgaria.