
ABSTRACT
Three maps are presented that portray the periglacial geomorphology of the three summit areas of Bodmin Moor, Cornwall, SW England, including Brown Willy (scale 1:2630), Kilmar/Bearah/Sharp tors (scale 1:3335) and Rough/Little Rough/Showery tors (scale 1:2175). Landform elements include castellated tors with well-developed cantilevered or precariously balanced corestones, summit blockfields, rock-fronted lobes thought to record former permafrost creep, patterned ground (stripes) and lower slope accumulations of crudely stratified growan or weathered granite residue. The altitudinal arrangement of these periglacial landforms appears to be a signature of a well-established periglacial landsystem and hence the Bodmin Moor granite massif is a suitable exemplar for a mature upland periglacial landsystem unaffected by glacierization.
1. Introduction
Recent proposals that the uplands of southwest Britain formerly hosted glacier ice at some time during the Quaternary Period (CitationEvans, Harrison, Vieli, & Anderson, 2012a, Citation2012b; CitationHarrison, 2001; CitationHarrison, Anderson, & Passmore, 1998, Citation2001; CitationHarrison, Knight, & Rowan, 2015) have fundamentally questioned traditional interpretations of the geomorphology of the region as having evolved exclusively through periglacial processes and are therefore landscapes of great periglacial antiquity (e.g. CitationLinton, 1955). Although the notion of glaciation having affected the granite uplands of SW England was entertained as long ago as the mid-nineteenth century (CitationOrmerod, 1869), the subtlety of the geomorphological evidence for glaciation in such peripheral regions (CitationEvans, 2016) resulted in it being overlooked in relation to the more prominent periglacial landforms and deposits. It is surprising, therefore, that little systematic mapping of periglacial landforms has ever been undertaken on the granite uplands, an important exception being the assessment of Cox Tor and its environs by Citationte Punga (1956, Citation1957), CitationGerrard (1988) and CitationMiller (1990), where altiplanation terraces and spectacular examples of ‘clitter’ (blockfield) landforms such as boulder lobes and boulder runs were identified and used as exemplars of periglacial landscape maturity. Boulder runs and castellated tors in particular are definitively indicative of mature periglaciation in settings that have never been glaciated, such as the Falkland Islands for example (CitationClapperton, 1975; CitationClark, 1972; CitationHansom, Evans, Sanderson, Bingham, & Bentley, 2008; CitationJoyce, 1950; CitationWilson, Bentley, Schnabel, Clark, & Xu, 2008). More recently CitationEvans et al. (2012a, Citation2012b) and CitationHarrison and Evans (2014) have highlighted that the Cox Tor and neighbouring Staple Tor area, with its castellated tors, altiplanation terraces and mature boulder lobes and runs, contrasts markedly with the core of the north Dartmoor landscape where such apparently mature periglacial landforms are not as well developed; instead, this core area, the highest terrain of the Dartmoor uplands, is characterized predominantly by summits with subdued or no tors and a sparsity of mature boulder lobes and appears to have been formerly glaciated. Hence assessments of potential former glacier cover in the upland terrain of SW England require systematic and extensive mapping of the landform types generally regarded as indicators of periglacial landscape maturity. We report on the mapping of the summit areas of Bodmin Moor, a landscape hitherto unmapped in a systematic way with regards periglacial geomorphology. This project is designed to test the feasibility of assessing landform types, distribution and patterns using aerial photography in a landscape characterized by plateau extents and altitudes that elsewhere in the region have been proposed to be sufficient to generate glacier ice during the Quaternary glacial cycles.
2. Study area and methods
Bodmin Moor is a granite upland of 208 km2 in area, with numerous summits over 330 m OD and forms one of the many uplands of southwest England controlled by the injection of the Cornubian batholith. The highest summit, Brown Willy, at 420 m OD is the highest point in Cornwall and typifies not just the other summits on Bodmin but also many of those on neighbouring Dartmoor in that it comprises a well-developed, castellated summit tor, products traditionally regarded as indicators of significant periglacial landscape antiquity (e.g. Gerrard, Citation1978). They are associated with a range of landforms diagnostic of periglacial and permafrost development during cold stages of the Quaternary Period, identified by CitationMiller (1990) as blockfields and block streams, debris aprons, gelifluction slopes with gelifluction lobes, debris tongues, cryoplanation terraces and nivation hollows, earth hummocks, patterned ground, and scree or clitter slopes. CitationMiller (1990) also identified periglacial and permafrost features on lower slopes and valley floors surrounding the higher terrain, including pediments and ‘thermokarst features of a degraded ice-cored mound type’. The upland features have been developed in and on marked benches in the bedrock, which many have associated with long term landscape evolution and planation surfaces (CitationWeller, 1960). The upper surface is at 305 m OD and has been ascribed to marine planation. Three further surfaces occur at 259–289, 228–244 and 206 m OD, with the lowest also being ascribed to marine processes by CitationOrme (1960), CitationBrunsden (1962), CitationKidson (1962) and CitationBrunsden, Kidson, Orme, and Waters (1964). The lowest marine planation surface was thought to record an early Pleistocene or late Pliocene transgression, although CitationJones (1981) questioned the efficacy of marine erosion to produce such widespread planation. Moreover, there appears to be no firm agreement on the number and altitude or the exact origin of the planation surfaces across southwest England. Importantly in terms of the periglacial landscape legacy, CitationWaters (1971) identified a morphology that can be best described as broad flat topped interfluves on both Dartmoor and Bodmin moors and interpreted it as likely being dictated by the former base of the zone of weathering, exposed after long term stripping of regolith by gelifluction (cf. CitationStraw, 1985). In the absence of summit tors, such a surface morphology on north Dartmoor has been interpreted alternatively more recently by Evans et al. (Citation2012a, Citation2012b) as being indicative of glacier ice occupancy and hence the dampening of periglacial processes.
In order to systematically assess the nature and distribution of the periglacial landforms of Bodmin Moor, the major uplands were mapped (Main Maps 1–3) using 1:31,841 scale colour aerial photographs taken in 2011 and provided by the Ordnance Survey as orthorectified images covering individual British National Grid squares. Preliminary mapping, undertaken on drafting film, was refined by ground truthing, specifically verification of the nature and pattern of features on the ground, and then compiled in the iDraw graphics package by annotation directly on to the mosaicked aerial imagery. In order to maintain an appropriate level of objectivity, mapping predominantly identified individual large boulders and rock outcrops so that patterns could then be identified prior to interpretation and genetically based landform classification. For example, the dominant landsystem signature was one of summit tors and large rock outcrops surrounded by slopes covered in arcuate or lobate spreads of boulders. Additionally, stripes were identified using both boulder assemblages and localized vegetation changes and hence represented by a simple line symbol on the maps. Contours were added to the maps using the existing Ordnance Survey data from 1:25,000 scale map sheets. Final map reproduction was undertaken by importing the iDraw files into Adobe Illustrator. When printed out on A1 paper the maps have scales of 1:2630 (Brown Willy), 1:3335 (Kilmar tor) and 1:2175 (Rough Tor).
3. The periglacial landforms and sediments of the summit tors
Main Maps 1–3 portray the geomorphology of each of the three summit areas of Brown Willy, Kilmar/Bearah/Sharp tors and Rough/Little Rough/Showery tors respectively. Features identifiable from aerial photographs and therefore depicted on the maps include tors and large bedrock outcrops, surface boulders and patterned ground (stripes). Prominent cultural or archaeological features, especially walls, tracks and enclosures are also identified for context. This approach facilitates an assessment of the spatial distribution and pattern of high altitude periglacial features identified by CitationMiller (1990) as blockfields and block streams, debris aprons, gelifluction slopes with gelifluction lobes, debris tongues, patterned ground and scree or clitter. More difficult to assess from the aerial photography are cryoplanation terraces and nivation hollows and earth hummocks, although the accordant fronts of boulder lobes likely lie on the treads of bedrock terraces potentially created by cryoplanation.
3.1. Tors
The summit tors exemplified by the areas mapped in Main Maps 1–3 comprise predominantly narrow bedrock ridges and areas of low lying stumps where tor stacks have collapsed and their blocks have been transported short distances downslope in rock-fronted lobes (). The closely spaced pseudo-bedding or dilatation joints in the granite has given rise to tor stacks up to 10 m high that comprise thin, disc-like blocks (). Many of these have been heavily denuded into cantilevered or precariously balanced tor stacks, best exemplified in popular images by the Cheesewring on Stowes Hill (SX25754 72309) but also manifest in local outcrops on all the mapped summit areas ().
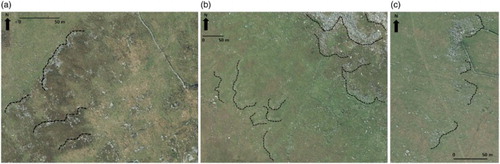
Figure 1. Aerial photograph extracts (Copyright Ordnance Survey) of: (a) Kilmar Tor and its surrounding boulder-fronted lobes (examples highlighted by dashed black lines). Note the narrow ridge-like tor, which is controlled by local bedrock structure, and toppled blocks that lie at the tor base and grade downslope into lobes; and (b) Rough Tor and its surrounding boulder-fronted lobes (examples highlighted by dashed black lines), showing also the narrow ridge-like main tor and lower height tors and stumps.
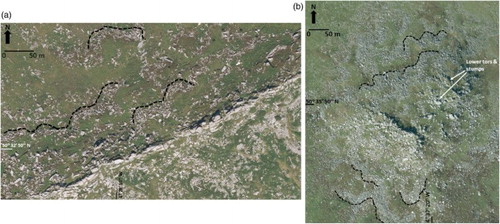
Figure 2. Examples of closely spaced granite pseudo-bedding controlling thin, disc-like blocks in tor stacks and stumps: (a) Rough Tor; (b) Brown Willy.
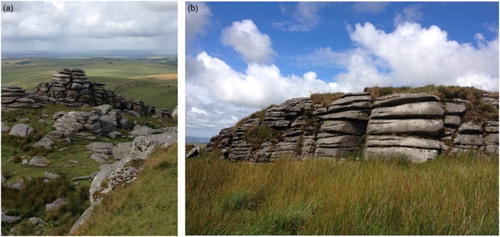
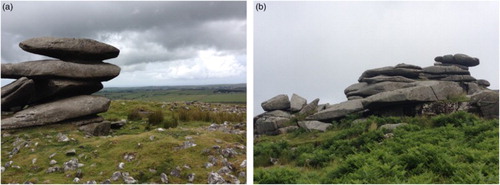
Figure 3. Examples of cantilevered tor stacks: (a) Rough Tor; (b) Sharp Tor.
3.2. Rock-fronted lobes and gelifluction sheets
The objective procedure of mapping all prominent surface boulders from the aerial photographs facilitates an unbiased assessment of potential patterns and hence the potential imprint of periglacial processes. Immediately apparent on Main Maps 1–3 are clear lobate-shaped assemblages of boulders which represent boulder-fronted lobes, many being several tens of metres wide, of the type previously identified by CitationMiller (1990) as gelifluction lobes, debris tongues and block streams emerging from summit blockfields ( and ). Slopes covered by such prominent assemblages of boulders are often termed ‘clitter slopes’ on Dartmoor (CitationAlbers, 1930; CitationGreen & Eden, 1973; CitationLinton, 1949, Citation1955; CitationWaters, 1964), where CitationHarrison, Anderson, and Winchester (1996) have invoked a genesis of permafrost creep of boulders after they have collapsed from tor stacks due to the process of macrogelifraction and thereby they could be regarded as mini rock glaciers.
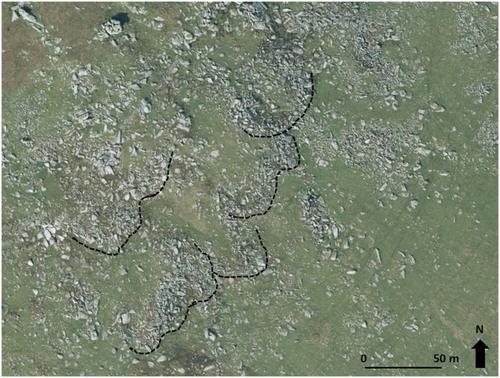
Figure 4. Aerial photograph extract (Copyright Ordnance Survey) of an example of boulder-fronted lobes immediately below the summit of Little Rough Tor. Note that lobes have clear risers (examples outlined by dashed black lines) and treads and lack vegetation cover due to the large sizes and numbers of blocks between which regolith has not developed or accumulated. Tor stumps are visible to top of image and downslope direction is towards bottom right. Note the size and number of the blocks compared to those in .
Different populations of lobes appear to be represented on the aerial imagery by a downslope decrease in boulder sizes and densities as well as an increase in vegetation cover (), which likely reflects increased regolith production and creep (predominantly by gelifluction) in a downslope direction. The lower slope lobes also appear more subdued in that it is difficult to identify a clear riser at the front of the treads ((c)). Similarly, at higher altitudes, the downslope decrease in the size of boulders from their summit blockfields at the base of tors and tor stumps to boulder-fronted lobes likely represents the continued mechanical breakdown of collapsed tor blocks due to ongoing macrogelifraction. The reduced boulder sizes apparent also in a downslope direction towards the older, lower elevation lobes, is a trend likely indicative of more advanced boulder breakdown and hence lobe relative ages. However, the transport of many relatively large blocks over long distances is apparent in some of the lobes of lower slopes, a characteristic also manifest in the sediments exposed in the few available stratigraphic sequences of the area (see Section 3.4).
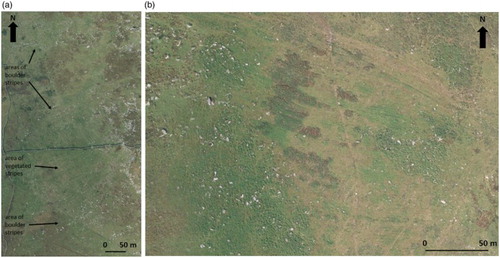
Figure 5. Aerial photograph extracts (Copyright Ordnance Survey) showing examples of different populations of boulder-fronted lobes at lower elevations to those depicted in from the edges of summit blockfields: (a) mid slope (intermediate age) lobes on the northwest slope of Brown Willy, where risers and treads are clearly visible but vegetation is well developed between boulder-fronts (examples outlined by dashed black lines). Downslope is towards the top left; (b) lobes of different appearance and hence age on the southwest slopes of South Rough Tor. Lower slope forms (bottom left) are defined by relatively smaller boulders, and extensive vegetation cover and ill-defined risers. Upper slope forms (top right) comprise steep and wide lobe fronts or risers containing large boulders and sparse vegetation cover (lobe front examples outlined by dashed black lines); (c) older lobes on the lowest slopes to the east of Rough Tor, showing subdued risers (examples outlined by dashed black lines) and well vegetated surfaces.
3.3. Patterned ground
The only patterned ground that is unequivocally visible on the aerial photography of the mapped summits of Bodmin Moor is slope stripes (). These are mostly subtle but distinct on most intermediate or mid to lower slopes but have likely been heavily modified or even removed on the lowest slopes by agricultural improvements. As these features are well vegetated it is difficult to assess their exact genesis with respect to the development of boulder-fronted lobes but they do appear to have been mostly developed on the finer-grained treads of lobes and hence represent late stage slope-generated reorganizations of relatively finer-grained gelifluction materials. Some stripes are also recognizable as boulder lines, potentially demarcating the downslope modification or elongation of boulder-fronted lobes. CitationMiller (1990) identified a range of patterned ground forms from polygons to garlands and stripes, and proposed that on upper convex slopes the polygonal summit patterns gradually merge into stone garlands, and then in turn downslope into the most common patterned ground type of stripes on slopes of 5–6°.
Figure 6. Aerial photograph extracts (Copyright Ordnance Survey) showing striped patterned ground on the intermediate or mid slope to the (a) west and (b) southeast of the Brown Willy summit. The latter shows vegetated stripes.
3.4. Periglacial slope deposits
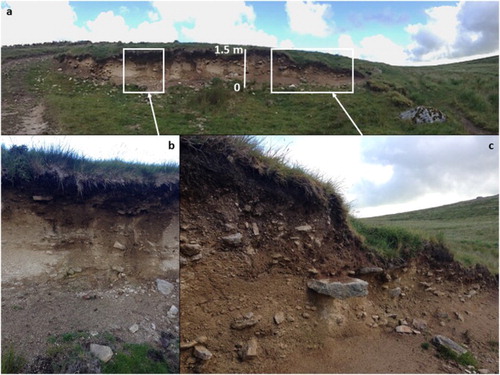
The landforms mapped below the summit tors on Bodmin Moor are representative of what CitationMiller (1990) refers to as ‘debris aprons’ or ‘debris mantled slopes’. The slow process of downslope migration of boulder-fronted lobes or clitter by a combination of (a) initial permafrost creep and (b) gradually increasing amounts of gelifluction associated with downslope decreases in grain size, gives rise to a valley floor thickening sequence of periglacial slope deposits or ‘head’. Few exposures are available for scrutiny around Bodmin Moor but one such exposure in the upper De Lank River between Rough Tor and Brown Willy can be presented briefly here as an example of the material properties characteristic of the lower slopes in Main Maps 1–3 (). The 1.5 m high sequence displays very crudely stratified sandy, granule gravels (growan or weathered granite residue) containing discontinuous beds of fine to cobble gravels and horizons and isolated cobble to boulder-sized clasts. Clast forms are predominantly very angular to angular slabs with some examples of minor edge rounding. The finer sandy granule gravels constitute a matrix around the larger clast sizes, especially in the lower 1 m of the exposure and this matrix is strongly fissile in nature. The sequence coarsens upwards into a very crudely stratified to massive cobble to boulder gravel which appears diamictic over most of its outcrop. This upper sedimentary unit contains the majority of the boulders at the exposure, and most boulders throughout the sequence are aligned A-axis-parallel to the valley floor gradient.
Figure 7. The sedimentary exposure through the valley floor deposits in the De Lank River showing: (a) the architecture of the whole exposure; (b) the two-tiered stratigraphy of upper and lower head; and (c) the crude stratification and discontinuous boulder and gravel horizons in the lower fissile sandy granule gravels overlain by the coarser diamicton (lower and upper head deposits respectively).
Unlike the exposures through many upper valley floor fissile diamictons on Dartmoor, the sediments in the De Lank River exposure contain no potential glacigenic clast forms and their crude stratification is likely indicative of slope base accumulations of periglacial materials. The two-tiered stratigraphy has been recognized elsewhere on Bodmin Moor and Dartmoor. Earlier interpretations of this by CitationWaters (1964) proposed two separate phases of head sedimentation whereby initial stripping and resedimentation of fine-grained material (growan) from valley sides was followed by its burial by coarser material created by subsequent frost-shattering of freshly exposed bedrock. However, CitationMiller (1990) has alternatively suggested that the larger blocks within the so-called ‘upper head’ were rafted downslope on the main body of head and hence are not separated significantly in time; this argument may be purely semantic as CitationWaters (1964) did infer that the sequence represented an inversion of the pre-existing granite weathering profile through progressive mass wasting. This is very similar to the exposures through ancient stone runs such as those on the Falkland Islands (CitationHansom et al., 2008) and hence would not be unusual in valley floor settings in ancient periglacial landscapes. However, the age of these deposits and hence the mapped slope forms on Bodmin Moor is unknown and whether they record numerous periods of cold climate conditions or merely the intensive periglacial processes of just the last glacial cycle is yet to be determined.
4. The periglacial landsystem of Bodmin Moor and its implications for Quaternary landscape evolution
The altitudinal arrangement of periglacial landforms on the highest Bodmin Moor summits, as reported by CitationMiller (1990) and depicted here in Main Maps 1–3, appears to be a signature of a well-established and potentially mature periglacial landsystem, the evolution of which appears not to have been interrupted by glaciation as recently proposed for north Dartmoor by CitationEvans et al. (2012a, Citation2012b). Particularly diagnostic of mature periglacial and likely permafrost landforms are castellated tors with locally well-developed cantilevered corestones, grading downslope into blockfield derived from tor stack collapse and then into rock-fronted lobes or patterned clitter fields. Precariously balanced or cantilevered tor corestones have been convincingly employed as indicators of non-glaciated terrain on the Isles of Scilly by CitationScourse and Furze (2001) and CitationHiemstra et al. (2006), where they lie beyond glaciated areas characterized by modified tors whose upper corestones have been removed by glacial erosion (cf. CitationPhillips, Hall, Mottram, Fifield, & Sugden, 2006). A similar use of tor morphology has been employed by CitationEvans et al. (2012a, Citation2012b) to support the proposal of former glaciation of the widest and highest summits on North Dartmoor. In contrast, on Bodmin Moor the occurrence of castellated tors (Type 1 of CitationEvans et al. 2012a, Citation2012b) and the associated altitudinal zonation of blockfield into rock-fronted lobes, potentially indicative of permafrost creep (CitationHarrison et al., 1996), and their downslope gradation into more muted and hence likely relatively older forms is a landsystem signature of mature upland periglaciation. However, the exact age of this landsystem is difficult to assess as no absolute ages are presently available for either the periglacial landforms or deposits. Hence the landsystem signature may have been generated over the last glacial cycle or longer. Nevertheless, landforms that indicate extreme periglacial landscape maturity elsewhere, for example the stone runs of the Falkland Islands (CitationHansom et al., 2008; CitationWilson et al., 2008), are not well developed around the lower slopes of the Bodmin Moor tor summits. Their occurrence in surrounding valleys, beyond the mapping areas presented in this paper, could potentially verify extreme periglacial landsystem age.
5. Conclusions
Although Dartmoor has traditionally been championed as the exemplar of ancient periglaciated landscapes, particularly in the British Isles, the recent identification of evidence for potential glaciation of the area has questioned this long standing notion. Mapping of the landforms on the highest summits of Bodmin Moor indicates that this granite massif is a more suitable exemplar for a mature upland periglacial landsystem unaffected by glacierization. This landsystem is characterized by castellated summit tors with cantilevered or delicately balanced in situ corestones, rock-fronted gelifluction lobes and sheets with likely permafrost creep origins and of apparently variable relative ages, and lower slope accumulations of periglacial slope deposits or head. The testing of the glaciation hypothesis for periglaciated upland landscapes that lie peripheral to the last ice sheets in the British Isles requires systematic and comprehensive mapping of the nature and pattern of periglacial landforms. However, although landform maturity and hence operation through multiple glacial cycles is likely represented in castellated/cantilevered tors and multiple generations of large rock-fronted lobes indicative of permafrost creep, further investigations into the absolute dating of the periglacial landsystem are the next logical step in assessing notions of its extreme age.
Software
Mapping on directly on the imported digital aerial photographs was undertaken using the iDraw graphics package. Final map reproduction was undertaken by importing the iDraw files into Adobe Illustrator.
Periglacial geomorphology of summit tors on Bodmin Moor, Cornwall, SW England.zip
Download Zip (38.8 MB)Acknowledgements
Thanks to the Ordnance Survey for providing the aerial photography that made this project possible. Comments by reviewers Jasper Knight, Piotr Migoń and John Abraham helped us to clarify our message.
Disclosure statement
No potential conflict of interest was reported by the authors.
Related Research Data
References
- Albers, G. (1930). Notes on the tors and the clitter of Dartmoor. Transactions of the Devonshire Association for the Advancement of Science, Literature and Art, 62, 373–378.
- Brunsden, D. (1962). The erosion surfaces of the river dart. Proceedings of the Ussher Society, 1, 35–36.
- Brunsden, D., Kidson, C., Orme, A. R., & Waters, R. S. (1964). Denudation chronology of parts of South Western England. Field Studies, 2, 115–132.
- Clapperton, C. M. (1975). Further observations on the stone runs of the Falkland Islands. Biuletyn Peryglacjalny, 24, 211–217.
- Clark, R. (1972). Periglacial landforms and landscapes in the Falkland Islands. Biuletyn Peryglacjalny, 21, 33–50.
- Evans, D. J. A. (2016). Landscapes at the periphery of glacierization – Retrospect and prospect. Scottish Geographical Journal, 132, 140–163. doi: 10.1080/14702541.2016.1156732
- Evans, D. J. A., Harrison, S., Vieli, A., & Anderson, E. (2012a). The glaciation of Dartmoor: The southernmost independent Pleistocene ice cap in the British Isles. Quaternary Science Reviews, 45, 31–53. doi: 10.1016/j.quascirev.2012.04.019
- Evans, D. J. A., Harrison, S., Vieli, A., & Anderson, E. (2012b). Dartmoor’s overlooked glacial legacy. Geology Today, 28, 224–229. doi: 10.1111/j.1365-2451.2012.00855.x
- Gerrard, A. J. W. (1978). Tors and granite landforms of Dartmoor and Eastern Bodmin Moor. Proceedings of the Ussher Society, 4, 204–210.
- Gerrard, A. J. W. (1988). Periglacial modification of the cox tor-staples tor area of western Dartmoor, England. Physical Geography, 9, 280–300.
- Green, C. P., & Eden, M. J. (1973). Slope deposits on the weathered Dartmoor granite, England. Zeitschrift fur Geomorphologie, Supplement Band, 19, 26–37.
- Hansom, J. D., Evans, D. J. A., Sanderson, D. C. W., Bingham, R. G., & Bentley, M. J. (2008). Constraining the age and formation of stone runs in the Falkland Islands using optically stimulated luminescence. Geomorphology, 94, 117–130. doi: 10.1016/j.geomorph.2007.05.006
- Harrison, S. (2001). Speculations on the glaciation of Dartmoor. Quaternary Newsletter, 93, 15–26.
- Harrison, S., Anderson, E., & Passmore, D. G. (1998). A small glacial cirque basin on Exmoor, Somerset. Proceedings of the Geologists’ Association, 109, 149–158. doi: 10.1016/S0016-7878(98)80014-X
- Harrison, S., Anderson, E., & Passmore, D. G. (2001). Further glacial tills on Exmoor, Southwest England: Implications for small ice cap and valley glaciation. Proceedings of the Geologists’ Association, 112, 1–5. doi: 10.1016/S0016-7878(01)80043-2
- Harrison, S., Anderson, E. A., & Winchester, V. (1996). Large boulder accumulations and evidence for permafrost creep, great Mis Tor, Dartmoor. In D. J. Charman, R. M. Newnham, & D. G. Croot (Eds.), The Quaternary of Devon and east Cornwall: Field guide (pp. 102–105). London: Quaternary Research Association.
- Harrison, S., & Evans, D. J. A. (2014). Permafrost and periglacial geomorphology. In D. J. A. Evans & S. Harrison (Eds.), The Quaternary glaciation of Dartmoor – Field guide. Quaternary research association (pp. 22–30). London: Quaternary Research Association.
- Harrison, S., Knight, J., & Rowan, A. V. (2015). The southernmost quaternary niche glacier system in Great Britain. Journal of Quaternary Science, 30, 325–334. doi: 10.1002/jqs.2772
- Hiemstra, J. F., Evans, D. J. A., Scourse, J. D., Furze, M. F. A., McCarroll, D., & Rhodes, E. (2006). New evidence for a grounded Irish Sea glaciation of the Isles of Scilly, UK. Quaternary Science Reviews, 25, 299–309. doi: 10.1016/j.quascirev.2005.01.013
- Jones, D. K. C. (1981). The geomorphology of the British Isles: Southeast and Southern England. London: Methuen.
- Joyce, J. R. F. (1950). Stone runs of the Falkland Islands. Geological Magazine, 87, 105–115. doi: 10.1017/S0016756800076603
- Kidson, C. (1962). The denudation chronology of the River Exe. Transactions of the Institute of British Geographers, 31, 43–66. doi: 10.2307/621086
- Linton, D. L. (1949). Unglaciated areas in Scandinavia and Great Britain. Irish Geography, 2, 25–33.
- Linton, D. L. (1955). The problem of tors. The Geographical Journal, 121, 470–487. doi: 10.2307/1791756
- Miller, D. J. (1990). Relict periglacial phenomena within the Tamar Basin, West Devon and East Cornwall: Their significance with regard to climatic reconstruction (Unpublished PhD thesis). University of Exeter.
- Orme, A. (1960). The raised beaches and strandlines of South Devon. Field Studies, 1, 1–22.
- Ormerod, E. (1869). Sketch of the granite of the northerly and easterly sides of Dartmoor (pp. 98–99). Report of the British Association, Transactions of the Sections.
- Phillips, W. M., Hall, A. M., Mottram, R., Fifield, L. K., & Sugden, D. E. (2006). Cosmogenic 10Be and 26Al exposure ages of tors and erratic, Caringorm Mountains, Scotland: Timescales for the development of a classic landscape of selective linear glacial erosion. Geomorphology, 73, 222–245. doi: 10.1016/j.geomorph.2005.06.009
- Scourse, J. D., & Furze, M. F. A. (2001). A critical review of the glaciomarine model for Irish Sea deglaciation: Evidence from southern Britain, the Celtic shelf and adjacent continental slope. Journal of Quaternary Science, 16, 419–434. doi: 10.1002/jqs.629
- Straw, A. (1985). Observations on certain large scale geomorphological features in Southwest England. Proceedings of the Ussher Society, 6, 265–267.
- te Punga, M. T. (1956). Altiplanation terraces in Southern England. Biuletyn Peryglacjalny, 4, 331–338.
- te Punga, M. T. (1957). Periglaciation in Southern England. Tijdschrift van het Konin. Nedelandsch Naardr. Genoot., 74, 401–412.
- Waters, R. S. (1964). The Pleistocene legacy to the geomorphology of Dartmoor. In I. G. Simmons (Ed.), Dartmoor essays. Devonshire Association for the Advancement of Science (pp. 73–96). Exeter: Devonshire Association for the Advancement of Science.
- Waters, R. S. (1971). The significance of quaternary events for the landform of South West England. In K. J. Gregory & W. L. D. Ravenhill (Eds.), Exeter essays in geography (pp. 23–31). Exeter: University of Exeter.
- Weller, M. R. (1960). The erosion surfaces of Bodmin Moor. Transactions of the Royal Geological Society of Cornwall, 19, 233–242.
- Wilson, P., Bentley, M. J., Schnabel, C., Clark, R., & Xu, S. (2008). Stone run (block stream) formation in the Falkland Islands over several cold stages, deduced from cosmogenic isotope (10Be and 26Al) surface exposure dating. Journal of Quaternary Science, 23, 461–473. doi: 10.1002/jqs.1156