
ABSTRACT
The article presents the 1:25,000-scale geomorphological map of the upper reaches of the Curueño River, on the southern slope of the Central Cantabrian Mountains, NW Spain. The study area spans approximately 125 km2 and corresponds to the 1:25,000-scale Spanish National Topographical Map Sheet 104-I of Lugueros. The area is moderately mountainous with elevation ranging from 1100 to 2100 m.a.s.l. The main landforms are river gorges, karst, and glacial landforms. The map legend contains 78 elements divided into 9 groups: litho-structural, polygenic, karst, fluvial, glacial, periglacial, nival, gravitational, weathering, and anthropic forms. The map was prepared using Esri ArcGIS with the Universal Transverse Mercator (UTM, Zone 30) projection. In addition, a database and style set were created for each landform with the goal of using this set of symbols in other areas and performing complementary mapping of geologic and geomorphologic risk, protection of natural geoheritage, land-use classification, and applied geomorphology.
1. Introduction
Geomorphological mapping has been a basic component of geomorphological work since the first geomorphological maps were prepared in the early twentieth century (CitationBeckinsale & Chorley, 1991). Its importance is that with a map, any landform can be located and recorded spatially. Such a map also creates possibilities for performing other geomorphological tasks such as measurement of landforms, quantification, and statistical analysis, studies on evolution of and interrelations between landforms, and development of secondary thematic maps. The value of a geomorphological map, as expressed by Jean CitationTricart (1979), is that it is like a ‘population census that does not allow any object to escape’ and from which one can extract abundant information needed in the Earth sciences and other fields of knowledge.
However, the systematic development of geomorphological maps and legends in a standard way did not begin until the 1960s (CitationVerstappen, 2011). Since then, countries such as Poland, France, the Netherlands, Germany, the United Kingdom, Romania, Hungary, the USA, and Italy have constructed geomorphological maps at various scales, often by using a grid designed for topographical maps of those countries. Conferences and congresses held (CitationDemek & Emblenton, 1978) consolidated the development of geomorphological cartography as a discipline during the 1970s and 1980s. Research groups, commissions, and national and international institutions expended tremendous effort to develop standardized maps and legends (CitationParon & Claessens, 2011; CitationPavlopoulos, Evelpidou, & Vassilopouslos, 2009). In recent years, the use of Geographic Information Systems (GIS) has improved the development of geomorphological maps (CitationGustavsson, 2006; CitationKertesz & Markus, 1992; CitationMinár, Mentlík, Jedlička, & Barka, 2005; CitationPavlopoulos et al., 2009).
In Spain, geomorphological maps have been carried out at various scales, being most notable in the Pyrenees (CitationGarcía-Ruiz et al., 2011) and the Iberian Range (CitationArnáez-Vadillo & García-Ruiz, 1990; CitationGarcía-Ruiz, Gómez-Villar, Arnáez-Vadillo, & Ortigosa-Izquierdo, 2007). In contrast, geomorphological maps in the Cantabrian Mountains are less common, although some regional maps have been developed since the 1990s (e.g. CitationAlonso, 2014; CitationGarcía de Celis, 1997; CitationGonzález-Gutiérrez, 2002; CitationGonzález-Trueba, 2007; CitationPellitero, 2014; CitationPellitero, Manosso, & Serrano, 2014; CitationRodríguez-Pérez, 2009; CitationRuiz-Fernández, 2011; CitationSantos-González, 2011; CitationSerrano & González-Trueba, 2005). Most of these maps address only selected geomorphological features such as fluvial, glacial, periglacial, slope, structural, or karst landforms, although they show careful attention to cartographic detail (CitationBallesteros, Jiménez-Sánchez, Giralt, García-Sansegundo, & Meléndez-Asensio, 2015a; CitationDomínguez-Cuesta, Jiménez-Sánchez, & Berrezuela, 2007; CitationFrochoso-Sánchez & Castañón-Álvarez, 1998; CitationRedondo-Vega, Gómez-Villar, González-Gutiérrez, & Carrera-Gómez, 2002; CitationRedondo-Vega, Gómez-Villar, González-Gutiérrez, & Santos-González, 2010).
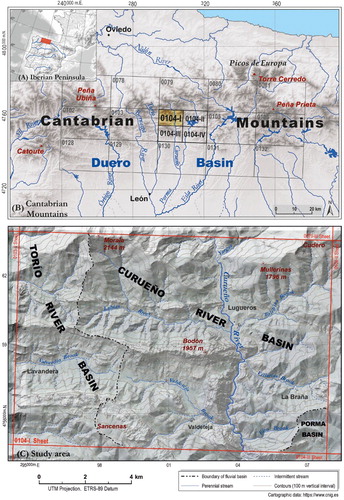
Topographic Sheet number 104-I of Lugueros spans the South middle part of the Central Cantabrian Mountains, in the north-western Iberian Peninsula. The design of this map follows the grid created by the Spanish National Geographic Institute (IGN) for the presentation of topographic maps at scales of 1:50,000 and 1:25,000 ((A)). The objective of this work is to produce a 1:25,000 scale map to improve the geomorphological knowledge of the area and to create a suitable symbology for the geomorphological representation with Esri ArcGIS at this scale. This map is also the basis for future thematic and applied maps in this study area.
Figure 1. Location of the study area in NW Iberian Peninsula (A) and Cantabrian Mountains (B) and its location in relation to the Spanish topographic map at scales of 1:50,000 and 1:25,000. (C) Physiographic features of Lugueros Sheet 104-I.
2. Study area
The study area spans nearly 125 km2 and is located on the southern side of the Cantabrian Mountains, Province of León, NW Spain ((A)). The main watercourse is the Curueño River, which flows to the south into the Porma River. The western portion belongs to the Torío River, a tributary of the Bernesga River, and the lower right part spans part of the Porma basin, which empties into the Esla River ((B)). All these rivers are part of the Duero drainage. The relief is abrupt, with altitudes between 1100 and 2100 m.a.s.l. The climate is oceanic (Cfb according to the Köppen classification, with variations due to altitude and exposure), with 1200–1700 mm of mean annual precipitation. Mean annual temperature (based on data or nearby meteorological stations) is around 9°C in the lowest areas and 2°C at the summits (CitationAEMET-IM, 2011).
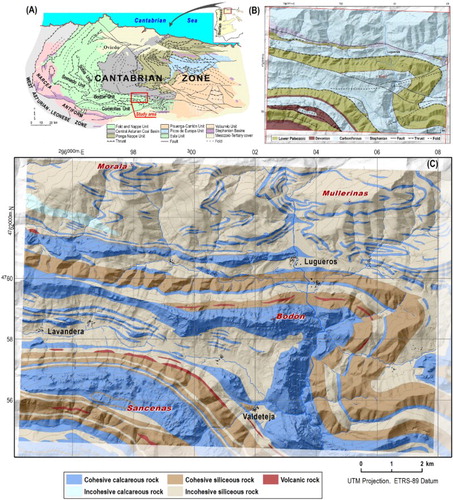
The geology of the study area is dominated by a Palaeozoic sedimentary series ranging from Cambrian to Carboniferous age. Limestone, quartzite, sandstone, shale, lutite, and dolomite are the predominant rocks (CitationTruyols et al., 1984). These rocks were deformed during the Variscan Orogeny, when the main tectonic structures were formed (). This area is part of the Fold and Thrust Region and the Central Coal Basin (CitationAlonso, Marcos, & Suárez, 2009; CitationPérez-Estaún et al., 1988), which includes many thrusts, folds, and faults. Both tectonostratigraphic provinces belong to the Cantabrian Zone, which makes up a major portion of the Iberian Massif (CitationLotze, 1945).
Figure 2. Geology of Lugueros sheet 104-1: rock types: (A) regional geological framerock; (B) age, palaeozoic structures and geologic units of study area; and (C) main lithologies.
The present morphostructural landforms of the area are related to the Alpine Orogeny, which uplifted the Cantabrian Mountains in relation to the Cenozoic Duero basin generating an alpine structure formed by a south-direct thrust system (CitationAlonso et al., 2009; CitationAlonso, Pulgar, García-Ramos, & Barba, 1996). Morphologically, these processes generated uplifted and sunken blocks (CitationGarcía-Fernández, 2006; CitationGonzález-Gutiérrez, 2002). The fluvial system was also modified by this new morphostructural arrangement. Throughout the Neogene and Quaternary the rivers organized hierarchically to accommodate the reactivated blocks of the Variscan massif. The main river valleys follow the line of maximum slope between the Cantabrian divide and the Duero basin, cutting the geological structures perpendicularly. Where the rivers cross cohesive rocks, they follow lines of tectonic weakness and carve deep epigenetic gorges in a process that is still ongoing (CitationFrochoso Sánchez, 2016).
The present relief of the Cantabrian Mountains comprises glacial (e.g. CitationFrochoso, González-Pellejero, & Allende, 2013; CitationGómez-Villar, Santos-González, González-Gutiérrez, & Redondo-Vega, 2015; CitationJiménez-Sánchez et al., 2013; CitationRodríguez-Rodríguez et al., 2016; CitationRodríguez-Rodríguez, Jiménez-Sánchez, Domínguez-Cuesta, & Aranburu, 2015; CitationRuiz-Fernández, Poblete-Piedrabuena, Serrano-Muela, Martí-Bono, & García-Ruiz, 2009; CitationSantos-González, Redondo-Vega, González-Gutiérrez, & Gómez-Villar, 2013; CitationSantos-González, Santos, González-Gutiérrez, Redondo-Vega, & Gómez-Villar, 2013; CitationSerrano, González-Trueba, Pellitero, González-García, & Gómez-Lende, 2013), periglacial (e.g. CitationGómez-Villar, González-Gutiérrez, Redondo-Vega, & Santos-González, 2011; CitationNieuwendam et al., 2016; CitationPisabarro, Pellitero, Serrano, Gómez-Lende, & González-Trueba, 2017), fluvial (e.g. CitationGómez-Villar, Redondo-Vega, González-Gutiérrez, & Carrera-Gómez, 2002), karst (e.g. CitationAranburu et al., 2015; CitationBallesteros et al., 2015), gravitational (e.g. CitationDomínguez-Cuesta et al., 2007; CitationMenéndez Duarte & Marquínez, 2002), and anthropic (e.g. CitationRedondo-Vega, Gómez-Villar, Santos-González, González-Gutiérrez, & Álvarez Martínez, 2017) landforms.
3. Materials and methods
The following cartographic sources were used to prepare the geomorphological map: a vector map provided by the Spanish Geographic National Institute (IGN) (http://www.ign.es/), geologic information available from the Geological and Mining Institute of Spain (IGME, http://www.igme.es/), aerial photographs from the National Plan of Aerial Orthophotography (PNOA), performed by the Spanish Geographic National Institute and Agrarian Technological Institute of the Castilla and León Region (ITACYL, http://www.itacyl.es/).
Following CitationKnight, Mitchell, and Rose (2011), the following steps were performed for the preparation of the map (Main Map):
A preliminary geomorphological map was prepared at a scale of 1:10,000 based on the existing literature and the interpretation of aerial photographs.
Fieldwork was performed to identify landforms and deposits not recognized in the aerial photography or digital orthoimagery.
A georeferenced database of all landforms was created, and symbols for representing each landform at a scale of 1:25,000 were designed.
Graphic design was performed for the final printing at a scale of 1:25,000.
The geomorphologic map was produced in Esri ArcGIS 10.3 at a scale of 1:25,000 with a Universal Transverse Mercator (UTM) projection (Zone 30) and the European Terrestrial Reference System 1989 Datum (ETRS89). The mapped landforms were classified in to nine groups: litho-structural and karst landforms, weathering and gravitational landforms, polygenetic erosion surfaces, and glacial, periglacial, and fluvial forms. In some areas, there is an overlap between landforms (e.g. karst and glacial landforms in the Sancenas massif), hindering the decision about symbol representation. In these cases, the main landform has been chosen.
Three considerations were taken into account when creating the geomorphological map, such as the choice of symbols as a function of the map scale, graphic design, and, in particular, the inclusion of each landform in the georeferenced database. The symbols were driven by a vector model: the landforms were represented by points, lines, or polygons, and care was taken to select their size to accommodate the map scale. Because the map scale is 1:25,000, features smaller than 50–75 m (2–3 mm on the map) were represented by points, and line or polygon formats were reserved for features larger than this threshold. Because certain landforms range greatly in size, they are represented by different symbols consisting of points, lines, or polygons, for example, are sinkholes. Certain point features are shown larger than their true size due to their geomorphologic value. These features include glacial erratic boulder, kettle, ponor, surgence, and terracette, which are the results of important dynamics or processes that must be mapped, however, small the feature might be.
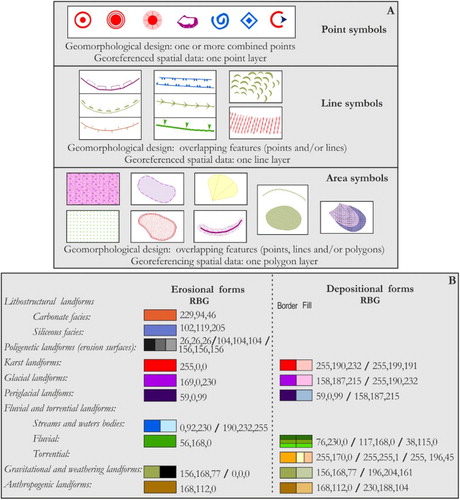
The second aspect of the preparation was designing the symbols. Several systems that have been used to represent landforms since the mid-twentieth century were taken into account: the French system of the Centre National de la Recherche Scientifique (CitationCNRS, 1976; CitationJoly, 1997), the Dutch system proposed by the International Institute for Geo-Information Science and Earth Observation (CitationVerstappen & Van Zuidam, 1991), and numerous adaptations used in various locations in Spain (CitationChueca-Cía & Julián-Andrés, 2008; CitationGómez-Ortiz, 2002; CitationPeña-Monné, 1997; CitationRuiz-Fernández, 2011). The symbols were grouped by colour based on their geomorphic dynamics and processes and, where possible, by distinguishing between erosional and sedimentary landforms ((B)).
Figure 3. (A) Symbols used in the geomorphological representation and (B) the colour scheme in decimal codes colour of the RBG (red, blue, green) model.
Other systems were also reviewed when matching certain landforms or creating new symbols adapted to the study area. These systems include those of IGME and the geomorphological maps accompanying the latest geological maps of the MAGNA series (CitationMartín-Serrano, Salazar, Nozal, & Suárez, 2004); the system of the IGN presented by CitationHerrero-Matías (1988); the legend developed by the Geographic Institute of Lausanne University (IGUL), which is devised for mountainous environments (CitationPellitero, 2014; CitationReynard, Holzmann, Lambiel, & Phillips, 2005); and the nearly 400 symbols in the Italian system, which are vector and separated into erosional and depositional landforms (CitationDramis & Bisci, 1998; CitationPanizza, 2005; CitationServizio Geologico Nazionale, 1994).
A third important aspect of the preparation was the adaptation of the geomorphological symbols to the georeferenced database of the GIS. This step entailed the construction of a geomorphological information system (GmIS) in the style of CitationMinár et al. (2005), CitationDramis, Guida, and Cestari (2011), and CitationKertesz and Markus (1992). The information presented on the map should be amenable to revision to develop new applied and dynamic geomorphological maps for physiographic, morphometric, morphodynamic, and/or chronological analyses, all of which can be obtained from the information in the database associated with each mapped landform (CitationDemek, Kirchner, Mackovčin, & Slavik, 2011; CitationGustavsson, 2006; CitationGustavsson, Kolstrup, & Seijmonsbergen, 2006).
The map is a basic geomorphological map with large-scale details (CitationDramis et al., 2011) focusing on morphodynamic and morphogenetic features of the terrain. The main structural landforms related to tectonic features (faults and thrusts) were not mapped, given that they only allow the production of a geomorphological map of morphostructures (CitationGonzález-Gutiérrez, 2002). However, landforms controlled by lithology, either because of differential resistance to external processes (litho-structural control) or because their mineralogic composition generates its own morphologies (karst relief), were mapped.
An outline of the used symbols and colours employed are shown in . The carbonate materials are represented with red lines and hatching (RBG: 229, 94, 46), and the siliceous rocks are shown as light blue (RBG: 102, 119, 205). The erosion surfaces are represented by diagonal and horizontal hatching in grey tones (RBG: 226, 26, 26; 104, 104, 104; and 156, 156, 156). The karst landforms are drawn in red tones (RBG: 255, 190, 232 and/or 255, 199, 191) and by blue tones (0, 92, 230) where water is present (springs, underground flow).
Fourteen symbols are used to draw fluvial and torrential landforms. Blue and green tones (RBG: 0, 92, 230 and 56, 168, 0) are used to highlight erosional landforms and the presence of water, and green and yellowish/earth tones are used to denote depositional landforms (RBG: 38, 115, 0 and 255, 255, 1). There are 10 symbols associated with glacial dynamics which are shown in purple tones (RBG: 158, 187, 215 and 255, 190, 232). The glaciokarst landforms are in reddish tones, periglacial and nival landforms are shown in dark blue (RBG: 59, 0, 99 and 158, 187, 215). Gravitational landforms are shown in green and black tones (RBG: 156, 168, 77 and 196, 204, 161), the weathering forms in black, and the anthropic landforms in brown (RBG: 168, 112, 0) and gray tones.
The preparation of the geomorphological map involved traditional geomorphological design via the creation of a carefully designed geomorphological style set combined with the versatility of a GIS for georeferencing and the spatial analysis of landforms. The administrator of the program styles permits the combination of three basic vector elements in a single symbol ((A)) and drawing it at one time when mapping. As a result, and depending on the size, space, and degree of continuity of each feature, there are symbols that are only points, lines, or areas and that correspond to a database of the same character. Conversely, other landforms integrate two or three geometric elements into a single geomorphological design; that is, its representation simultaneously combines points, lines, and/or polygons, whereas its database is that of a line or polygon. For example, when a quarry is mapped, the database is polygonal, but its symbol design combines three geometries (area for showing the dimensions, line to indicate the edge of the cut and symbol to mark the escarp direction). Other features such as karren or areas with solifluction are represented using a linear database, and their design combines lines and/or points.
4. Results
The geomorphological map includes 78 symbols divided into 9 groups: litho-structural landforms, polygenic erosional surfaces, karst landforms, torrential and fluvial landforms, glacial landforms, periglacial and nival landforms, gravitational, weathering landforms, and, finally, landforms of anthropic origin. The most relevant and characteristic features in this area of the Cantabrian Mountains are those associated with fluvial dynamics, particularly the progressive incision of valleys, the dissolution of carbonate rocks, and the Quaternary glaciations (Main Map).
4.1. Litho-structural landforms
The sharp contrast between carbonate and siliceous rocks of moderate bed thicknesses, except for in certain cases (rocks of the Lena Group), favoured the formation of resistant rock outcrops alternating with valleys incised into softer rocks. Therefore, on the geomorphological map, ridges, escarpments, and rocky outcrops and ledges that reflect the stratigraphy have been represented. Due to their influence on geomorphological processes (e.g. karstic landforms), the nature of the rocks (carbonate or siliceous rocks) has been taken into account everywhere, given their differential behaviour in response to external processes.
4.2. Polygenic landforms: the erosion surfaces
Three levels of surfaces were identified, related with their degree of connection with the present-day river network. High plateaus and hills lacking connections with present-day rivers lie at elevations above 1600–1700 m. Surfaces sited between 1300 and 1600 m lie near the headwaters of numerous rivers and form the hills between streams, although a few of these surfaces are not connected with the present-day stream network. Lastly, the erosional surfaces in low-lying areas (below 1,300 m) are connected to the present-day stream network and yield evidence of recent fluvial incision.
Key elements of the terrain are the erosional surfaces in the highest elevations and along certain slope flanks. These surfaces are indicative of the morphogenetic evolution of the terrain and are residual evidence of ancient terrains (CitationMínguez-Menéndez, 2015). They reflect the progressive coupling of the river network and mountains originating from the Alpine tectonics and the erosion of the massif as it formed (CitationGonzález-Gutiérrez, 2002; CitationGonzález-Gutiérrez et al., 2010).
4.3. Karst landforms
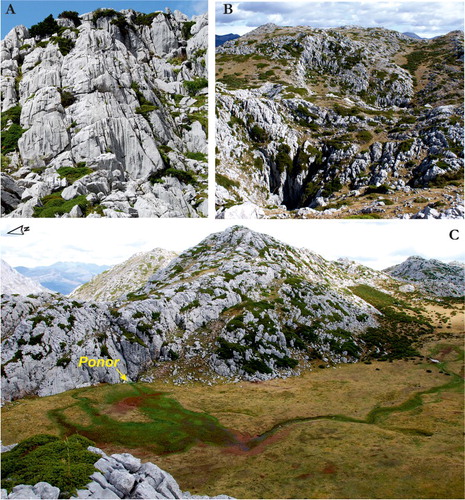
Karst topography is significant in the region due to the abundance and thickness of the limestones, particularly those of Carboniferous (Barcaliente and Valdeteja formations) and Devonian age, and is associated with thrusts and faults. The most karstified limestones with the best-developed karst landforms (e.g. four of the main five cavities in the study area) are those of the Barcaliente Formation possibly due to intense jointing and the decimetre capacity of the strata. The Valdeteja Formation and the Devonian limestones display karst topography, but to a lesser extent. The best examples are located in the upper elevations of the Sancenas massif (), where there are numerous dolines, solution channels, ouvalas, ponor, shafts, karst grooves, hums, poljes, surgences, and dry valleys (CitationAnnys et al., 2014). An interesting overlap between karst and glacial landforms exists in this area.
Figure 4. Carboniferous and devonian limestone outcrops in the Sancenas massif showing prominent exokarstic topography. In the highest elevations, as on the northern slope, there are solution channels (A); dolines (B); shafts, uvalas, and poljes (C).
4.4. Fluvial and torrential landforms
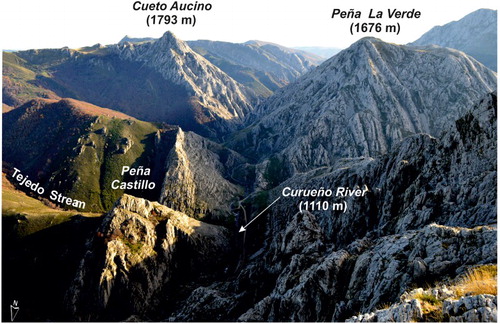
Progressive incision by rivers created gorges in the most cohesive rocks (quartzites and limestones). This incision appears to follow the bedding locally or highly fractured zones perpendicular to the direction of run-off. Examples include the Valdeteja Gorge (), which has been carved by the Curueño River and Valdeteja Brook south of Tolibia de Abajo.
Figure 5. Valdeteja Gorge from the southern slope of Bodón Massif, south of Tolibia de Abajo village. The Curueño River has created a deep north–south-trending gorge in the Carboniferous limestones parallel to bedding.
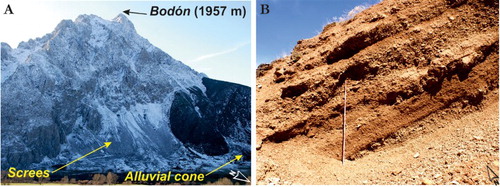
Torrential and fluvial sediments are not abundant and are concentrated where valleys widen, thereby allowing for the deposition of alluvium along the banks of the rivers. Examples include the Lugueros Plain and the by slate valley of Valverde–Valdeteja. The locations of alluvial cones (CitationGómez-Villar et al., 2002) are similarly distributed and are located where the valleys broaden, particularly where the Carboniferous shales crop out. Their locations are all near rivers, on the floodplain itself or slightly above the bases of the slopes ((A)).
Figure 6. (A) Northern side of Bodón Massif next to Lugueros village with numerous scree and avalanche deposits and snow corridors. (B) Stratified debris flow deposits in the Valdeteja Gorge, east to Valdeteja village (bar length: 2 m).
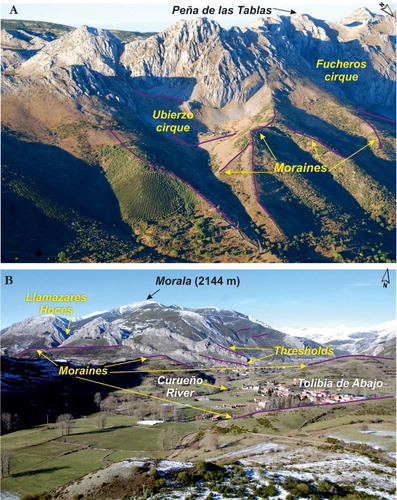
4.5. Glacial landforms
Pleistocene cold phases left their mark on this part of the Cantabrian Mountains in the form of abundant glacial features. The most distinctive landforms are a set of cirques, moraines, and erratic boulders of the Sancenas massif ((A)), the moraine complex of the Lugueros basin, till in the Yargas Valley, and the cirques of the Morala massif (CitationGómez-Villar et al., 2015). Without a doubt, in Lugueros ((B)) there is one of the best-preserved moraine systems in the Cantabrian Mountains. The deposits and forms left by the Curueño glacier, whose length exceeded 17 km from the port of Vegarada to Valdeteja Gorge (centre of the map), are presented on the geomorphological map (CitationGonzález-Gutiérrez, 2002; CitationRedondo-Vega et al., 2014; CitationSantos-González, Redondo-Vega, et al., 2013). Together with the moraines, erratics, glaciolacustrine deposits (CitationRedondo-Vega, González-Gutiérrez, Santos-González, & Gómez-Villar, 2006), glacial thresholds, and juxtaglacial palaeochannels and shoulders have been mapped.
Figure 7. Glacial landforms: (A) cirques and moraines on the Sancenas massif and (B) a system of terminal and lateral moraines near the villages of Lugueros and Tolibia de Abajo.
4.6. Periglacial and nival landforms
The most-distinct periglacial landforms are located in glaciated areas and where nival dynamics are currently present. Compared to other areas of the Cantabrian Mountains, rock glaciers are rare here due to the lesser exposure of quarzitic rocks (CitationGómez-Villar et al., 2011; CitationRedondo-Vega et al., 2010). Steep slopes and abundant rocky outcrops have produced scree, debris cones, cemented talus slope, and avalanche tracks. In areas of bulging siliceous uplift, such as in the surroundings of the peaks Morala or Cudero, there are small terracettes.
4.7. Gravitational landforms
The presence of gravitational geomorphic processes supported by surface run-off and occasional nival processes depends on many variables such as the gradients and orientations of the slopes, the litho-structural character of the materials, climatic conditions, and the age-old pressure of human activity.
Creeping soil mantles and areas with solifluction lobes have been mapped on slaty bedrock where cultivation has been abandoned (the Valverdín, Valdeteja, Villarías, and Rodillazo valleys). Debris flow deposits such as those of El Fontanal, west of the village of Lugueros, and those deposited by streams descending from Morala Peak are also present. In the northern part of the map, the massifs of Morala and Mullerinas are dominated by different lithologies with interbedded shale. This bedrock, the higher elevations (>1500 m.a.sl.), and slope gradients above 20° are favourable to the development of torrential headwaters with badlands, rills, and gullies. In contrast, the southern part of the map is characterized by relative stability, especially where siliceous rocks appear (Fito and Tejedo valleys).
4.8. Weathering landforms
At the Sancenas massif, the Ordovician quartzites (Barrios Formation) attain a substantial thickness and are extensively mantled by sandy soil, interpreted as an alterite. This soil is less extensive than other parts of the Cantabrian Mountains (CitationRodríguez-Pérez, 1995), but it confers a certain singularity to the massif because in this sector small brooks can be found that transport these alterites to the karst landforms located to the north. (CitationGonzález-Gutiérrez, 2002)
4.9. Anthropic landforms
These landforms are related to quarries, waste dumps, villages, and roads. Two quarries for silica extraction have been drawn in the SE of the map, in a small stream that drains to the Porma basin. The map shows 13 villages connected by local roads. They are entities with very few inhabitants located near the bottoms of the valleys and in the best sunny areas during the winter months.
5. Conclusions
The geomorphological map of the Lugueros shows a variety of landforms, demonstrating the high geomorphologic diversity of the region. The map legend contains 78 symbols grouped into 8 categories: litho-structural, polygenetic, karst, fluvial and torrential, glacial, periglacial and nival, gravitational and weathering, and anthropic landforms.
Three landforms give this part of the Cantabrian Mountains their special character: the Valdeteja and many other small gorges created by river incision, exokarst related to the significant calcareous rocks in the region, and the glacial deposits identified in Lugueros, the Yargas valley (North of the map), and the Sancenas and Morala massifs (West and South of study area). The mapped landforms reflect the overlapping of many processes that have shaped the upper reaches of the Curueño River during, at least, the Quaternary. Some landforms are characteristic of this area either because of its tectonic evolution (structural landforms), either by the nature of the materials (karst forms) or even by the influence of the climatic conditions (glacial and periglacial landforms). Other landforms are related to processes triggered far from here, but their consequences have reached this area and left a geomorphological imprint. Such is the case of the fluvial fitting during Cenozoic and the gorges associated, with the evolution of the Duero River.
Overlapping processes have also led to overlapping landforms such that it was difficult to decide which landform to map in places, thus making it difficult to design and prepare the geomorphological map. This situation was applied to the Sancenas massif, where karst landforms overlap with glacial forms providing glaciokarst forms. These forms are also combined with sandy residual soils on the peaks of the massif.
Finally, in designing the map, an attempt was made to combine traditional geomorphological map design with the functionality provided by a GIS. Geomorphological maps drawn by hand or with graphic software were characterized by the careful delineation of forms using intuitive and simple symbols for cartographic representation. The style manager of ArcMap allows the design of a variety of symbols and to create geometric shapes that combine points, lines, and polygons on a single drawing. In addition, each landform, depending on its size and the scale of representation, is part of a database that characterizes the form for future analysis and processing.
Software
The geomorphological map was prepared using Esri ArcGIS 10.3.
Geomorphological Map of the Curueño River Headwaters, Cantabrian Mountains (NW Spain).pdf
Download PDF (17.5 MB)Acknowledgements
This work was performed as part of the research project titled ‘Geomorphological cartography at a scale of 1/50,000 of the pages of the National Topographic Map of La Pola de Gordón (103) and Boñar (104)’, which was funded by the ‘Diputación of León’ between 2008 and 2011.
The authors would like to thank the reviewers, A. Frankl, D. Ballesteros, and M. Murad-al-shaikh, for their comments that help improve the manuscript.
Disclosure statement
No potential conflict of interest was reported by the authors.
ORCID
R. B. González-Gutiérrez http://orcid.org/0000-0002-6863-8495
J. Santos-González http://orcid.org/0000-0002-5567-653X
A. Gómez-Villar http://orcid.org/0000-0002-0061-8017
J. M. Redondo-Vega http://orcid.org/0000-0002-4631-2216
Additional information
Funding
Related Research Data
References
- AEMET-IM. (2011). Atlas Climático Ibérico. Retrieved from http://www.aemet.es/es/conocermas/recursos_en_linea/publicaciones_y_estudios/publicaciones/detalles/Atlas-climatologico
- Alonso, J. L., Marcos, A., & Suárez, A. (2009). Paleogeographic inversion resulting from large out of sequence breaching thrusts: The León fault (Cantabrian Zone, NW Iberia). A new picture of the external variscan thrust belt in the ibero-armorian arc. Geologica Acta, 4, 451–473. doi:10.1344/105.000001449
- Alonso, J., Pulgar, J., García-Ramos, J., & Barba, P. (1996). Tertiary basins and Alpine tectonics in the Cantabrian Mountains (NW Spain). In P. F. Friend & C. J. Dabrio (Eds.), Tertiary basins of Spain (pp. 214–227). New York: Cambridge University Press.
- Alonso, V. (2014). Mapa geomorfológico del sector sur del Macizo de las Ubiñas (Cordillera Cantábrica, NO de España). Trabajos de Geología, 34, 125–132. doi: 10.17811/tdg.34.2014.125-132
- Annys, K., Frankl, A., Spalević, V., Čurović, M., Borota, D., & Nyssen, J. (2014). Geomorphology of the Durmitor Mountains and surrounding plateau Jezerska Površ (Montenegro). Journal of Maps, 10(4), 600–611. doi:10.1080/17445647.2014.909338
- Aranburu, A., Arriolabengoa, M., Iriarte, E., Giralt, S., Yusta, I., Martínez-Pillado, V., … Jiménez-Sánchez, M. (2015). Karst landscape evolution in the litoral área of the Bay of Biscay (North Iberian Peninsula). Quaternary International, 364, 217–230. doi:10.1016/j.quaint.2014.09.025
- Arnáez-Vadillo, J., & García-Ruiz, J. M. (1990). Mapa Geomorfológico de Ezcaray (M.T.N. 240). Logroño: Geoforma Ediciones e Instituto de Estudios Riojanos.
- Ballesteros, D., Jiménez-Sánchez, M., Giralt, S., García-Sansegundo, J., & Meléndez-Asensio, M. (2015a). A multi-method approach for speleogenetic research on alpine karst caves. Torca La Texa shaft, Picos de Europa (Spain). Geomorphology, 247, 35–54. doi:10.1016/j.geomorph.2015.02.026
- Beckinsale, R. P., & Chorley, R. J. (1991). The history of the study of landforms. Vol. 3, Historical & regional geomorphology. London: Routledge.
- Centre National de la Recherche Scientifique. (1976). Leyenda para el mapa geomorfológico de Francia (1:50.000). (D. Serrat, Trans.). Barcelona: Inst. Jaime Almera.
- Chueca-Cía, J., & Julián-Andrés, A. (2008). Geomorphological map of the Alta Ribagorza (Central Pyrenees, Spain). Journal of Maps, 4, 235–247. doi:10.4113/jom.2008.1006
- Demek, J., & Emblenton, C. (Eds.). (1978). Guide to medium-scale. Geomorphological mapping. Praga: Czechoslovak Academy of Sciences/International Geographical Union, Commission of Geomorphological Survey and Mapping.
- Demek, J., Kirchner, K., Mackovčin, P., & Slavik, P. (2011). Geomorphodiversity derived by a GIS-based geomorphological map: Case study the Czech Republic. Zeitschrift für Geomorphologie, 55(4), 415–435. doi:10.1127/0372-8854/2011/0058
- Domínguez-Cuesta, M. J., Jiménez-Sánchez, M., & Berrezuela, E. (2007). Landslides in the central coalfield (Cantabrian Mountains, NW Spain): Geomorphological features, conditioning factors and methodological implications in susceptibility assessment. Geomorphology, 89, 358–369. doi:10.1016/j.geomorph.2007.01.004
- Dramis, F., & Bisci, C. (1998). Cartografia geomorfologica. Manuale di introduzione al rilevamento ed alla rappresentazione degli aspett ifisici del territorio. Bologna: Pitagora Editrice.
- Dramis, F., Guida, D., & Cestari, A. (2011). Nature and aims of geomorphological mapping. In M. J. Smith, P. Paron, & J. S. Graffiths (Eds.), Developments in earth surface processes, V. 15.Geomorphological mapping: Methods and applications (pp. 39–73). Elservier. doi:10.1016/B978-0-444-53446-0.00003-3
- Frochoso, M., González-Pellejero, R., & Allende, F. (2013). Pleistocene glacial morphology and timing of last glacial cycle in Cantabrian Mountains (Northern Spain): New chronological data from the Asón area. Central European Journal of Geosciences, 5(1), 12–27. doi:10.2478/s13533-012-0117-8
- Frochoso Sánchez, M. (2016). Los valles cantábricos centrales. Modelo de evolución según diferentes escalas temporales. Ería, 99–100, 71–91. doi:10.17811/er.99.2016.71-91
- Frochoso-Sánchez, M., & Castañón-Álvarez, J. C. (1998). El relieve glaciar de la Cordillera Cantábrica. In A. Gómez Ortiz & A. Pérez Alberti (Eds.), Las huellas glaciares de las Montañas Españolas (pp. 65–137). Santiago de Compostela: Servicio de Publicaciones de la Universidad de Santiago de Compostela.
- García de Celis, A. (1997). El relieve de la montaña occidental de León. Serie Geografía, N° 14. Valladolid: Universidad de Valladolid.
- García-Fernández, J. (2006). Geomorfología estructural. Barcelona: Ariel Geografía.
- García-Ruiz, J. M., Gómez-Villar, A., Arnáez-Vadillo, J., & Ortigosa-Izquierdo, L. (2007). Villoslada de Cameros, La Rioja (M.T.N. 279): Mapa geomorfológico. Logroño: Instituto de Estudios Riojanos.
- García-Ruiz, J. M., Peña-Monné, J. L., Martí-Bono, C., Gómez-Villar, A., Constante-Ríos, A., & Espinalt-Brillas, M. (2011). El relieve del Alto Aragón Occidental. Cartografía y síntesis geomorfológica (Zuriza, M.T.N. 118; Ansó, M.T.N. 144; Sallent, M.T.N. 145; Jaca, M.T.N. 176 y Sabiñánigo, M.T.N. 177). Serie investigación. Zaragoza: Consejo de Protección de la Naturaleza de Aragón.
- González-Gutiérrez, R. B. (2002). El relieve de los valles del Torío y Curueño (Montaña Cantábrica Leonesa). León: Secretariado de Publicaciones y Medios Audiovisuales de la Universidad de León.
- González-Gutiérrez, R. B., Redondo-Vega, J. M., Gómez-Villar, A., Santos-González, J., Prieto-Sarro, I., Fernández-Prieto, R., & Luna-Rabanal, C. (2010). Mapa geomorfológico de Boñar. León (M.T.N. 104), Escala 1/50.000. Unpublished manuscript.
- González-Trueba, J. J. (2007). Geomorfología del Macizo Central del Parque Nacional Picos de Europa. Madrid: Organismo Autónomo Parques Nacionales.
- Gómez-Ortiz, A. (2002). Mapa geomorfológico de Sierra Nevada. Morfología glaciar y periglaciar. Barcelona: Junta de Andalucía, Consejería de Medio Ambiente & Universidad de Barcelona.
- Gómez-Villar, A., González-Gutiérrez, R. B., Redondo-Vega, J. M., & Santos-González, J. (2011). Distribución de los glaciares rocosos relictos en la Cordillera Cantábrica. Cuadernos de Investigación Geográfica, 37(2), 49–80. doi:10.18172/cig.vol37iss2 doi: 10.18172/cig.1256
- Gómez-Villar, A., Redondo-Vega, J. M., González-Gutiérrez, R. B., & Carrera-Gómez, P. (2002). Aproximación al estudio de conos aluviales en la Montaña Central Leonesa. In A. Pérez-González, J. Vegas-Salamanca & Mª J. Machado (Coords.) (Eds.), Aportaciones a la Geomorfología de España en el inicio del tercer milenio. Actas VI Reunión Nacional de Geomorfología (pp. 53–58). Instituto Geológico y Minero de España. Madrid: Universidad de Madrid. Retrieved from https://dialnet.unirioja.es/servlet/articulo?codigo=1182751
- Gómez-Villar, A., Santos-González, J., González-Gutiérrez, R. B., & Redondo-Vega, J. M. (2015). Glacial cirques in the Southern side of the Cantabrian Mountains of Southwestern Europe. Geographiska Annaler: Series A, Physical Geography, 97(4), 633–651. doi:10.1111/geoa.12104
- Gustavsson, M. (2006). Development of a detailed geomorphological mapping system and GIS geodatabase in Sweden. Acta Universitatis Upsaliensis. Digital Comprehensive Summaries of Uppsala Dissertations from the Faculty of Science and Technology 236. Retrieved from http://urn.kb.se/resolve?urn=urn:nbn:se:uu:diva-7222
- Gustavsson, M., Kolstrup, E., & Seijmonsbergen, A. C. (2006). A new symbol-and-GIS based detailed geomorphological mapping system: Renewal of scientific discipline for understanding landscape development. Geomorphology, 77(1–2), 90–111. doi:10.1016/j.geomorph.2006.01.026
- Herrero-Matías, M. (1988). Método de trabajo para la formación y el diseño de mapas geomorfológicos. Anales de Geografía de la Universidad Complutense, 8, 25–40. Retrieved from https://revistas.ucm.es/index.php/AGUC/article/view/AGUC8888110025A/31910
- Jiménez-Sánchez, M., Rodríguez-Rodríguez, L., García-Ruiz, J. M., Domínguez-Cuesta, M. J., Farias, P., Valero-Garcés, B., … Valcárcel, M. (2013). A review of glacial geomorphology and chronology in northern Spain: Timing and regional variability during the last glacial cycle. Geomorphology, 196, 50–64. doi:10.1016/j.geomorph.2012.06.009
- Joly, F. (1997). Glossaire de géomorphologie. Base de données sémiologiques pour la cartographie. Paris: Masson & Arman Colin.
- Julivert, M., Fontboté, J. M., Ribeiro, A., & Nabais-Conde, L. E. (1972). Mapa tectónico de la Península Ibérica y baleares a escala 1:1.000.000. Madrid: Instituto Geológico y Minero de España.
- Kertesz, A., & Markus, B. (1992). GIS applications in geomorphology and in geomorphology mapping. Geologishe Jahrbuch, A 122, 381–387.
- Knight, J., Mitchell, W. A., & Rose, J. (2011). Geomorphological field mapping. In M. J. Smith, P. Paron, & J. S. Graffiths (Eds.), Developments in earth surface processes, V. 15.Geomorphologuical mapping: Methods and applications (pp. 151–187). Elsevier. doi:10.1016/B978-0-444-53446-0.00006-9
- Lotze, F. (1945). Zur Gliederung der Varisziden der Iberischen Meseta. Geotektonische Forschungen, 6, 78–92.
- Martín-Serrano, A., Salazar, A., Nozal, F., & Suárez, A. (2004). Mapa Geomorfológico de España a escala 1:50.000. Guía para su elaboración. Madrid: Instituto Geológico y Minero de España.
- Menéndez Duarte, R., & Marquínez, J. (2002). The influence of environmental and lithologic factors on rockfall at a regional scale: An evaluation using GIS. Geomorphology, 43(1–2), 117–136. doi:10.1016/S0169-555X(01)00126-X
- Merino-Tomé, O., Suárez Rodríguez, A., & Alonso Alonso, J. L. (2014). Mapa geológico digital continuo E. 1:50.000, Zona Cantábrica (Zona-1000). In GEODE. Mapa Geológico Digital Continuo de España [online]. Retrieved from http://info.igme.es/cartografiadigital/geologica/geodezona.aspx?Id=Z1000
- Minár, J., Mentlík, P., Jedlička, K., & Barka, I. (2005). Geomorphological information system: Idea and option for practical implementation. Geografický Časopis, 57 (3), 247–266. Retrieved from https://www.sav.sk/journals/uploads/03121121GC-05-3_Minar_et_al.pdf
- Mínguez-Menéndez, A. (2015). Análisis y evolución del relieve de los Montes de León y del sector occidental de la Cordillera Cantábrica mediante la aplicación de modelos digitales de elevación (Ph.D. Thesis). University of León (Department of Geography and Geology), León.
- Nieuwendam, A., Ruiz-Fernández, J., Oliva, M., Lopes, V., Cruces, A., & Conceição Freitas, M. (2016). Postglacial landscape changes and cryogenic processes in the Picos de Europa (Northern Spain) reconstructed from geomorphological mapping and microstructures on quartz grains. Permafrost and Periglacial Processes, 27(1), 96–108. doi:10.1002/ppp.1853
- Panizza, M. (2005). Manuale du geomorfología applicata. Milano: Franco Angeli.
- Paron, P., & Claessens, L. (2011). Makers and users of geomorphological maps. In M. J. Smith, P. Paron, & J. S. Graffiths (Eds.), Developments in earth surface processes, V. 15.Geomorphologuical mapping: Methods and applications (pp. 39–73). Elsevier. doi:10.1016/B978-0-444-53446-0.00004-5
- Pavlopoulos, K., Evelpidou, N., & Vassilopoulos, A. (2009). Mapping geomorphological environments. Berlin: Springer. doi:10.1007/978-3-642-01950-0_1
- Pellitero, R. (2014). Geomorphology and geomorphological landscapes of Fuentes Carrionas. Journal of Maps, 10(2), 313–323. doi:10.1080/17445647.2013.867822
- Pellitero, R., Manosso, F. C., & Serrano, E. (2014). Mid and large scale geodiversity calculation in Fuentes Carrionas (NW Spain) and Serra do Cadeado (Paraná, Brazil): Methodology and application for land management. Geographiska Annaler: Series A, Physical Geography, 97, 219–235. doi:10.1111/geoa.12057
- Peña-Monné, J. L. (1997). Cartografía Geomorfológica. Básica y aplicada. Logroño: Geoforma ediciones.
- Pérez-Estaún, A., Bastida, F., Alonso, J. L., Marquínez, J., Aller, J., Álvarez-Marrón, J., … Pulgar, J. A. (1988). A thin-skinned tectonics model for an arcuate fold and thrust belt: The Cantabrian Zone (Variscan ibero-Armorican Arc). Tectonics, 7, 517–537. doi:10.1029/TC007i003p00517
- Pisabarro, A., Pellitero, R., Serrano, E., Gómez-Lende, M., & González-Trueba, J. J. (2017). Ground temperatures, landforms and processes in an Atlantic mountain. Cantabrian Mountains (Northern Spain). Catena, 149(2), 623–636. doi:10.1016/j.catena.2016.07.051
- Redondo-Vega, J. M., Alonso-Herrero, E., García de Celis, A., Gómez-Villar, A., González-Gutiérrez, R. B., & Santos-González, J. (2014). Huellas glaciares a baja altitud en los valles cantábricos meridionales. In J. Arnáez-Vadillo, P. González-Sampériz, T. Lasanta, & B. L. Valero-Garcés (Eds.), Geoecología, Cambio ambiental y Paisaje. Homenaje al profesor José María García Ruiz (pp. 103–116). Arnedo (La Rioja): Instituto Pirenaico de Ecología (CSIC)/Universidad de La Rioja. Retrieved from https://dialnet.unirioja.es/servlet/articulo?codigo=4853974
- Redondo-Vega, J. M., Gómez-Villar, A., González-Gutiérrez, R. B., & Carrera-Gómez, P. (2002). El modelado de origen glaciar en las montañas leonesas. León: Secretariado de Publicaciones y Medios Audiovisuales de la Universidad de León.
- Redondo-Vega, J. M., Gómez-Villar, A., González-Gutiérrez, R. B., & Santos-González, J. (2010). Los glaciares rocosos de la Cordillera Cantábrica. León: Universidad de León.
- Redondo-Vega, J. M., Gómez-Villar, A., Santos-González, J., González-Gutiérrez, R. B., & Álvarez Martínez, J. (2017). Changes in land use due to mining in the north-western mountains of Spain during the previous 50 years. Catena, 149, 844–856. doi:10.1016/j.catena.2016.03.017
- Redondo-Vega, J. M., González-Gutiérrez, R. B., Santos-González, J., & Gómez-Villar, A. (2006). Sedimentación glaciolacustre en la Montaña Cantábrica Leonesa. In A. Pérez-Alberti & J. López-Bedoya (Eds.), Geomorfología y territorio. Actas de la IX Reunión Nacional de Geomorfología (pp. 83–100). Santiago de Compostela: Universidade de Santiago de Compostela. Retrieved from https://dialnet.unirioja.es/servlet/articulo?codigo=2193296
- Reynard, E., Holzmann, C., Lambiel, C., & Phillips, M. (2005). Légende géomorphologique de l'IGUL et Guide pratique pour le levé de cartes géomorphologiques. Lausanne: Institut de Géographie.
- Rodríguez-Pérez, C. (1995). Estudio geomorfológico del Puerto de San Isidro. Ería, 36, 63–87.
- Rodríguez-Pérez, C. (2009). Geomorfología de la Montaña Astur-Leonesa entre los puertos de Ventana y de Somiedo (Ph.D. Thesis). University of Oviedo (Department of Geography), Oviedo. Retrieved from http://hdl.handle.net/10651/15005
- Rodríguez-Rodríguez, L., Jiménez-Sánchez, M., Domínguez-Cuesta, M. J., & Aranburu, A. (2015). Research history on glacial geomorphology and geochronology of the Cantabrian Mountains, North Iberia (43-42°N/7-2ªW). Quaternary International, 364, 6–21. doi:10.1016/j.quaint.2014.06.007
- Rodríguez-Rodríguez, L., Jiménez-Sánchez, M., Domínguez-Cuesta, M. J., Rinterknecht, V., Pallàs, R., & Bourlès, D. (2016). Chronology of glaciations in the Cantabrian Mountains (NW Iberia) during the last glacial cycle based on in situ-produced 10Be. Quaternary Science Reviews, 138, 31–47. doi:10.1016/j.quascirev.2016.02.027
- Ruiz-Fernández, J. (2011). Geomorphological map of an Atlantic mid-high mountain area: The Juan Robre and Jana Ridge (Cantabrian Range, Northwest Spain). Journal of Maps, 7(1), 260–272. doi:10.4113/jom.2011.1173
- Ruiz-Fernández, J., Poblete-Piedrabuena, M. A., Serrano-Muela, M. P., Martí-Bono, C., & García-Ruiz, J. M. (2009). Morphometry of glacial cirques in the Cantabrian range (Northwest Spain). Zeitchrift für Geomorphologie, 53, 47–68. doi:10.1127/0372-8854/2009/0053-0047
- Santos-González, J. (2011). Glaciarismo y periglaciarismo en el Alto Sil, provincia de León (Cordillera Cantábrica) (Ph.D. Thesis). University of León (Department of Geography and Geology), León.
- Santos-González, J., Redondo-Vega, J. M., González-Gutiérrez, R. B., & Gómez-Villar, A. (2013). Applying the AABR method to reconstruct equilibrium-line altitudes from the last glacial maximum in the Cantabrian Mountains (SW Europe). Palaeogeography, Palaeoclimatology, Palaeoecology, 387(1), 185–199. doi:10.1016/j.palaeo.2013.07.025
- Santos-González, J., Santos, J. A., González-Gutiérrez, R. B., Redondo-Vega, J. M., & Gómez-Villar, A. (2013). Till fabric and grain-size analysis of glacial sequences in the Upper Sil River Basin, Cantabrian Mountains, NW Spain. Physical Geography, 34(6), 471–490. doi:10.1080/02723646.2013.855989
- Serrano, E., & González-Trueba, J. J. (2005). Assessment of geomorphosites in natural protected areas: The Picos de Europa National Park (Spain). Géomorphologie Relief. Processus. Environment, 11(3), 197–208. doi:10.4000/geomorphologie.364
- Serrano, E., González-Trueba, J. J., Pellitero, R., González-García, M., & Gómez-Lende, M. (2013). Quaternary glacial evolution in the Central Cantabrian Mountains (Northern Spain). Geomorphology, 196, 65–82. doi:10.1016/j.geomorph.2012.05.001
- Servizio Geologico Nazionale. (1994). Carta Geomorfologica d’Italia – 1:50.000. Guida al rilevamento. Quaderni, serie III, volumen 4. Roma: Instituto Poligráfico e Zeccadello Stato. Retrieved from http://www.aigeo.it/wp-content/uploads/quad4-1.pdf.
- Tricart, J. (1979). Mapas geomorfológicos, ¿por qué? Acta Geológica Hispánica, 14, 416–420. Retrieved from http://revistes.ub.edu/index.php/ActaGeologica/article/view/4894/6442
- Truyols, J., Álvarez, F., Arbizu, M. A., García-Alcalde, J. L., García-López, S., Martínez-Chacón, M. L., … Lobato, L. (1984). Memoria del Mapa Geológico de España, E. 1:50.000, núm. 104 (Boñar). Segunda Serie (MAGNA). Madrid: Instituto Tecnológico Geominero de España.
- Verstappen, H. T. (2011). Old and new trends in geomorphological and landform mapping. In M. J. Smith, P. Paron, & J. S. Graffiths (Eds.), Developments in earth surface processes, V. 15.Geomorphologuical mapping: Methods and applications (pp. 39–73). Elsevier. doi:10.1016/B978-0-444-53446-0.00002-1
- Verstappen, H. T., & Van Zuidam, R. (1991). The ITC system of geomorphologic survey. A basis for the evaluation on natural resources and hazards (English, French and Spanish). N° 10. Enschede: ITC Publication.