
ABSTRACT
New maps of the summit of Mount Etna volcano (1:5000–1:4000), derived from helicopter photogrammetry, thermal images and terrestrial laser scanner survey, are here presented. These maps indicate the main morpho-structural changes occurring during the powerful explosive and effusive eruptions involving the summit craters of Etna over the first two weeks of December 2015. The survey enabled identifying the proximal erupted volume (7.2 ± 0.14 × 10⁶ m3) and the size and location of the vent causing the powerful explosive activity inside the Central Crater. Our survey also outlines the growth of a recent (2011–2015) summit cone on top of a former pit crater, named New SE-Crater. This new cone is by now comparable in size to the former SE-Crater. The shape and size of two small cinder cones that formed on the upper eastern flank of the summit zone in May–July 2014 are also shown. This approach can be used in fast and frequent monitoring of very active volcanoes.
1. Introduction
Mt. Etna is among the world’s most active volcanoes (), with almost continuous eruptive activity from the four summit craters (CitationDel Negro et al., 2013; CitationFalsaperla & Neri, 2015). Its uppermost region is therefore continuously changing (CitationBehncke et al., 2016; CitationBisson, Spinetti, Neri, & Bonforte, 2016; CitationGiammanco et al., 2016; CitationMcGetchin, Settle, & Chouet, 1974; CitationMurray, 1976, Citation1980a; CitationNeri et al., 2008; CitationSlatcher, James, Calvari, Ganci, & Browning, 2015), with new vents appearing suddenly and becoming wider and deeper (CitationCalvari, Muller, & Scribano, 1995; CitationMurray, 1980b), and cinder cones building up rapidly owing to powerful explosive activity (CitationBehncke, Neri, Pecora, & Zanon, 2006, Citation2014; CitationCalvari & Pinkerton, 2004; CitationMcGetchin et al., 1974). This means that the available maps of the summit zone soon become dated in accurately representing its morphology. Having precise and continuously updated topographic maps of the summit region is vital as they enable quantifying the eruptive products (e.g. CitationBehncke et al., 2016; CitationCalvari et al., 2011; CitationDe Beni et al., 2015; CitationGanci, James, Calvari, & Del Negro, 2013). From these data, we can obtain the output rate and evaluate the state of the volcano and its potential of producing future eruptions (e.g. CitationBonaccorso & Calvari, 2013; CitationHarris, Steffke, Calvari, & Spampinato, 2011, Citation2012; CitationWadge & Guest, 1981). In addition, since the summit area of Etna is visited by thousands of tourists every year, the availability of updated topographic maps is essential for both monitoring and civil protection purposes (e.g. CitationBisson, Behncke, Fornaciai, & Neri, 2009; CitationBonaccorso, Calvari, & Boschi, 2015; CitationCappello, Bilotta, Neri, & Del Negro, 2013; CitationCrisci et al., 2010).
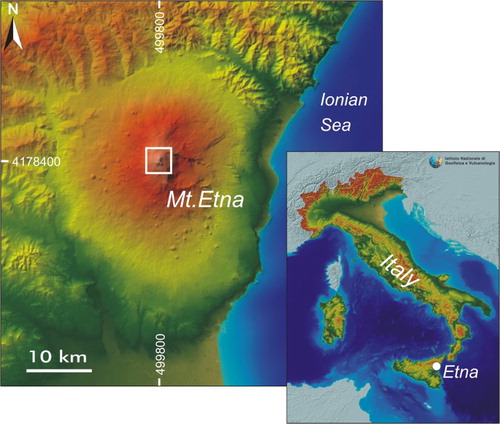
Figure 1. Geographical framework of Etna volcano. The white box indicates the investigated area. The image of the Italian territory is obtained from the TINITALY DEM re-sampled to 100 m resolution, available at: http://tinitaly.pi.ingv.it/download_image.html. The image is referenced in WGS 84 UTM zone 33 N. Beyond the borders of Italy, the DEM is represented by the SRTM dataset (Europe), available at: http://geodati.fmach.it/gfoss_geodata/SRTM-Italy/, and GEBCO dataset (sea), available at: http://www.gebco.net/data_and_products/gridded_bathymetry_data/.
Recently, the applications of Light Detection And Ranging (LiDAR) technology, both from the air (airborne transported) and on the ground (CitationBehncke et al., 2016; CitationFavalli et al., 2010; CitationFornaciai et al., 2010; CitationNeri et al., 2008), are increasingly used to detect frequent changes and are applicable to very active volcanoes like Mt. Etna. Moreover, the development of the structure from motion computer technique has also greatly facilitated the building of 3D digital elevation models (DEMs) of sectors of the volcano (e.g. CitationJames, Applegarth, & Pinkerton, 2012).
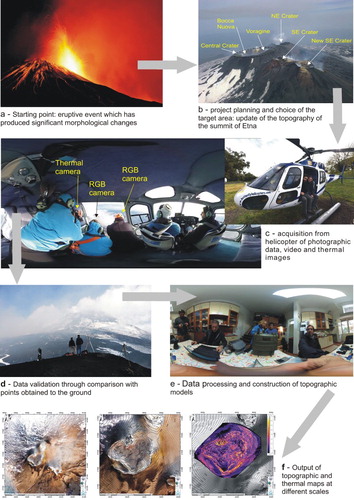
This paper presents new topographic maps of the Mt. Etna’s summit area. They are updated to 14 December 2015, i.e. immediately after significant eruptions, occurring between 3 and 11 December 2015 (CitationBonaccorso & Calvari, in press). These eruptions involved all the summit craters and caused major morphological changes. One of the chief aims was to obtain high-resolution data on a very active volcano rapidly, though without excessive risk. In order to perform our work, optimizing time, risk and costs, we chose to take numerous high-resolution photos, thermal images and footage from a helicopter (). We then processed this material with software MICMAC from IGN (Institut Géographique National) that can render an orthophotography of the target zone. The topographic data were then validated through LiDAR ground measurements acquired previously in zones very close to the summit craters but unaffected by morphological changes. The result is the compiling of some thermal and topographic maps of the summit area of Etna, at different scales (see Main Map).
Figure 2. Flow chart illustrating the methodology followed during the construction of the topographic maps of Mount Etna summit zone.
In addition to the topographic maps, the use of thermal imaging for mapping the surfaces of active volcanoes is becoming increasingly more common, because localized increases in temperature immediately display the most active volcanic features, such as vents, ground fractures and pits (CitationCalvari et al., 2005; CitationHarris, 2013; CitationSpampinato, Calvari, Oppenheimer, & Boschi, 2011). This is why, combining the new topographic map of Etna’s summit and the thermal map of the same area is extremely useful for interpreting the most recent eruptive episodes.
2. Previous maps of the summit zone
There are five craters on the summit of Mt. Etna: (1) the Voragine (VOR), or Chasm, earlier called Central Crater (CC), is the oldest, and has been observed at least since 1858 (CitationBehncke, Neri, & Sturiale, 2004; CitationLyell, 1858); (2) the NE-Crater (NEC) is a cinder cone that built up from 1911 (CitationMcGetchin et al., 1974); (3) the Bocca Nuova (BN) started as a pit crater next to VOR in 1968, and collapsed in 1970 to form a large depression, now joined to VOR (CitationCalvari et al., 1995; CitationChester, Duncan, Guest, & Kilburn, 1985; CitationGiammanco, Sims, & Neri, 2007; CitationSlatcher et al., 2015), and (4) the SE-Crater (SEC), which formed during the 1971 eruption (CitationBehncke et al., 2006; CitationCalvari, Coltelli, Muller, Pompilio, & Scribano, 1994; CitationGuest, 1973), and has been the most active summit crater over recent decades (CitationBehncke et al., 2006; CitationBonaccorso & Calvari, 2013; CitationCalvari et al., 2011). Finally, the New SE-Crater (NSEC) (the fifth and youngest summit crater) has formed at the eastern base of the SEC, starting from a little pit crater that opened in late 2007 (CitationAcocella et al., 2016; CitationBehncke et al., 2016; CitationDel Negro et al., 2013).
Frequent updates of Etna’s summit morphology changes have been carried out by CitationMurray (1976, Citation1980a, Citation1980b), but the most recent certified topography of the summit area, based on aerophotogrammetry acquired in November 1998, was released in 1999 by the Provincia Regionale di Catania. More recently, the use of LiDAR technology through surveys carried out in 2005, 2007 and 2010 has allowed comparing with previous aerophotogrammetic surveys and estimating the accumulated volume (CitationBehncke et al., 2016; CitationNeri et al., 2008).
3. Methods
The methodology used in this survey is innovative and can reduce time and costs for the monitoring of complex structures and morphologies of an active volcano. The system used for 3D reconstruction essentially comprises (i) helicopter photogrammetry, (ii) terrestrial laser scanner (Riegl VZ4000) survey and (iii) thermal images acquired by a forward looking infrared radiometer (FLIR) portable camera (SC660).
We mounted one thermal and two RGB cameras on the helicopter ((c)). At the same time, technicians on the ground surveyed the same area with the laser scanner ((d)). The laser scanner VZ-4000 is one of the few terrestrial scanners able to reconstruct objects up to 4 km distance with an accuracy of 1 cm. The GCP (ground control points) derived from laser scanner data are acquired in order to georeference the survey by helicopter and verify the accuracy of the photogrammetric reconstruction.
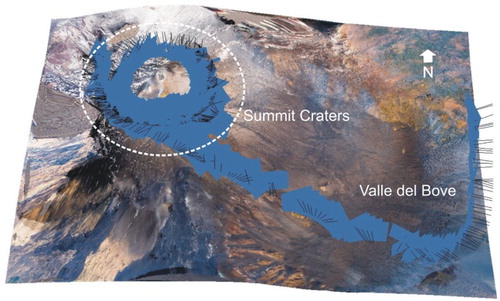
A time-of-flight scanner Riegl VZ-4000 with full-waveform online echo detection was used to collect data from five elevated scan positions around the craters and near the Valle del Bove ((d)). We planned five scan positions in different locations and at different elevations in order to obtain a complete viewshed of the investigated area, without any blind spot (). The global positioning of the reflectors (three per scan position) is measured using a GNSS system (Leica viva cs10 controller + GNSS leica GS25 receiver). We performed a static positioning technique with a measurement time of 20 min per position. After the post-processing elaboration performed with Leica GEO office software, we obtained the following ranges of accuracy:
Planimetric: 0.0005–0.004 m
Vertical: 0.001–0.008 m
Vertical + planimetrical: 0.0011–0.008 m
Table 1. Coordinates of the scan positions used during the terrestrial laser scanner surveys.
The instrumental precision of the device is:
Planimetric: 3 mm + 0.1 ppm (rms)
Vertical: 3.5 mm + 0.4 ppm (rms)
The laser scanner has a near-infrared laser beam (1550 nm) with a beam divergence of 0.15 mrad and a range accuracy of 15 mm at 100 m according to the manufacturer’s datasheet (Datasheet VZ-4000). A nominal point spacing of 15 cm at 2500 m distance was chosen for three scans and 20 cm nominal spacing for two scans for analysis regarding the point density.
Co-registration of scan positions was performed using tie points (cylindric reflectors, 0.1 × 0.1 m, made of Spectralon, a material with Lambertian scattering properties). These reflectors were placed on a tripod and located at 15 m radius from each scan position. Using a long-range terrestrial laser scanning (TLS) with a wavelength of 1550 nm (VZ4000 model), it is possible to operate up to 4 km but the laser beam within a short range (10 m radius from the laser) is affected by noise. Therefore, we placed the reflector in a safety position, out of a radius of 15 m from the scanner position, in order to guarantee a clean signal and a high accuracy for the detection and the positioning of the reflectors. Following the initial alignment of the scans, the fine registration by the iterative closest point (ICP) algorithm was done and its result was 0.06 m standard deviation of error distribution between the different scans. After the ICP procedure, the merged point cloud was exported into an LAS file containing the XYZ coordinates, range (m) and signal amplitude (digital number DN) for each laser point. In ArcGIS, the LAS Dataset was created, with the appropriate filter properties set, and was used as input to the LAS Dataset To Raster tool. This tool’s rasterization is performed mostly through fast binning of points. Since LiDAR is so dense compared to other sampling techniques, many consider binning sufficient and that more time-consuming interpolation methods are unnecessary. This is arguably true, particularly with first returns where the sampling is relatively consistent. Bare earth sample density varies according to the frequency and density of aboveground features (e.g., vegetation, buildings). This tool does allow filling and interpolating across voids (cells for which there are no samples), but if these are too many, using the terrain dataset may produce better results. The parameters used for producing a DEM were the minimum value for cell assignment type and the 0.20 for the pixel size.
MICMAC software from IGN was used for the photogrammetry rendering. MICMAC employed a modified version of the scale invariant feature transform algorithm (CitationLowe, 2004) for tie points extraction. The first step regards the semi-automatic alignment of the 709 acquired images. This process is conducted according to the shared features that have been identified in the overlapping portions of images (). Since the flight with the helicopter was performed in a critical area (the presence of gas and wind does not allow a proximity flight), the acquired dataset shows a good coverage on the summit area depredating at the board where the images are affected by distortion.
Figure 3. 3D view of the target area and position of the 709 images acquired from the helicopter to build the orthorectified map shown in Main Map. The black lines indicate the normal of the camera frame.
The photogrammetric point cloud has been aligned using the georeferenced TLS dataset and considering the portion of land without snow coverage. This process allowed generating a first 3D point cloud that includes all the portions of Etna. Using this approach, the surface measurement and reconstruction is formulated as an energy function minimization problem, using pyramidal processing (CitationRemondino, Spera, Nocerino, Menna, & Nex, 2014). This strategy, which could be defined as hierarchical, is followed in order to optimize the results in terms of speed and quality; first, the best homologous points are found using a highly subsampled set of images that allows producing rough layout data that can be refined step-by-step on images with gradually improved resolution (pyramidal approach) and moreover enables a reduction of the research area for each pixel. In the workflow, each pyramid level guides the matching at the next, higher resolution level to improve the quality of the matching. After the first point extraction, MICMAC uses a global method in order to process the entire surface at the same time but with the disadvantage of the time needed for data processing. To optimize this process, the developer of MICMAC follows the approach of the dynamic programming and the graph cutting methods. These methods consist of looking for the minimum of an energy function made up of one part controlling the similarity between images and another part for the surface regularization to be reconstructed. After this step, the orientation and the camera parameters are computed. The simplified strategy after the relative orientation and camera calibration using Tapas allows setting the scale and an orientation to the object in order to transform the results from image coordinates to the real world using Bascule (GCP selected from laser scanner data).
Subsequently, a dense image matching for surface reconstruction is realized using a tool called Malt. The dense digital terrain model is achieved starting from the derived camera poses and multi-stereo correlation results. Each pixel of the master image is projected in object space according to the image orientation parameters and the associated depth values. For each 3D point, an RGB attribute from the master image is assigned (CitationPierrot-Deseilligny, De Luca, & Remondino, 2011). Finally, single true orthoimages are generated using the same tool. Following these steps and in order to achieve some final products, an orthophoto mosaic using Tawny or a complete point cloud using Nuage2Ply can be generated as output (CitationMouget & Lucet, 2014).
The final photogrammetry model has an average ground pixel resolution of 0.015 m. Within GIS, we performed a spatial analysis to detect the effective photogrammetry coverage of the area and to define the point density on the summit area, which represents the critical part due to the volcanic gas. The result shows a spatial resolution of 0.70 m (average density of 2 points/sqm) considering the error in the three coordinates. This parameter is quite far away from the resolution expected, but, at the same time, highlights the hidden area affected by the gas emitted from the CC.
The spatial density analysis allows one to define the proper resolution which needs to be higher than the average point density but lower enough to identify the no data area. So that, we decided to align the raw photogrammetric point cloud (with a variable density) using the TLS dataset, then to resample the final model to 1 m of resolution. Finally, from the RGB images we extract a mask to delineate the snow cover area and to exclude the snow points from the process.
To record the thermal images of Etna’s summit craters displayed in (f), we have used an FLIR portable thermal camera, model SC660. This is equipped with an uncooled microbolometer, and is able to record 640 × 480 pixel images in the 8–14 μm waveband with sampling rates up to 30 Hz and temperature range between −40°C and 1500°C (CitationCalvari et al., 2005; CitationHarris, 2013; CitationSpampinato et al., 2011). Ambient temperature and air humidity are measured each time at the start of the thermal survey, emissivity for lava flows is typically assumed to be between 0.95 and 0.98 (CitationBuongiorno, Realmuto, & Fawzi, 2002), and these values are inserted in the thermal camera analysis software before recording starts (CitationBall & Pinkerton, 2006). Precision of the instrument is ±2%, and thermal sensitivity is <0.08°C at 30°C.
4. Results
The area (4 km2) investigated by our survey and framed in the Main Map comprises the summit zone of Mt. Etna between 2800 and 3330 m a.s.l. The ortorectified photo of the summit area (Main Map, frame ‘a’) shows details of the topography of NE Crater (NEC), VOR, BN, SEC and NSEC. VOR and BN are vents that have opened inside the CC. The contour lines of the inner portion of the NEC were reconstructed on the basis of 2010 data (CitationBehncke et al., 2016), because the images acquired on 14 December 2015 did not allow observing the crater floor due to very dense gas ( and Main Map, frame ‘b’). This hindrance was also found in an area rich in fumaroles, along the CC and SEC-NSEC rims (Main Map, frame ‘c’). In these areas, we interpolated the measurements using the closest reliable points, but obviously the elevation bar error is higher (up to 3–4 m) than in other zones. These areas are highlighted in light gray (see also ).
Figure 4. 2015 DEM of the summit area of Mount Etna, with outlines of the areas affected by recent lava covers (the red numbers refer to the age of the products). Areas characterized by uncertainties are in light gray. The ages of the summit craters are in brackets.
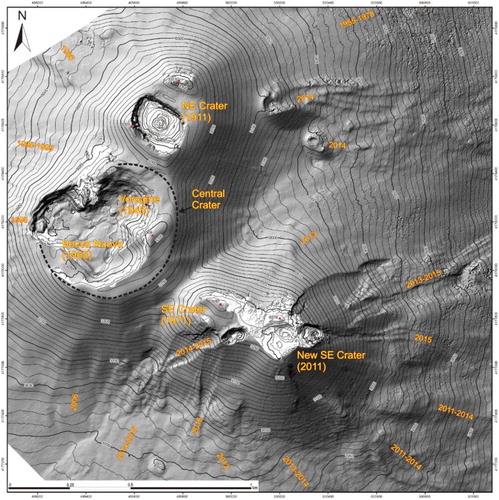
The SW portion of the NEC rim is the highest peak of Etna, reaching 3324 m a.s.l. The crater within NEC cone is an almost regular funnel-shaped, ∼150 m deep depression (see Main Map, frames ‘a’ and ‘b’). The size of the crater is 230 m in the E–W direction and 170 m in the N–S direction. NEC is separated from CC by a saddle located ∼30 m below its southern rim.
The survey carried out on 14 December 2015, following the powerful explosive episodes (lava fountains) at VOR between 3 and 5 December, displays a CC whose bottom has been deeply modified by the recent eruptive activity. The crater bottom is almost flat and full of welded spatter and lava from the proximal ballistic fallout of the lava fountains (). Thus, the previous wall separating BN and VOR () is hidden (cfr. CitationBehncke et al., 2016), and the crater now has an outline marked by three lobes where the previous VOR, and the two pits of BN were located (cfr. CitationBehncke et al., 2016; CitationNeri et al., 2008). The size of the CC rim is 405 m (E–W) and 460 m (N–S) (Main Map, frames ‘c–e’). The crater bottom now lies at ∼3200 m a.s.l., just ∼30 m below its western rim. To the east, the highest point of the CC rim reaches 3309 m a.s.l.; this area is intersected by several NE–SW fractures continuing towards SW, within the southern half of the CC (Main Map, frame ‘a’). Comparing the topography obtained by this survey with a previous topography from 2010 (CitationBehncke et al., 2016), we can calculate the cumulated volume of proximal volcanic products erupted by VOR during the paroxysmal phases of 3–5 December 2015 (). The volume emplaced within the CC depression and along its rim is 7.2 ± 0.15 × 10⁶ m3 of vesiculated rock, which matches well with the ∼6.2 × 10⁶ m3 dense rock equivalent magma obtained by CitationBonaccorso and Calvari (in press) on the basis of volcanological and geophysical measurements.
Figure 5. Comparison between the 2015 (this paper) and 2010 (CitationBehncke et al., 2016) DEMs of the CC. See text for details.
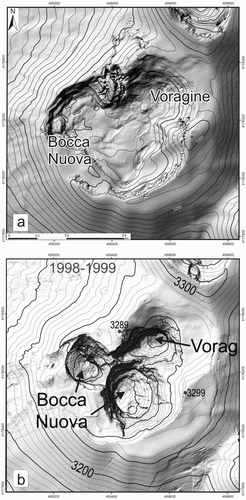
Another important morphology change in the summit area pertains to the SEC and NSEC. The previous maps, compiled in 2005 and 2007, showed just a pit crater on the upper and middle eastern flank of SEC (CitationNeri et al., 2008), which widened in the following years and up to 2010 (CitationBehncke et al., 2016) giving rise to another cone on top and to a lava fan from its base (CitationBehncke et al., 2014). The new survey presented here displays two cones, the SEC and NSEC, having almost the same elevation (3287 m and 3275 m a.s.l., respectively). The upper eastern flank of the NSEC has a new pit, some tens of meters wide, with a fan of lava flows from its base spreading eastwards, towards the Valle del Bove. Between the summit of SEC and NSEC, an ellipsoidal crater represents the highest feature of an ENE–WSW fissure opened in December 2014 (CitationBonforte & Guglielmino, 2015) and reactivated several times during 2015.
Our survey also comprises the area between NEC and SEC that was the site of explosive and effusive activity between 5 July and 10 August 2014. This activity produced two small cinder cones and a lava flow field extending on the western wall of the Valle del Bove. The lava flow field extends further east and outside of our map shown in Main Map, frames ‘a’ and ‘b’, but the two cinder cones lay within. The first cinder cone is located between 3080 and 3155 m a.s.l. to the east of NEC. It has a basal diameter of ∼203 m (measured in the N–S direction), a height of ∼5 m (to the W) and ∼60 m (to the E), and a summit crater diameter (N–S) of 68 m, for a total volume of 0.23 ± 0.005 × 10⁶ m3. The second cone is smaller and located a few hundred meters to the SE. It lays between 3020 and 3060 m a.s.l., has a basal diameter of ∼115 m, a height of ∼10 (W) and ∼30 m (E), and a summit crater diameter of ∼34 m (N–S), for a total volume of 0.10 ± 0.002 × 10⁶ m3 ().
The thermal map in Main Map frame ‘e’ displays the CC. It shows a central depression comprising three main lobes, belonging to the former VOR crater (the NE lobe) and to the NW and SW pits of BN. The eruptive activity of 3–5 December 2015 occurring at VOR produced four powerful paroxysms that have completely modified the outline of the CC (CitationBonaccorso & Calvari, in press). The thermal survey carried out by helicopter on 14 December 2015 followed the end of this explosive activity by just 9 days, thus showing a situation very close to that existing at the end of the paroxysms. The CC floor appears full of coarse grained, partially welded products, namely bombs and spatter, deriving from the proximal collapse of the ballistics comprising the lava fountains. The same products also surround the crater rim and extend for several hundreds of meters beyond it and on the upper outer flanks of the summit crater, with thicknesses estimated in several meters.
The outline of the CC rim is thermally hotter (∼70°C of apparent temperature) than the crater floor, and this is caused by the several active fumaroles that intersected this rim before the paroxysmal activity, and that were still degassing at the time of the survey (Main Map, frame ‘c’). The NE lobe of the depression has a bottom at 3220 m a.s.l., which is the shallower of the three lobes (the SW lobe has a floor at ∼3210 m a.s.l. and the NW lobe at ∼3200 m a.s.l.). This is consistent with the position here of the explosive vent causing the eruptive activity of 3–5 December 2015, and thus with a greater accumulation of ejecta at this site. In fact, the central part of the NE lobe also has a circular area with an apparent temperature of ∼50°C, much hotter than the 0–10°C observed in the middle of the SW and NW lobes. We then identify this zone as the source vent that gave rise to the four VOR paroxysmal lava fountain episodes occurring between 3 and 5 December 2015. It has a diameter of ∼50 m, and lies at an elevation that is more than 70 m greater than before the paroxysms.
5. Conclusions
The survey conducted on Mount Etna volcano has enabled drafting new topographic and thermal maps of the summit area, at high resolution and accuracy. These maps indicate and quantify the main morpho-structural changes occurring during the powerful eruptions that involved three of the summit craters, i.e. VOR, NSEC and NEC, over the first two weeks of December 2015. The system used for the 3D reconstruction includes helicopter photogrammetry acquired by two RGB cameras, thermal images taken during the same survey and a terrestrial laser scanner (Riegl VZ4000) survey on the ground. The laser scanner data are used both to obtain a land surface model of the area and as reference target to extract sufficient GCP to georeference the survey by helicopter and calibrate the accuracy of the 3D reconstruction. This system proved very fast, effective and reliable and can easily be applied during future intense eruptive activity at this and other volcanoes to detect and quantify the erupted products and morphology changes.
Software
The GCP,extracted from the laser scanner dataset through CloudCompare (http://www.danielgm.net/) and RiscanPro (http://www.riegl.com), have been used to georeference the dataset acquired from the helicopter (both photos and thermal images) and to verify the accuracy of the photogrammetric reconstruction. MICMAC software (http://micmac.ensg.eu) from IGN was used for the photogrammetry rendering. The maps and schemes in Supplemental Content were generated using CorelDRAW graphic suite X4 software (http://www.corel.com/it/).
Topographic Maps of Mount Etna’s Summit Craters, updated to December 2015.pdf
Download PDF (18.7 MB)Acknowledgements
The Etna overflight was made by Butterfly S.r.L. Helicopters Services, piloted by Piero Berti. We would like to thank the Editor B. Cattoor and the reviewers A. Bonforte and I. Nicolosi for their constructive criticism and helpful suggestions. S. Conway improved the English.
Disclosure statement
No potential conflict of interest was reported by the authors.
ORCID
Marco Neri http://orcid.org/0000-0002-5890-3398
Marina De Maio http://orcid.org/0000-0002-1271-2537
Stefano Crepaldi http://orcid.org/0000-0001-6804-9212
Enrico Suozzi http://orcid.org/0000-0003-3742-0917
Muriel Lavy http://orcid.org/0000-0003-2571-5662
Federico Marchionatti http://orcid.org/0000-0003-1277-6159
Sonia Calvari http://orcid.org/0000-0001-8189-5499
Maria Fabrizia Buongiorno http://orcid.org/0000-0002-6095-6974
Related Research Data
References
- Acocella, V., Neri, M., Behncke, B., Bonforte, A., Del Negro, C., & Ganci, G. (2016). Why does a mature volcano need New vents? The case of the new southeast Crater at Etna. Frontiers in Earth Science, 4, 2286. doi: 10.3389/feart.2016.00067
- Ball, M., & Pinkerton, H. (2006). Factors affecting the accuracy of thermal imaging cameras in volcanology. Journal of Geophysical Research: Solid Earth, 111, B11203. doi: 10.1029/2005JB003829
- Behncke, B., Branca, S., Corsaro, R. A., De Beni, E., Miraglia, L., & Proietti, C. (2014). The 2011–2012 summit activity of Mount Etna: Birth, growth and products of the new SE crater. Journal of Volcanology and Geothermal Research, 270, 10–21. doi: 10.1016/j.jvolgeores.2013.11.012
- Behncke, B., Fornaciai, A., Neri, M., Favalli, M., Ganci, G., & Mazzarini, F. (2016). LiDAR surveys reveal eruptive volumes and rates at Etna, 2007–2010. Geophysical Research Letters, 42. doi: 10.1002/2016GL068495
- Behncke, B., Neri, M., Pecora, E., & Zanon, V. (2006). The exceptional activity and growth of the Southeast Crater, Mount Etna (Italy), between1996 and 2001. Bulletin of Volcanology, 69, 149–173. doi: 10.1007/s00445-006-0061-x
- Behncke, B., Neri, M., & Sturiale, G. (2004). Rapid morphological changes at the summit of an active volcano: Reappraisal of the poorly documented 1964 eruption of Mount Etna (Italy). Geomorphology, 63, 203–218. doi: 10.1016/j.geomorph.2004.04.004
- Bisson, M., Behncke, B., Fornaciai, A., & Neri, M. (2009). Lidar-based digital terrain analysis of an area exposed to the risk of lava flow invasion: The Zafferana Etnea territory, Mt. Etna (Italy). Natural Hazards, 50(2), 321–334. doi: 10.1007/s11069-009-9346-7
- Bisson, M., Spinetti, C., Neri, M., & Bonforte, A. (2016). Mt Etna volcano high-resolution topography: Airborne LiDAR modelling validated by GPS data. International Journal of Digital Earth., 9(7), 710–732. doi: 10.1080/17538947.2015.1119208
- Bonaccorso, A., & Calvari, S. (2013). Major effusive eruptions and recent lava fountains: Balance between erupted and expected magma volumes at Etna volcano. Geophysical Research Letters, 40, 6069–6073. doi: 10.1002/2013GL058291
- Bonaccorso, A., & Calvari, S. (in press). A new approach to investigate an eruptive paroxysmal sequence using camera and strainmeter networks: Lessons from the 3–5 December 2015 activity at Etna volcano. Earth Planetary Science Letters.
- Bonaccorso, A., Calvari, S., & Boschi, E. (2015). Hazard mitigation and crisis management during major flank eruptions at Etna volcano: Reporting on real experience. In A. J. L. Harris, T. De Groeve, F. Garel, & S. A. Carn (Eds.), Detecting, modelling and responding to effusive eruptions, geological society (vol. 426). London: Special Publications (IAVCEI) Series. doi: 10.1144/SP426.4
- Bonforte, A., & Guglielmino, F. (2015). Very shallow dyke intrusion and potential slope failure imaged by ground deformation: The 28 December 2014 eruption on Mount Etna. Geophysical Research Letters, 42, 2727–2733. doi: 10.1002/2015GL063462
- Buongiorno, M. F., Realmuto, V. J., & Fawzi, D. (2002). Recovery of spectral emissivity from thermal infrared multispectral scanner imagery acquired over a mountainous terrain: A case study from Mount Etna sicily. Remote Sensing of Environment, 79, 123–133. doi: 10.1016/S0034-4257(01)00246-2
- Calvari, S., Coltelli, M., Muller, W., Pompilio, M., & Scribano, V. (1994). Eruptive history of South-Eastern crater of Mount Etna, from 1971 to 1994. Acta Vulcanologica, 5, 11–14.
- Calvari, S., Muller, W., & Scribano, V. (1995). Major morphology changes and eruptive activity of Bocca Nuova crater (Mt. Etna) from 1988 to 1994. Periodico di Mineralogia., 64, 113–114.
- Calvari, S., & Pinkerton, H. (2004). Birth, growth and morphologic evolution of the ?Laghetto? Cinder cone during the 2001 Etna eruption. Journal of Volcanology and Geothermal Research, 132, 225–239. doi: 10.1016/S0377-0273(03)00347-0
- Calvari, S., Salerno, G. G., Spampinato, L., Gouhier, M., La Spina, A., Pecora, E., … Boschi, E. (2011). An unloading foam model to constrain Etna’s 11–13 January 2011 lava fountaining episode. Journal of Geophysical Research: Solid Earth, 116, B11207. doi: 10.1029/2011JB008407
- Calvari, S., Spampinato, L., Lodato, L., Harris, A. J. L., Patrick, M. R., Dehn, J., … Andronico, D. (2005). Chronology and complex volcanic processes during the 2002–2003 flank eruption at Stromboli volcano (Italy) reconstructed from direct observations and surveys with a handheld thermal camera. Journal of Geophysical Research, 110, B02201. doi: 10.1029/2004JB003129
- Cappello, A., Bilotta, G., Neri, M., & Del Negro, C. (2013). Probabilistic modeling of future volcanic eruptions at Mount Etna. Journal of Geophysical Research: Solid Earth, 118, 1925–1935. doi: 10.1002/jgrb.50190
- Chester, D. K., Duncan, A. M., Guest, J. E., & Kilburn, C. R. J. (1985). Mount Etna – The anatomy of a volcano. London: Chapman and Hall.
- Crisci, G. M., Avolio, M. V., Behncke, B., D’Ambrosio, D., Di Gregorio, S., Lupiano, V., … Spataro, W. (2010). Predicting the impact of lava flows at Mount Etna. Journal of Geophysical Research, 115, 517. doi: 10.1029/2009JB006431
- De Beni, E., Behncke, B., Branca, S., Nicolosi, I., Carluccio, R., D’Ajello, Caracciolo, F., & Chiappini, M. (2015). The continuing story of Etna’s New southeast crater (2012–2014): evolution and volume calculations based on field surveys and aerophotogrammetry. Journal of Volcanology and Geothermal Research, 303, 175–186. doi: 10.1016/j.jvolgeores.2015.07.021
- Del Negro, C., Cappello, A., Neri, M., Bilotta, G., Hérault, A., & Ganci, G. (2013). Lava flow hazards at Etna volcano: Constraints imposed by eruptive history and numerical simulations. Scientific Reports, 3, L13317. doi: 10.1038/srep03493
- Falsaperla, S., & Neri, M. (2015). Seismic footprints of shallow dyke propagation at Etna, Italy. Scientific Reports, 5, 307. doi: 10.1038/srep11908
- Favalli, M., Fornaciai, A., Mazzarini, F., Harris, A., Neri, M., Behncke, B., … Boschi, E. (2010). Evolution of an active lava flow field using a multitemporal LIDAR acquisition. Journal of Geophysical Research, 115, 314. doi: 10.1029/2010JB007463
- Fornaciai, A., Behncke, B., Favalli, M., Neri, M., Tarquini, S., & Boschi, E. (2010). Detecting short-term evolution of Etnean scoria cones: A LIDAR-base approach. Bulletin of Volcanology, 72, 1209–1222. doi: 10.1007/s00445-010-0394-3
- Ganci, G., James, M. R., Calvari, S., & Del Negro, C. (2013). Separating the thermal fingerprints of lava flows and simultaneous lava fountaining using ground-based thermal camera and SEVIRI measurements. Geophysical Research Letters, 40(1–6), doi: 10.1002/grl.50983
- Giammanco, S., Melián, G., Neri, M., Hernández, P. A., Sortino, F., Barrancos, J., … Perez, N. M. (2016). Active tectonic features and structural dynamics of the summit area of Mt. Etna (Italy) revealed by soil CO2 and soil temperature surveying. Journal of Volcanology and Geothermal Research, 311, 79–98. doi: 10.1016/j.jvolgeores.2016.01.004
- Giammanco, S., Sims, K. W. W., & Neri, M. (2007). Measurements of 220Rn and 222Rn and CO2 emissions in soil and fumarole gases on Mt. Etna volcano (Italy): implications for gas transport and shallow ground fracture. Geochemistry, Geophysics, Geosystems, 8, Q10001. doi: 10.1029/2007GC001644
- Guest, J. E. (1973). The summit of Mount Etna prior to the 1971 eruptions. Philosophical Transactions of the Royal Society A: Mathematical, Physical and Engineering Sciences, 274, 63–78. doi: 10.1098/rsta.1973.0026
- Harris, A. J. L. (2013). Thermal remote sensing of active volcanoes – A user’s manual. Cambridge University Press, 736 pp. ISBN 9780521859455.
- Harris, A. J. L., Steffke, A., Calvari, S., & Spampinato, L. (2011). Thirty years of satellite-derived lava discharge rates at Etna: Implications for steady volumetric output. Journal of Geophysical Research, 116, B08204. doi: 10.1029/2011JB008237
- Harris, A. J. L., Steffke, A., Calvari, S., & Spampinato, L. (2012). Correction to “thirty years of satellite-derived lava discharge rates at Etna: Implications for steady volumetric output”. Journal of Geophysical Research Solid Earth, 117, B08207. doi: 10.1029/2012JB009431
- James, M. R., Applegarth, L. J., & Pinkerton, H. (2012). Lava channel roofing, overflows, breaches and switching: Insights from the 2008–2009 eruption of Mt. Etna. Bulletin of Volcanology, 74, 107–117. doi: 10.1007/s00445-011-0513-9
- Lowe, D. (2004). Distinctive image features from scale invariant keypoints. International Journal of Computer Vision, 60(2), 91–110. doi: 10.1023/B:VISI.0000029664.99615.94
- Lyell, C. (1858). On the structure of lavas which have consolidated on steep slopes; with remarks on the mode of origin of Mount Etna, and on the theory of “craters of elevation”. Philosophical Transactions of the Royal Society of London, 148, 703–904. doi: 10.1098/rstl.1858.0032
- McGetchin, T. R., Settle, M., & Chouet, B. A. (1974). Cinder cone growth modeled after northeast crater, Mount Etna, sicily. Journal of Geophysical Research, 79(23), 3257–3272. doi: 10.1029/JB079i023p03257
- Mouget, A., & Lucet, G. (2014). Photogrammetric archaeological survey with UAV. ISPRS Annals of the Photogrammetry, Remote Sensing and Spatial Information Sciences (Vol. II-5, pp. 251–258), Riva Del Garda, Italy.
- Murray, J. B. (1976). Changes at the summit of Mount Etna 1973–1975 (pp. 9–12). U.K. Research on Mount Etna, 1975–1976. The Royal Society.
- Murray, J. B. (1980a). Map of the summit area of Mt Etna in September 1978 (pp. 33–37). U.K. Research on Mount Etna, 1977–1979. The Royal Society.
- Murray, J. B. (1980b). The Bocca Nuova: Its history and possible causes of the 12 September 1979 explosion (pp. 46–49). U.K. Research on Mount Etna, 1977–1979. The Royal Society.
- Neri, M., Mazzarini, F., Tarquini, S., Bisson, M., Isola, I., Behncke, B., & Pareschi, M. T. (2008). The changing face of Mount Etna’s summit area documented with lidar technology. Geophysical Research Letters, 35, 85. doi: 10.1029/2008GL033740
- Pierrot-Deseilligny, M., De Luca, L., & Remondino, F. (2011). Automated image-based procedures for accurate artifacts 3D modelling and orthoimage generation. Geoinformatics FCE CTU Journal, 6( 0), 291–299. doi:10.14311/gi.6.36.
- Remondino, F., Spera, M. G., Nocerino, E., Menna, F., & Nex, F. (2014). State of the art in high density image matching. The Photogrammetric Record, 29(146), 144–166. doi: 10.1111/phor.12063
- Slatcher, N., James, M. R., Calvari, S., Ganci, G., & Browning, J. (2015). Quantifying effusion rates at active volcanoes through integrated time-lapse laser scanning and photography. Remote Sensing, 7, 14967–14987. doi: 10.3390/rs71114967
- Spampinato, L., Calvari, S., Oppenheimer, C., & Boschi, E. (2011). Volcano surveillance using infrared cameras. Earth-Science Reviews, 106, 63–91. doi: 10.1016/j.earscirev.2011.01.003
- Wadge, G., & Guest, J. E. (1981). Steady-state magma discharge at Etna 1971–81. Nature, 294, 548–550. doi: 10.1038/294548a0