
 ?Mathematical formulae have been encoded as MathML and are displayed in this HTML version using MathJax in order to improve their display. Uncheck the box to turn MathJax off. This feature requires Javascript. Click on a formula to zoom.
ABSTRACT
Nitrates present one of the most common groundwater contaminants in the world and one of the five major groups of contaminants in the study area. Gaussian simulation (GS) algorithm was used for determining the spatial distribution of average nitrate concentrations from 2010 to 2015 on 95 sampling points. Results indicate two main focus areas of nitrate contamination, located on the left and right bank of the Sava River. Those areas generally extend according to groundwater flow, while areas near Sava River have much smaller concentrations. GS showed that they can be useful for this kind of mapping because they favor abrupt changes in data values which are in this case a result of heterogeneous lithological composition of the aquifer.
1. Introduction
Nitrate contamination presents one of the most common groundwater quality problems in the world (CitationAlmasri, 2007; CitationPeña-Haro, Pulido-Velazquez, & Sahuquillo, 2009) and in the Croatia (CitationLarva, Marković, & Brkić, 2010; CitationNakić et al., 2013). Nitrates do not have the ability to bond on soil by adsorption and they are also very soluble and have high potential for leaching from surface through unsaturated zone to groundwater (CitationChowdary, Rao, & Sarma, 2005; CitationMkandawire, 2008). Numerous studies showed a strong relationship between agriculture and increased nitrate concentration in groundwater (CitationHosono et al., 2013; CitationLi, Liu, Lang, Zhao, & Zhou, 2010; CitationLiu, Ming, & Ankumah, 2005; CitationPeña-Haro et al., 2009). However, nitrate concentrations can be a consequence of different simultaneous sources, e.g. manure, fertilizers, atmospheric deposition, irrigation, septic tanks, sewage systems, lawns, gardens, dairy lagoons and landfills (CitationAlmasri, 2003, Citation2007; CitationPeña-Haro et al., 2009). Different natural factors can also have influence on their stability, mobility and transformation in unsaturated and saturated zones. CitationLake et al. (2003) determined surface leaching, soil characteristics, drift cover and aquifer type as four main groups of parameters that have influence on groundwater vulnerability to nitrate pollution. CitationAlmasri (2003, Citation2007) noted that nitrate leaching from unsaturated zone presents consequence of complex interaction between on-ground nitrogen loading, land use, nitrogen dynamics, soil characteristics, recharge and depth to groundwater table. In groundwater, they mostly depend on transport (e.g. advection, dispersion and diffusion) and geochemical (e.g. denitrification) processes, but also on aerobic and anaerobic conditions in unsaturated and saturated zones. CitationKovač, Pavlić, and Nakić (2016) have showed that there is good to very good statistically significant positive correlation between nitrate and dissolved oxygen concentrations in Zagreb aquifer. CitationKovač, Nakić, and Pavlić (2017) have concluded, based on the results of multivariate statistical analysis, that nitrate concentrations in the Zagreb aquifer are more related to dissolved oxygen concentrations, pH and electrical conductivity values than oxidation-reduction potential and groundwater temperature. Also, CitationKovač et al. (2017) have pointed out that lower nitrate and dissolved oxygen concentrations in areas near Sava River, and in the eastern part of the aquifer, are probably the consequence of Sava River influence and increase of aquifer depth toward the east where mixing of aerobic and anaerobic water occurs. CitationNakić et al. (2013) determined nitrates as one of the five main groups of contaminants in groundwater of Zagreb aquifer. Generally, spatial distribution of nitrate concentration in groundwater is a function of numerous physical, chemical and biological processes that take place at the surface, unsaturated and saturated zones. The main objective of this paper was to construct the most representative nitrate concentrations map using Gaussian simulations (GS) algorithm and identify the most contaminated areas with increased nitrate concentrations. The other objective was to test whether the GS could be used for the construction of maps that show spatial distribution of chemical substances in groundwater when the spatial distribution of observation wells is not ideal and when lithological and hydraulic properties vary widely.
2. Research area
Zagreb aquifer is located in NW part of the Republic of Croatia (Main Map) between mountain Medvednica in the north and Vukomeričke Gorice hills in the south (). It presents the only source of potable water for about 850,000 inhabitants of the City of Zagreb and part of Zagreb County, and it is designated as part of country’s strategic water reserves. It covers an area of approximately 350 km2. In general, the region is characterized by large variability in lithology, hydraulic properties of the aquifer, pedological features and land use.
Figure 1. Research area.
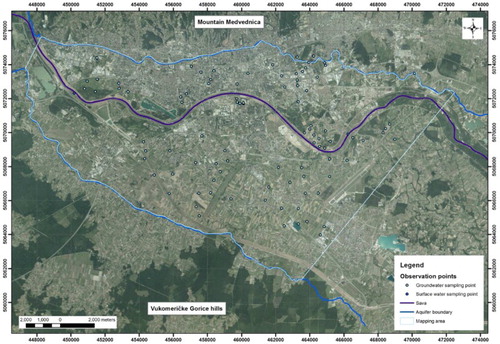
Zagreb aquifer is made of two Quaternary age aquifers deposited during the Middle and Upper Pleistocene (lacustrine-marshy deposits) and Holocene (alluvial deposits) (CitationVelić & Durn, 1993; CitationVelić, Saftić, & Malvić, 1999). They present one hydrogeological unit, but indicate geochemical stratification along the depth (CitationMarković, Brkić, & Larva, 2013). Lower Pleistocene deposits are mostly composed of clayey silts and silty clays with sporadic interbeds and lenses of gravelly sands. Lower and middle parts of Middle Pleistocene deposits are dominantly made of sands, while the upper part is made of silts and clays. In the Late Pleistocene, frequent lateral changes of gravels, sands, silts and clays can be found. The Holocene part is mostly made of gravels and sands (CitationVelić & Durn, 1993). Main stratigraphic determination was performed based on microfaunal and microfloral analysis (CitationHernitz, Kovačević, Velić, & Urli, 1981; CitationSokač, 1978). The boundary between Pleistocene and Holocene was set based on the change in the sedimentary environment from lacustrine–marsh deposits to fluvial, and the change in origin in the petrography of the clasts in gravels and sands. With the onset of Holocene, it is presumed that Sava River started to flow and with it came the material from the Alps which was dominantly carbonate in contrast to material which was deposited during Pleistocene, which was mostly siliciclastic (CitationVelić & Saftić, 1991).
In hydrogeological terms, Quaternary deposits contain three units. First unit is the overburden generally made of silt and clay. The thickness of the first unit varies from 2 to 8 m (CitationRužičić, Mileusnić, & Posavec, 2012). In some areas, overburden is destroyed by anthropogenic influence. Second unit is shallow aquifer made of gravel and sand, while third unit is the deeper aquifer characterized with lateral and vertical alterations of sand, gravel and clay. Hydraulic conductivities of the shallow aquifer go up to 3000 m/day (CitationNakić et al., 2013).
Zagreb aquifer presents an unconfined aquifer which is in the direct contact with Sava River, the main source of recharge. General groundwater flow is from W/NW to E/SE. The thickness of the shallower aquifer is from 5 to 40 m, while deeper aquifer extends up to 60 m in thickness in the eastern area (CitationNakić, Posavec, Parlov, & Bačani, 2011). CitationPosavec (2006) stated that during high water levels Sava River generally gives water to the aquifer, while during medium and low water levels Sava River is draining water from some parts of the aquifer. Also, CitationPosavec (2006) determined no flow boundary in the north of Zagreb aquifer, inflow boundary in the south and west, and outflow boundary in the east. Determination of those boundaries was based on the analyses of head contour maps for high, medium and low groundwater levels. However, determination of areas where Sava River is recharging or draining the aquifer strongly depends on hydrologic conditions and its duration and intensity, as well as anthropogenic influence, for example groundwater abstraction. That means that local groundwater flow direction can vary depending on the hydrological conditions and Sava River fluctuations, what is also very important for studying the movement of potential contamination. There are six major well fields which generally pump groundwater from shallower aquifer for water supply purposes. CitationBačani, Posavec, and Parlov (2010) noted that groundwater levels are declining on average for 1–2 m every 10 years, while the decrease in permanent groundwater reserves is about 4% based on the data from 1976 to 2006. Reasons for groundwater decrease are numerous. The main reasons are associated with deepening the Sava riverbed caused mainly by construction of the power plants and its reservoirs upstream from Zagreb, increase in groundwater abstraction and construction of dikes along the Sava River to prevent occasional flooding of the floodplain. The last reason can consequently lower the potential infiltration of water from the flooded areas into the aquifer. It can be seen that groundwater levels are lower than before what can suggest that some part of potential contamination is trapped in the unsaturated zone and can be slowly released due to intensive rainfall and high Sava River water levels. The thickness of unsaturated zone varies from 8 meters in NW part to 2 meters in SE part. The upper part of this zone is composed mainly of silty to sandy material while the lower part consists of gravels. Both parts are in places intersected with clay layers (CitationRužičić et al., 2012). Predominantly, three pedological units are developed on these sediments: Fluvisols, Stagnic Podzoluvisols (Pseudogley) and Eutric Cambisols (CitationSollitto, Romić, Castrignano, Romić, & Bakić, 2010). Except from nitrates, CitationNakić et al. (2013) have identified pesticides, potentially toxic metals, pharmaceuticals and chlorinated aliphatics as main groups of contaminants. Even though there are different possible potential contamination sources, agricultural activity and leakage from septic tanks and sewage system present the main potential sources of nitrate contamination. On the left bank of the Sava River, there is dominantly urban area what suggests waste water as the main source of nitrate contamination. On the right bank, there are more agricultural areas, where nitrate contamination is probably the consequence of several different and simultaneous sources. Regardless of different anthropogenic sources at the study area, it has been shown that nitrate concentrations are strongly related to dissolved oxygen concentrations in the study area. This suggests that they probably have influence on the stability and mobility of nitrates in Zagreb aquifer (CitationKovač et al., 2016, Citation2017).
3. Data and methods
Data used as input for nitrate concentration mapping were spread out across more than 200 km2 which covers the most of the Zagreb aquifer. All data were obtained from National monitoring program of Croatian Waters. Nitrate concentrations were derived from water samples obtained from 93 observation wells and 2 sampling sites at Sava River, in period from 2010 to 2015. Map was produced based on the average values derived from 10 to 67 measured values, dependent on the sampling interval of certain observation wells. Only observation wells that had data in at least five of six years were used for map production. Average nitrate concentrations varied from 3.52 to 35.59 mg/l of . It is important to note that values indicate that groundwater is safe for drinking according to nitrates concentration and its maximum allowed concentrations (50 mg/l
) defined in Croatian regulations.
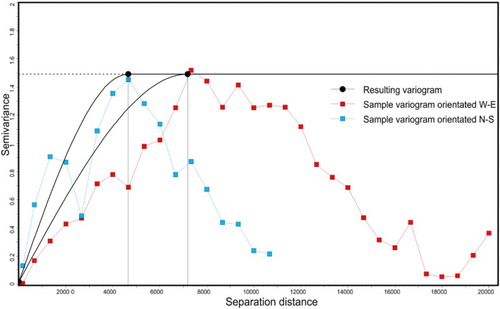
As previously stated, nitrate concentrations rely on many factors, one of which is lithological distribution with its respective petrophysical parameters. Therefore, GS were selected rather than some other conventional and deterministic algorithm, which favors gradual transition of parameters trough space. GS are often used in mapping of petrophysical properties and lithofacies in hydrocarbon reservoir modelling and facies definition (CitationCvetković, 2016; CitationNovak Zelenika, Cvetković, Malvić, Velić, & Sremac, 2013; CitationNovak-Zelenika, Vidaček, Ilijaš, & Pavić, 2017). The basics of the methodology is presented in CitationHand, Yang, and Moritz (1994), CitationDamayanti and Hicks (1996), CitationDeutsch and Journel (1998) and CitationSahin and Al-Salem (2001). The first step for building a map using any kind of kriging or GS is building a variogram, which determines the influence of the data point on the map values. More specifically, how much and how far away from the data point. For the successful building of a variogram, a normal distribution of the input data is needed. As it did not follow the normal distribution (), the data had to be transformed. Box-Cox transformation was firstly employed, as with it a near normal transformation can be obtained (CitationHorváth, Borka, & Geiger, 2017), but for any kind of γ value (CitationBox & Cox, 1964), the results were unsatisfactory. Box-Cox transformation of the data with most favorable γ value of 0.4 is shown in . Normal score transformation proved successful for data to be fitted to the normal distribution (). Experimental variogram was built based on the all of the analyzed data within Petrel software by testing various values of computation of experimental variogram to achieve optimum variogram parameters (e.g. nugget value, major and minor range). An anisotropic variogram was to be expected due to dynamic and complex interrelation between the Sava River and Zagreb aquifer. Most favorable was spherical, anisotropic, with W-E orientation. Major direction axis reach was 7100 (W-E) and 4600 m on the smaller axis (N-S) with a nugget effect of 0.017 (). In other words, sampling points have an influence on assigning cell values in maximum extent of 7100 eastward or westward while the maximum spatial relevance of the sampled point was 4600 to the South or North. Orientation of the variogram was defined based on the Sava River influence on the distribution of groundwater flow, and respectively nitrates concentration in the aquifer. GS, unlike traditional approach, are a stochastic algorithm which means that for the same input data, there can be several output maps/realizations of which all are equally probable (CitationDeutsch & Journel, 1998). Number of realizations which is needed to adequately define the distribution of a parameter in space varies for different applications (CitationJakab, in press). For the purpose of nitrate distribution visualization 50 realizations were performed out of which one was selected. The criteria for selecting one realization out of 50 performed was the comparison of the distribution of nitrate data similarity between the input data set and the result map and similarity of mapped nitrate values in Sava River proximity to the ones measured in the Sava River. For better representation, topographic overlay was used to represent urban areas. Grid resolution of the output surface was 50 × 50 meters.
Figure 2. Histogram plots of the measured (input) nitrate concentration distribution showing the initial distribution, distribution after the Box-Cox transformation and after the normal score transformation.
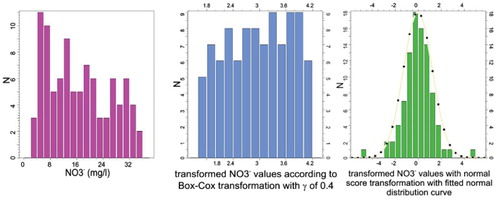
Figure 3. Plotted variance values for construction of anisotropic variogram for GS mapping.
4. Conclusions
Nitrates present one of the five main groups of contaminants in the study area. By determining the areas with increased nitrate concentrations in groundwater, researchers could be able to map high- and low-risk areas. Areas with the highest risk probably have combination of high nitrogen input and thin unsaturated zone. Therefore, local variations in characteristics of unsaturated and saturated zones have a large impact on the nitrate concentration in groundwater. GS algorithm was used for the construction of nitrates concentration map. Two main focus areas of nitrates contamination in Zagreb aquifer can be observed (Main Map), one in the dominantly urban area located on the left bank of the Sava River, and the other on the right bank, in a dominantly agricultural area. Those contaminated areas mainly extend according to general groundwater flow, i.e. from W/NW to E/SE. Due to very little or no agricultural activity on the left bank of the Sava River, it can be assumed that nitrate concentrations are probably the outcome of leakage from sewage or septic tanks. The highest nitrate concentrations are observed in the central and eastern part of the City of Zagreb where sewage is very old. On the right bank, agricultural activity is much more prevalent so it can present additional possible source of nitrate contamination. In this area, the highest nitrate concentrations are observed south of the Sava River and the urban part of the City of Zagreb, what suggests increased use of organic manure and/or fertilizer, as well as the leakage from septic tanks in rural settlements. Areas near Sava River have smaller nitrates concentrations, probably due to bigger influence of the Sava River, and associated geochemical environment and hydrodynamic mixing in its hyporheic zone, which is consistent with the results of previous research. Generally, it can be concluded that GS can be used for this kind of mapping because they favor abrupt changes in data values much in relation to changes in lithological composition that can be observed at the investigated location.
Software
Prior to mapping, input data were firstly averaged in Microsoft Excel to be statistically viable. Nitrate concentration mapping was performed in Schlumberger Petrel with GS algorithm. The end map was constructed in Corel Draw X6 while the geocoded terrain image was obtained from geoportal of Croatian Geodetic Administration.
Kovac_et_al_float_map_bitma_black_final.pdf
Download PDF (17.3 MB)Acknowledgements
Authors would like to thank the Schlumberger Company for providing the Academic licenses of Petrel Software to the Faculty without which this kind of analysis, in its current extent, would not be possible. Also, authors would like to thank Croatian Waters for the data obtained within the project ‘Definition of trends and groundwater status assessment in the Pannonian part of the Croatia’.
Disclosure statement
No potential conflict of interest was reported by the authors.
Additional information
Funding
Related Research Data
References
- Almasri, M. N. (2003). Optimal management of nitrate contamination of ground water (PhD Dissertation). Utah State University, Logan, Utah, 229 p.
- Almasri, M. N. (2007). Nitrate contamination of groundwater: A conceptual management framework. Environmental Impact Assessment Review, 27, 220–242. doi: 10.1016/j.eiar.2006.11.002
- Bačani, A., Posavec, K., & Parlov, J. (2010, September 12–17). Groundwater quantity in the Zagreb aquifer. In A. Zuber, J. Kania, & E. Kmiecik (Eds.), XXXVIII IAH Congress groundwater quality sustainability (pp. 87–92). Krakow: University of Silesia Press.
- Box, G. E. P., & Cox, D. R. (1964). An analysis of transformations. Journal of the Royal Statistical Society, Series B (Methodological), 2, 211–252.
- Chowdary, V. M., Rao, N. H., & Sarma, P. B. S. (2005). Decision support framework for assessment of non-point-source pollution of groundwater in large irrigation projects. Agricultural Water Management, 75, 194–225. doi: 10.1016/j.agwat.2004.12.013
- Cvetković, M. (2016). Modelling of maturation, expulsion and accumulation of bacterial methane within Ravneš Member (Pliocene age), Croatia onshore. Open Geosciences, 8(2), 5–13. doi: 10.1515/geo-2016-0002
- Damayanti, M. C., & Hicks, P. J. (1996). A geostatistical study of a pilot area in the Griffithsvile oil field. Society of Petroleum Engineers, 37332, 93–106.
- Deutsch, C. V., & Journel, A. G. (1998). GSLIB: Geostatistical Software Library and user's guide (2nd ed.). New York: Oxford University Press, 369 p.
- Hand, J. L., Yang, C.-T., & Moritz, A. L. (1994). Ability of geostatistical simulations to reproduce geology: A critical evaluation. Society of Petroleum Engineers, 28414, 533–545.
- Hernitz, Z., Kovačević, S., Velić, J., & Urli, M. (1981). Primjer kompleksnih geološko-geofizičkih istraživanja kvartarnih naslaga u okolici Prevlake [ An example of complex geological and geophysical explorations of Wuaternary deposits in the surroundings of Prevlaka]. Geološki Vjesnik, 33, 11–34, Zagreb.
- Horváth, J., Borka, S., & Geiger, J. (2017). Cluster defined sedimentary elements of deep-water clastic depositional systems and their 3D spatial visualization using parametrization: A case study from the Pannonian-basin. Geologia Croatica, 70, 73–78. doi: 10.4154/gc.2017.06
- Hosono, T., Tokunaga, T., Kagabu, M., Nakata, H., Orishikida, T., Lin, I., & Shimada, J. (2013). The use of δ15N and δ18O tracers with an understanding of groundwater flow dynamics for evaluating the origins and attenuation mechanisms of nitrate pollution. Water Research, 47, 2661–2675. doi: 10.1016/j.watres.2013.02.020
- Jakab, N. (in press). Stochastic modelling in geology: Determining the sufficient number of models. Central European Geology. doi: 10.1556/24.60.2017.005
- Kovač, Z., Nakić, Z., & Pavlić, K. (2017). Influence of groundwater quality indicators on nitrate concentrations in the Zagreb aquifer system. Geologia Croatica, 70(2), 93–103. doi: 10.4154/gc.2017.08
- Kovač, Z., Pavlić, K., & Nakić, Z. (2016). Influence of dissolved oxygen on nitrates concentration in Zagreb aquifer. 8th Croatian-Hungarian and 19th Hungarian Geomathematical Congress, Geomathematics – present and future of geological modelling, Croatian Geological Society, Trakošćan, pp. 89–96.
- Lake, I. R., Lovett, A. A., Hiscock, K. M., Betson, M., Foley, A., Sunnenberg, G., … Fletcher, S. (2003). Evaluating factors influencing groundwater vulnerability to nitrate pollution: Developing the potential of GIS. Journal of Environmental Management, 68, 315–328. doi: 10.1016/S0301-4797(03)00095-1
- Larva, O., Marković, T., & Brkić, Ž. (2010). Groundwater hydrochemistry of the quaternary alluvial aquifer in Varaždin region – Croatia. XXXVIII IAH Congress (ISSN: 0208-6336), Groundwater Quality Sustainability, Krakow, 493–500.
- Li, S. L., Liu, C. Q., Lang, Y. C., Zhao, Z. Q., & Zhou, Z. H. (2010). Tracing the sources of nitrate in karstic groundwater in Zunyi, Southwest China: A combined nitrogen isotope and water chemistry approach. Environmental Earth Sciences, 60, 1415–1423. doi: 10.1007/s12665-009-0277-0
- Liu, A., Ming, J., & Ankumah, R. O. (2005). Nitrate contamination in private wells in rural Alabama, United States. Science of the Total Environment, 346, 112–120. doi: 10.1016/j.scitotenv.2004.11.019
- Marković, T., Brkić, Ž, & Larva, O. (2013). Using hydrochemical data and modelling to enhance the knowledge of groundwater flow and quality in an alluvial aquifer of Zagreb, Croatia. Science of the Total Environment 458–460, 508–516. doi: 10.1016/j.scitotenv.2013.04.013
- Mkandawire, T. (2008). Quality of groundwater from shallow wells of selected villages in Blantyre District, Malawi. Physics and Chemistry of the Earth, 33(8–13), 807–811. doi: 10.1016/j.pce.2008.06.023
- Nakić, Z., Posavec, K., Parlov, J., & Bačani, A. (2011). Development of the conceptual model of the Zagreb aquifer system. The geology in digital age. Proceedings of the 17th Meeting of the Association of European Geological Societies, MAEGS 17/Banjac, Nenad (ur.), Serbian Geological Society, Belgrade, pp. 169–174.
- Nakić, Z., Ružičić, S., Posavec, K., Mileusnić, M., Parlov, J., Bačani, A., & Durn, G. (2013). Conceptual model for groundwater status and risk assessment - case study of the Zagreb aquifer system. Geologia Croatica, 66(1), 55–76. doi: 10.4154/GC.2013.05
- Novak Zelenika, K., Cvetković, M., Malvić, T., Velić, J., & Sremac, J. (2013). Sequential indicator simulations maps of porosity, depth and thickness of Miocene clastic sediments in the Kloštar Field, Northern Croatia. Journal of Maps, 9(4), 550–557. doi: 10.1080/17445647.2013.829410
- Novak-Zelenika, K., Vidaček, R., Ilijaš, T., & Pavić, P. (2017). Application of deterministic and stochastic geostatistical methods in petrophysical modelling – a case study of Upper Pannonian reservoir in Sava depression. Geologia Croatica, 70, 105–114. doi: 10.4154/gc.2017.10
- Peña-Haro, S., Pulido-Velazquez, M., & Sahuquillo, A. (2009). A hydro-economic modelling framework for optimal management of groundwater nitrate pollution from agriculture. Journal of Hydrology, 373, 193–203. doi: 10.1016/j.jhydrol.2009.04.024
- Posavec, K. (2006). Identifikacija i prognoza minimalnih razina podzemne vode zagrebačkoga aluvijalnog vodonosnika modelima recesijskih krivulja [ Identification and prediction of minimum ground water levels of Zagreb alluvial aquifer using recession curve models] (PhD dissertation). University of Zagreb, Zagreb, Croatia, 89 p.
- Ružičić, S., Mileusnić, M., & Posavec, K. (2012). Building conceptual and mathematical model for Water flow and solute transport in the unsaturated zone at Kosnica Site. Rudarsko-geološko-naftni zbornik (0353-4529), 25, 21–31.
- Sahin, A., & Al-Salem, A. A. (2001). Stochastic modeling of porosity distribution in a multi-zonal Carbonate reservoir. Society of Petroleum Engineers, 68113, 1–11.
- Sokač, A. (1978). Pleistocene ostracode fauna of the Pannonian Basin in Croatia. Palaeontologia Jugoslavica, 21, 1–51.
- Sollitto, D., Romić, M., Castrignano, A., Romić, D., & Bakić, H. (2010). Assessing heavy metal contamination in soils of the Zagreb region (Northwest Croatia) using multivariate geostatistics. Catena, 80, 182–194. doi: 10.1016/j.catena.2009.11.005
- Velić, J., & Durn, G. (1993). Alternating lacustrine-marsh sedimentation and subaerial exposure phases during quaternary: Prečko, Zagreb, Croatia. Geologia Croatica, 46(1), 71–90.
- Velić, J., & Saftić, B. (1991). Subsurface spreading and facies characteristics of middle Peistocene deposits between Zaprešić and Samobor. Geološki Vjesnik, 44, 69–82.
- Velić, J., Saftić, B., & Malvić, T. (1999). Lithologic composition and stratigraphy of Quaternary sediments in the area of the “Jakuševec” waste depository (Zagreb, Northern Croatia). Geologia Croatica, 52(2), 119–130.