
 ?Mathematical formulae have been encoded as MathML and are displayed in this HTML version using MathJax in order to improve their display. Uncheck the box to turn MathJax off. This feature requires Javascript. Click on a formula to zoom.
ABSTRACT
Land cover–land use (LCLU) classification tasks can take advantage of the fusion of radar and optical remote sensing data, leading generally to increase mapping accuracy. Here we propose a methodological approach to fuse information from the new European Space Agency Sentinel-1 and Sentinel-2 imagery for accurate land cover mapping of a portion of the Lower Magdalena region, Colombia. Data pre-processing was carried out using the European Space Agency’s Sentinel Application Platform and the SEN2COR toolboxes. LCLU classification was performed following an object-based and spectral classification approach, exploiting also vegetation indices. A comparison of classification performance using three commonly used classification algorithms was performed. The radar and visible-near infrared integrated dataset classified with a Support Vector Machine algorithm produce the most accurate LCLU map, showing an overall classification accuracy of 88.75%, and a Kappa coefficient of 0.86. The proposed mapping approach has the main advantages of combining the all-weather capability of the radar sensor, spectrally rich information in the visible-near infrared spectrum, with the short revisit period of both satellites. The mapping results represent an important step toward future tasks of aboveground biomass and carbon estimation in the region.
1. Introduction
Land cover mapping has been recognized as a fundamental task for deriving information for scientific, environmental management and policy purposes at global, regional and local scales (CitationFeddema et al., 2005; CitationTurner, Lambin, & Reenberg, 2007). Information on the characteristics and use of land surface elements has proved crucial for environmental studies involving biogeochemical cycles, conservation and the management of natural resources, urban planning, food and health among others (CitationFritz et al., 2015; CitationGrimm et al., 2008; CitationMaxwell, Meliker, & Goovaerts, 2009; CitationOlson et al., 2001; CitationSterling, Ducharne, & Polcher, 2013). Remote sensing is the most significant technology for effective land cover mapping at large scales, bringing numerous advantages such as cost-effectiveness and repeatability of observations (CitationChilar, 2000; CitationKuemmerle et al., 2013). Mapping activities have widely exploited optical (e.g. CitationCohen & Goward, 2004; CitationFriedl et al., 2010; CitationGómez, White, & Wulder, 2016; CitationHansen et al., 2013) and radar (e.g. CitationEngdahl & Hyyppa, 2003; CitationMiettinen & Liew, 2011; CitationJin, Mountrakis, & Stehman, 2014; CitationWalker, Stickler, Kellndorfer, Kirsch, & Nepstad, 2010) satellite imagery for classification and the mapping of land cover–land use (LCLU).
Radar and optical remote sensing data deliver complementary information, hence land cover classification tasks can take advantage of the fusion of both data types leading generally to increase mapping accuracy (CitationBagan, Kinoshita, & Yamagata, 2012; CitationHerold & Haack, 2002). CitationErasmi and Twele (2009) used Landsat ETM+ and Envisat ASAR data for land cover mapping in Central Sulawesi, Indonesia. The authors found that SAR-based texture information combined with VNIR optical data led to an improved classification of vegetation. ALOS PALSAR and phenological information from the MODIS sensor were used by CitationQin et al. (2016) to map forests in Monsoon Asia using decision tree algorithms. L-band SAR helped in reducing the limitations of frequent cloud coverage and improved separability of evergreen shrubs and crops from forests. CitationGessner et al. (2015) mapped West African land cover by integrating optical MODIS, Envisat ASAR and TandemX/TerraSAR-X radar data using random forest classification (CitationBreiman, 2001) combined with a an unsupervised classification scheme exploiting texture measures and backscattering amplitudes. The classification approach led to an overall accuracy of 80%. In general terms, the main advantage of the integration of satellite and optical radar data for classification lies in the fact that by exploiting different physical principles they provide both multi-band spectral information and structural land cover properties to be synergistically combined (see CitationJoshi et al., 2016 for a comprehensive review of optical and radar data fusion for LCLU mapping).
With the development of the recent European Space Agency Sentinel-1, -2, -3 satellite constellation new opportunities open for Earth Observation. The constellation provide high operational ability, long-term continuity, superior calibration of sensors and a variety of sensing methods and products for the scientific community (CitationMalenovský et al., 2012). Also, Sentinel data distribution is supported by the key advantage of a full free and open access policy for the majority of the products (CitationBelward & Skøien, 2015). In this research we explored the integrated use of the recently launched Sentinel-1A and Sentinel-2A satellites for synergistic land cover mapping exploiting radar and optical data, for a case study in Colombia. The Sentinel-1 sensors provide C-band SAR images in single/dual polarization for a variety of acquisition modes (see CitationTorres et al., 2012 for detailed characteristics of the Sentinel-1 mission). Its combination of high spatial (5 × 20 m in the Interferometric Wide Swath mode), large coverage (up to 400 km) and improved temporal resolution are expected to provide new exciting possibilities for accurate land cover mapping (CitationWagner et al., 2012). Frequent revisit time is a major advantage over previous radar missions, especially for the mapping and analysis of phenological dynamics in vegetation and agricultural land covers, together with the dual polarization capability and rapid product delivery (CitationTorres et al., 2012).
The Sentinel-2 Multi-spectral Instrument (MSI) sensors provide radiometrically and geometrically superior multi-spectral high spatial resolution images over the global surface, at high revisit time (5 days at the Equator with two satellites in orbit) and a wide field of view covering 290 km with 13 bands in the optical NIR, SWIR parts of the electromagnetic spectrum (CitationDrusch et al., 2012). Major advantages of Sentinel-2 with respect to previous satellite derived products (e.g. Landsat series) are represented by richer spatial and spectral content together with improved operational capabilities (CitationPesaresi et al., 2016). For vegetation mapping Sentinel-2 is especially relevant for the presence of two new bands in the red edge spectrum, at 705 and 740 nm (CitationDelegido, Verrelst, Alonso, & Moreno, 2011). In other words, Sentinel-2′s unique combination of characteristics represents an unprecedented potential for land cover characterization and mapping at regional and global scales (CitationESA, 2012; CitationSpoto et al., 2012).
The main objective of this investigation is to derive a methodological framework to integrate Sentinel-1 and Sentinel-2 imagery for accurate land cover mapping by integrating the advantages of radar and optical imagery, using object-based and spectral classification techniques. The study was motivated by the need for both cost-effective and accurate land cover map production in a cloudy region (Colombian Andes), as part of an environmental characterization of the nationally funded project ‘Strategies for natural resources valuation and ownership as a climate change adaptation mechanism in the Lower Magdalena region, Colombia’.
2. Methods
2.1. Study area
The study area covers approximately 2095 km2, in the Lower Magdalena region within the Cundinamarca district in central Colombia (). Elevation ranges from 90 m a.s.l. of the north-western fluvial plains till 2570 m of the south-eastern mountain range. Yearly average temperature is 23.8°C, with averages varying from 27.1°C maximum of the low altitude plain till 16.9°C minimum of the upper areas. Average precipitations are 1973 mm/year, std. dev. 359 mm (CitationKarger et al., 2016). In the study area the warm western fluvial areas contiguous to the Magdalena River are dominated by managed grasslands and dry tropical forests. Moving eastwards the landscape becomes hilly and mountainous, reaching the Andean Cordillera Oriental, being characterized by secondary forests and degraded tropical mountain forests. At the east of the region, secondary vegetation and agricultural mosaics are the dominant land cover.
Figure 1. Study area (red polygon). Lower Magdalena region, Cundinamarca, Colombia.
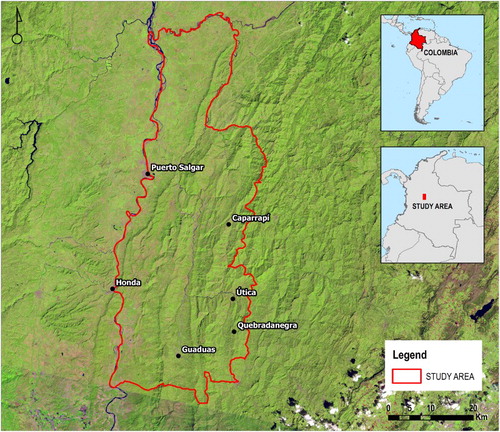
The study area includes five municipalities (Guaduas, Caparrapi, Quebradanegra, Utica and Puerto Salgar), whose economic activity is mainly based on livestock, and farming (especially sugar cane, coffee, bananas). Agricultural activities and cattle raising have produced marked landscape fragmentation in the region, a common characteristic of a large part of the Colombian Andes (CitationEtter, McAlpine, & Possingham, 2008). Field observations have revealed that land degradation is also quite common, due principally to illegal forest logging activities and fires lighted to open fields and to induce green re-sprouting to feed cattle. The study area was selected for its importance in the context of the regional economy and for the presence of rapidly developing unregulated land cover conversion dynamics; such land changes also make the territory especially vulnerable to climate change-induced natural hazards. The heterogeneous and complex environment is associated with cloudy conditions that require the use of an all-weather remote sensing technology, but additionally the use of optical-IR spectrally rich imagery in order to achieve satisfactory classification and mapping accuracy through the diverse socio-ecological gradients present.
2.2. Satellite imagery pre-processing
Two Sentinel 1A images (Level 1 product) and two Sentinel-2A images (Level 1C) covering the entire study area were downloaded from the ESA’s Sentinel Scientific Hub (CitationESA, 2016a). SAR data pre-processing of the Level-1 SLC image was performed using the SNAP Sentinel Application Platform toolbox (CitationESA, 2016b) standard processing methods (calibration, thermal noise removal, TOPSAR deburst, mosaicking), as well as resampling to 10 × 10 m2 spatial resolution and multilook parametrization for both VV and VH polarization images. Speckle effects, characteristic of radar images that influences the radiometric information, were compensated by the use of a Refined Lee low-pass filter with a 5 × 5 kernel, which averages the images while preserving feature edges (CitationWang, Ge, & Li, 2012). A Ground Range Detection (GRD) level product was produced from the Single Look Complex (SLC) level 1 image.
The ESA SEN2COR processor for was used for atmospheric and terrain correction of the Sentinel-2A Top-Of-Atmosphere Level 1C image (CitationESA, 2016c) to obtain a Level-2A BOA reflectance image. A bilinear interpolation-based re-sampling to 10 × 10 m2 spatial resolution was performed to bands 5, 6, 7 and 8a to achieve the same resolution of bands 2, 3, 4 and 8 and the re-sampled Sentinel-1A radar images. Both optical and radar images were terrain corrected using a 30 m resolution Shuttle Radar Topography Mission (SRTM) digital elevation model (CitationJarvis, Reuter, Nelson, & Guevara, 2008) and re-projected to UTM Zone 18, WGS84.
2.3. Land cover mapping
Ground surface texture, strongly influencing the radar image backscatter (CitationHerold et al., 2006), represents valuable information for classification tasks, and has been previously exploited in radar-based land cover mapping (e.g. CitationChand & Badarinath, 2007; CitationHaack & Bechdol, 2000; CitationHerold, Haack, & Solomon, 2004). Radar-derived texture measures were thus calculated using the SNAP grey-level co-occurring matrix (GLCM) module (texture variance and texture contrast, based on CitationHaralick, Shanmugat, & Dinstein, 1973) for both VV and VH polarization, parameterized with a 5 × 5 window size and 32 probabilistic quantization levels. As a result, we obtained four different texture images of the Sentinel-1A data.
Vegetation indices are parameters sensitive to photosynthetically active radiation and are commonly calculated from the spectral reflectance of two or more bands (CitationBannari, Morin, Huete, & Bonn, 1995). Importantly, they have been demonstrated to be effective variables for vegetation discrimination (CitationKarlson, Ostwald, Reese, Roméo Bazié, & Tankoano, 2016; CitationVaglio Laurin et al., 2016). Four vegetation indices were calculated for the Sentinel-2A reflectance image: the Normalized Difference Vegetation Index (NDVI; CitationRouse, Haas, Schell, Deering, & Harlan, 1974), the Sentinel-2 Red-Edge Position index (S2REP; CitationFrampton, Dash, Watmough, & Milton, 2013), the Green Normalized Difference Vegetation Index (GNDVI; CitationGitelson & Merzlyak, 1998), and the Modified Soil Adjusted Vegetation Index (MSAVI; CitationQi, Chehbouni, Huete, & Kerr, 1994). NDVI is a commonly used vegetation index in remote sensing, and it has been used extensively in land cover mapping (e.g. CitationRodrigues, Marcal, Furlan, Ballester, & Cunha, 2013; CitationUsman, Liedl, Shahid, & Abbas, 2015). Previous studies reported that land use classification can also generally benefit from the incorporation of information from the red-edge part of the electromagnetic spectrum (e.g. CitationRecio, Helmholz, & Muller, 2011; CitationSchuster, Förster, & Kleinschmit, 2012). The S2REP red-edge index is based on linear interpolation (following the method of CitationGuyot & Baret, 1988) by exploiting Sentinel-2A bands 5 and 6, both positioned on the red edge slope, at 705 and 740 nm respectively. The GNDVI exploits the green visible spectrum (540–570 nm), and apart from being more sensitive to chlorophyll concentration than NDVI, it is a good senescence and leaf hydric stress indicator (CitationGitelson & Merzlyak, 1998), a situation often occurring in the drier periods within the western plains of the study area. The MSAVI index was chosen to minimize the effect of bare soil, particularly present in the western fluvial plains, and additionally because of its minor susceptibility to atmospheric effects (CitationQi et al., 1994; CitationSaadat et al., 2011). Indices formulations and corresponding Sentinel-2A MSI bands are as follows:
where
, where s is the slope of the soil line from a plot in the RED-NIR space.
After layer normalization to same value range, layer stacking was performed by adding all the processed radar and optical image layers. Sentinel-2A bands 1,9,10 were excluded from layer stacking due to their sensitivity to aerosol and clouds (CitationESA, 2015) and spatial resolution (60 m). In summary resume, the following image layers were stacked into a 20-layers image:
Sentinel-1A VH and VV amplitude images (2)
Sentinel-1A VH and VV variance texture images (2)
Sentinel-1A VH and VV contrast texture images (2)
Sentinel-2A BOA reflectance bands 2 to 8a and 11 to 12 (10)
Sentinel-2A NDVI, S2REP, GNDVI, MSAVI images (4).
A set of land cover classes of interest were defined, namely: forests, secondary vegetation/shrubs, cropland, water, pastureland and built (comprising urban and paved roads). The land use-land cover categories were selected using common categories described in many studies, and functional to the project mapping task, that is, the identification of a small number of dominant LCLUs for which, in a second stage of the project, aboveground biomass will be estimated. Due to the high heterogeneity present within some land cover classes, especially cropland, we opted for a classification approach that also exploits land textural properties. An object-based classification (segmentation) was performed using eCognition® v.9.01 (CitationeCognition, 2016) by a user-supervised parameterization. Three steps represent the main operations performed: (i) image segmentation, (ii) generation of an image object hierarchy and (iii) classification (CitationBlaschke, Burnett, & Pekkarinen, 2005). In this approach ‘objects’ are defined exploiting topologic (neighborhood, context) and geometric (form, size) information. The identification of homogeneous land patches was carried out through a supervised iterative process by tuning parameters of scale, shape and compactness. Optimum segmentation was identified with scale = 20, shape = 0.8 and compactness 0.2. We then trained the object-based classifier by assigning a land cover class (labeling) to a set of 130 locations identified in Google Earth and a set of 30 field points (measured using a global positioning system receiver) collected in situ in Spring 2016. In order to evaluate the performance of different classification methods, we tested three different classification algorithms: Random Forest (CitationBreiman, 2001), Support Vector Machine (SVM) (CitationBurges, 1998) and k-Nearest Neighbors (k-NN) (CitationAltman, 1992) assigning the same weight to each layer of the 20-bands layer stack image. Additionally, to test the influence of the integrated radar–VNIR datasets, we applied the same classification algorithms to two layer stacks composed respectively by (i) the Sentinel 1A radar layers, and (ii) the Sentinel 2A VNIR layers. The estimation of the classification accuracy was performed based on a dataset composed by 160 field validation points. Thematic classification accuracy indices (overall, user, producer accuracy and Kappa coefficient) were then calculated. outlines the pre-processing and processing steps followed in this study.
Figure 2. Pre-processing and processing chain performed in this study (integrated radar–VNIR dataset).
The use of the radar stack layers and the VNIR stack layers separately did not produce acceptable results with any classifier. In contrast, the classification results showed that the SVM-classification algorithm applied to the integrated layer stack composed of both Sentinel radar and VNIR data outperformed the other configurations of classifiers and layer stacks (accuracy statistics in ), thus we discuss here detailed results only from this classification approach.
Table 1. Overall accuracy and kappa index for the SVM, Random Forests and k-NN classifications applied to the three dataset configurations used in the study.
Visual inspection of the object-oriented classification versus a natural color composite (Sentinel-2A) shows close-to-reality classified land cover patches. The integrated datasets SVM-classification map shows large extents of grasslands at the northern and western flat parts of the study area, a territory that is largely used for livestock (see Main Map). The eastern part of the study area is more heterogeneous, and characterized by a mosaic of croplands, shrubs and forests. Here the topography is more rugged thus less suitable to develop large fields for cattle raising. The dominant land cover in the study area is pastureland (860 km2), followed by forest (591 km2) and secondary vegetation/shrubs (476 km2). Following standard accuracy calculation procedures (CitationCongalton & Green, 2009), we estimated an overall accuracy of 88.75%, and a Kappa coefficient of 0.86. Omission and commission classification errors were found mainly in crops and secondary vegetation/shrubs, likely due to the high spectral heterogeneity present in both classes generated by the large variety of different cultivars and of vegetation types/growth stages, respectively. Nevertheless, no user and producer accuracy estimates were lower than 80% per class. A detailed confusion matrix of the integrated datasets SVM-classified map, with overall, user and producer class accuracies, is reported in .
Table 2. Confusion matrix and classification accuracy measures of the integrated datasets SVM-classified map.
4. Conclusion
The proposed LCLU classification approach using Sentinel-1A and Sentinel-2A data has two main advantages. First, the pre-processing chain supported by sensor-specific toolboxes developed by ESA represents a reliable and fast approach for the preparation of ready-to-process imagery. Second, the integration of texture and spectral information for an object-based classification produced satisfactory to very satisfactory accuracy results for all the LCLU classes considered. The inclusion of vegetation indices added important information for the discrimination between forests, secondary vegetation and crops. Although we are aware that a certain degree of redundancy by adding four vegetation indices is inherently present, we believe vegetation in heterogeneous environmental conditions, as in the study area, can be better detected using a set of different spectral indices. In this context the presence of red edge bands in the Sentinel-2 MSI imagery represents a significant spectral enrichment with respect to other commonly used sensors in LCLU mapping exercises.
A main advantage of using combined Sentinel-1 and -2 for LULC classification is the availability of data resulting from the all-weather capability of the active sensor, together with the short revisit period of both satellites (6 and 5 days at the equator with two operating satellites for the Sentinel-1 and -2 family, respectively). This is a major benefit in areas, such as the Andes, where the frequent and dense cloud cover represents a major problem in land cover mapping tasks.
A limitation of the classification approach used in this study is the supervised procedure used for the tuning operations of the parameters defining optimal object definition in eCognition, which limits the development of straightforward automatic processing tasks. On the other hand, it does represent a further step toward high accuracy classifications by taking into account more precisely site-specific land characteristics.
Further research will involve the analysis of the spectral discrimination potential of the Sentinel-1 and -2 sensors for the mapping of the diverse types of cultivars present in the region. Multi-temporal images can also offer a further area of research towards better discriminating and classifying temporally dynamic LULC classes, such as crops (CitationSchmidt, Pringle, Devadas, Denham, & Tindall, 2016).
Also, the LCLU mapping results, with the outcome of few, but accurately mapped, LCLU categories, represents an important step towards to the calculation of aboveground biomass and carbon content estimation for each LCLU category in the study area. This will be undertaken during a second project phase.
Software
Data pre-processing was performed with ESA Sentinel Application Platform toolbox (SNAP) for the Sentinel-1A data, and ESA SEN2COR processor for the Sentinel-2A imagery. Object-based classification was performed using the image segmentation suite eCognition v9.01. Map layout was carried out with ESRI ArcGIS 10.4.1.
MAP_R1.pdf
Download PDF (11.1 MB)Acknowledgements
We thank Marta Lucia Guardiola and Mauricio Valencia for insightful discussions on the study area.
Disclosure statement
No potential conflict of interest was reported by the authors.
ORCID
Nicola Clerici http://orcid.org/0000-0003-4547-7606
Juan Manuel Posada http://orcid.org/0000-0001-7794-9300
Additional information
Funding
Related Research Data
References
- Altman, N. S. (1992). An introduction to kernel and nearest-neighbor nonparametric regression. The American Statistician, 46(3), 175–185. doi: 10.1080/00031305.1992.10475879
- Bagan, H., Kinoshita, T., & Yamagata, Y. (2012). Combination of AVNIR-2, PALSAR, and polarimetric parameters for land cover classification. IEEE Transactions on Geoscience and Remote Sensing, 50(4), 1318–1328. doi: 10.1109/TGRS.2011.2164806
- Bannari, A., Morin, D., Huete, A. R., & Bonn, F. (1995). A review of vegetation indices. Remote Sensing Reviews, 13, 95–120. doi: 10.1080/02757259509532298
- Belward, A. S., & Skøien, J. O. (2015). Who launched what, when and why; trends in global land-cover observation capacity from civilian earth observation satellites. ISPRS Journal of Photogrammetry and Remote Sensing, 103, 115–128. doi: 10.1016/j.isprsjprs.2014.03.009
- Blaschke, T., Burnett, C., & Pekkarinen, A. (2005). Remote sensing image analysis: Including the spatial domain. Kluwer Academic Publishers, pp. 211–236. doi: 10.1007/978-1-4020-2560-0
- Breiman, R. E. (2001). Random forests. Machine Learning, 45, 5–32. doi: 10.1023/A:1010933404324
- Burges, C. J. C. (1998). A tutorial on support vector machines for pattern recognition. Data Mining and Knowledge Discovery, 2(2), 121–167. doi: 10.1023/A:1009715923555
- Chand, T. R. K., & Badarinath, K. V. S. (2007). Analysis of ENVISAT ASAR data for forest parameter retrieval and forest type classification – a case study over deciduous forests of central India. International Journal of Remote Sensing, 28(22), 4985–4999. doi: 10.1080/01431160701253295
- Chilar, J. (2000). Land cover mapping of large areas from satellites: Status and research priorities. International Journal of Remote Sensing, 21(6), 1093–1114. doi: 10.1080/014311600210092
- Cohen, W. B., & Goward, S. (2004). Landsat’s role in ecological applications of remote sensing. Bioscience, 54(2004), 535–545. doi: 10.1641/0006-3568(2004)054[0535:LRIEAO]2.0.CO;2
- Congalton, R. G., & Green, K. (2009). Assessing the accuracy of remotely sensed data, principles and practices (2nd ed.). London: CRC Press, Taylor & Francis Group.
- Delegido, J., Verrelst, J., Alonso, L., & Moreno, J. (2011). Evaluation of Sentinel-2 red-edge bands for empirical estimation of green LAI and chlorophyll content. Sensors, 11, 7063–7081. doi: 10.3390/s110707063
- Drusch, M., Del Bello, U., Carlier, S., Colin, O., Fernandez, V., Gascon, F., … Bargellini, P. (2012). Sentinel-2: ESA’s optical high-resolution mission for GMES operational services. Remote Sensing of Environment, 120, 25–36. doi:10.1080/014311600210092
- eCognition. 2016. Retrieved from http://www.ecognition.com/
- Engdahl, M., & Hyyppa, J. (2003). Land-cover classification using multitemporal ERS-1/2 InSAR data. IEEE Transactions on Geoscience and Remote Sensing, 41, 1620–1628. doi: 10.1109/TGRS.2003.813271
- Erasmi, S., & Twele, A. (2009). Regional land over mapping in the humid tropics using combined optical and SAR satellite data – a case study from Central Sulawesi, Indonesia. International Journal of Remote Sensing, 30 (10), 2465–2478.
- European Space Agency. (2012). Sentinel-2: ESA’s optical high resolution mission for GMES operational services (SP-1322/2). 70 pp.
- European Space Agency. (2015). Sentinel-1 userbook. European Space Agency. Retrieved May 2016, from https://sentinels.copernicus.eu/web/sentinel/user-guides/document-library/-/asset_publisher/xlslt4309D5h/content/sentinel-2-user-handbook
- European Space Agency. (2016a). Sentinel scientific hub. Retrieved May 2016, from https://scihub.copernicus.eu/dhus/#/home
- European Space Agency. (2016b). Sentinel application platform. Retrieved July 2016, from http://step.esa.int/main/toolboxes/snap
- European Space Agency. (2016c). Sen2Cor. Retrieved June 2016, from http://step.esa.int/main/third-party-plugins-2/sen2cor
- Etter, A., McAlpine, C., & Possingham, H. (2008). Historical patterns and drivers of landscape change in Colombia since 1500: A regionalized spatial approach. Annals of the Association of American Geographers, 98(1), 2–23. doi: 10.1080/00045600701733911
- Feddema, J. J., Oleson, K. W., Bonan, G. B., Mearns, L. O., Buja, L. E., Meehl, G. A., & Washington, W. M. (2005). The importance of land-cover change in simulating future climates. Science, 310, 1674–1678. doi: 10.1126/science.1118160
- Frampton, W. J., Dash, J., Watmough, G., & Milton, E. J. (2013). Evaluating the capabilities of Sentinel-2 for quantitative estimation of biophysical variables in vegetation. ISPRS Journal of Photogrammetry and Remote Sensing, 82, 83–92. doi: 10.1016/j.isprsjprs.2013.04.007
- Friedl, M. A., Sulla-Menashe, D., Tan, B., Schneider, A. M., Ramakutty, N., Sibley, A., & Huang, X. (2010). MODIS collection 5 global land cover: Algorithm refinements and characterization of new datasets. Remote Sensing of Environment, 114, 168–182. doi: 10.1016/j.rse.2009.08.016
- Fritz, S., See, L., McCallum, I., You, L., Bun, A., Moltchanova, E., … Obersteiner, M. (2015). Mapping global cropland and field size. Global Change Biology, 21, 1980–1992. doi: 10.1111/gcb.12838
- Gessner, U., Machwitz, M., Esch, T., Tillack, A., Naeimi, V., Kuenzer, C., & Dech, S. (2015). Multi-sensor mapping of West African land cover using MODIS, ASAR and TanDEM-X/TerraSAR-X data. Remote Sensing of Environment, 164, 282–297. doi: 10.1016/j.rse.2015.03.029
- Gitelson, A., & Merzlyak, M. (1998). Remote sensing of chlorophyll concentration in higher plant leaves. Advances in Space Research, 22, 689–692. doi: 10.1016/S0273-1177(97)01133-2
- Gómez, C., White, J. C., & Wulder, M. A. (2016). Optical remotely sensed time series data for land cover classification: A review. ISPRS Journal of Photogrammetry and Remote Sensing, 116, 55–72. doi: 10.1016/j.isprsjprs.2016.03.008
- Grimm, N. B., Faeth, S. H., Golubiewski, N. E., Redman, C. L., Wu, J., Bai, X., & Briggs, J. M. (2008). Global change and the ecology of cities. Science, 319, 756–760. doi: 10.1126/science.1150195
- Guyot, G., & Baret, F. (1988, January 18–22). Utilisation de la haute resolution spectrale pour suivre I’etat des couverts vegetaux. Paper presented at the proceedings, 4th international colloquium “Spectral Signatures of Objects in Remote Sensing”, Aussois, Paris, ESA, ESA, Publication SP-287, pp. 279–286.
- Haack, B., & Bechdol, M. (2000). Integrating multisensor data and radar texture measures for land cover mapping. Computers & Geosciences, 26, 411–421. doi: 10.1016/S0098-3004(99)00121-1
- Hansen, M. C., Potapov, P. V., Moore, R., Hancher, M., Turubanova, S. A., Tyukavina, A., … ChiniL, J. R. G. (2013). Townshend. High-resolution global maps of 21st century forest cover change. Science, 342(6160), 850–853. doi: 10.1126/science.1244693
- Haralick, R. M., Shanmugat, M. K., & Dinstein, I. (1973). Textural features for image classification. IEEE Transactions on Systems, Man, and Cybernetics, SMC-3(6), 610–621. doi: 10.1109/TSMC.1973.4309314
- Herold, N. D., & Haack, B. N. (2002). Fusion of radar and optical data for land cover mapping. Geocarto International, 17(2), 21–30. doi: 10.1080/10106040208542232
- Herold, N. D., Haack, B. N., & Solomon, E. (2004). An evaluation of radar texture for land use/cover extraction in varied landscapes. International Journal of Applied Earth Observation and Geoinformation, 5, 113–128. doi: 10.1016/j.jag.2004.01.005
- Herold, M., Woodcock, C., Di Gregorio, A., Mayaux, P., Belward A., Latham, J., & Schmullius, C. C. (2006). A joint initiative for harmonization and validation of land cover datasets. IEEE Transactions on Geoscience and Remote Sensing, 44 (7), 1719–1727.
- Jarvis, A., Reuter, H. I., Nelson, A., & Guevara, E. (2008). Hole-filled SRTM for the globe Version 4, available from the CGIAR-CSI SRTM 90 m Database. Retrieved from http://srtm.csi.cgiar.org
- Jin, H., Mountrakis, G., & Stehman, S. V. (2014). Assessing integration of intensity, polarimetric scattering, interferometric coherence and spatial texture metrics in PALSAR-derived land cover classification. ISPRS Journal of Photogrammetry and Remote Sensing, 98, 70–84. doi: 10.1016/j.isprsjprs.2014.09.017
- Joshi, N., Baumann, M., Ehammer, A., Fensholt, R., Grogan, K., Hostert, P., … Waske, B. (2016). A review of the application of optical and radar remote sensing data fusion to land use mapping and monitoring. Remote Sensing, 8, 70. doi: 10.3390/rs8010070
- Karger, D. N., Conrad, O., Böhner, J., Kawohl, T., Kreft, H., Soria-Auza, R. W., … Kessler, M. (2016). Climatologies at high resolution for the Earth land surface areas. arXiv:1607.00217 [physics].
- Karlson, M., Ostwald, M., Reese, H., Roméo Bazié, H., & Tankoano, B. (2016). Assessing the potential of multi-seasonal WorldView-2 imagery for mapping West African agroforestry tree species. International Journal of Applied Earth Observation and Geoinformation, 50, 80–88. doi: 10.1016/j.jag.2016.03.004
- Kuemmerle, T., Erb, K., Meyfroidt, P., Müller, D., Verburg, P. H., Estel, S., … Reenberg, A. (2013). Challenges and opportunities in mapping land use intensity globally. Current Opinion in Environmental Sustainability, 5(5), 484–493. doi: 10.1016/j.cosust.2013.06.002
- Malenovský, H. R., Cihlar, J., Schaepman, M. E., García-Santos, G., Fernandes, R., & Berger, M. (2012). Sentinels for science: Potential of sentinel-1, -2, and -3 missions for scientific observations of ocean, cryosphere, and land. Remote Sensing of Environment, 120, 91–101. doi: 10.1016/j.rse.2011.09.026
- Maxwell, S. K., Meliker, J. R., & Goovaerts, P. (2009). Use of land surface remotely sensed satellite and airborne data for environmental exposure assessment in cancer research. Journal of Exposure Science and Environmental Epidemiology, 20(2010), 176–185. doi: 10.1038/jes.2009.7
- Miettinen, J., & Liew, S. C. (2011). Separability of insular southeast Asian woody plantation species in the 50 m resolution ALOS PALSAR mosaic product. Remote Sensing Letters, 2, 299–307. doi: 10.1080/01431161.2010.520345
- Olson, D. M., Dinerstein, E., Wikramanayake, E. D., Burgess, N. D., Powell, G. V. N., Underwood, E. C., … Kassem, K. R. (2001). Terrestrial ecoregions of the world: A new map of life on Earth: A new global map of terrestrial ecoregions provides an innovative tool for conserving biodiversity. BioScience, 51(11), 933–938. e Change 3, 385–390. doi: 10.1641/0006-3568(2001)051[0933:TEOTWA]2.0.CO;2
- Pesaresi, M., Corbane, C., Julea, A., Florczyk, A. J., Syrris, V., & Soille, P. (2016). Assessment of the added-value of Sentinel-2 for detecting built-up areas. Remote Sensing, 8(4), 299. doi: 10.3390/rs8040299
- Qi, J., Chehbouni, A., Huete, A. R., & Kerr, Y. H. (1994). A modified soil adjusted vegetation index. Remote Sensing of Environment, 48, 119–126. doi: 10.1016/0034-4257(94)90134-1
- Qin, Y., Xiao, X., Dong, J., Zhang, G., Roy, P. S., Joshi, P. K., … Moore III, B. (2016). Mapping forests in monsoon Asia with ALOS PALSAR 50-m mosaic images and MODIS imagery in 2010. Scientific Reports, 6, 570. doi: 10.1038/srep20880
- Recio, J. A., Helmholz, P., & Muller, S. (2011). Potential evaluation of different types of images and their combination for the classification of GIS objects cropland and grassland. The Internat archives of the Photogramm, Remote Sens and Spatial Info Sc, 28-4/W19, 6pp. doi: 10.5194/isprsarchives-XXXVIII-4-W19-251-2011
- Rodrigues, A., Marcal, A. R. S., Furlan, D., Ballester, M. V., & Cunha, M. (2013). Land cover map production for Brazilian Amazon using NDVI SPOT VEGETATION time series. Canadian Journal of Remote Sensing, 39(4), 277–289. doi: 10.5589/m13-037
- Rouse, J. W., Haas, R. W., Schell, J. A., Deering, D. W., & Harlan, J. C. (1974). Monitoring the vernal advancement and retrogradation (Greenwave effect) of natural vegetation. NASA/GSFCT Type III Final Report, Greenbelt, MD, USA.
- Saadat, H., Adamowski, J., Bonnell, R., Sharifi, F., Namdar, M., & Ale-Ebrahim, S. (2011). Land use and land cover classification over a large area in Iran based on single date analysis of satellite imagery. ISPRS Journal of Photogrammetry and Remote Sensing, 66(5), 608–619. doi: 10.1016/j.isprsjprs.2011.04.001
- Schmidt, M., Pringle, M., Devadas, R., Denham, R., & Tindall, D. A. (2016). A framework for large-area mapping of past and present cropping activity using seasonal Landsat images and time series metrics. Remote Sensing, 8, 312. doi: 10.3390/rs8040312
- Schuster, C., Förster, M., & Kleinschmit, B. (2012). Testing the red edge channel for improving land-use classifications based on high-resolution multi-spectral satellite data. International Journal of Remote Sensing, 33, 5583–5599. doi: 10.1080/01431161.2012.666812
- Spoto, F., Sy, O., Laberinti, P., Martiort, P., Fernandez, V., Colin, O., … Meygret, A. (2012). Overview of Sentinel-2. IEEE International Geoscience and Remote Sensing Symposium, Munich, 2012, 1707–1710. doi: 10.1109/IGARSS.2012.6351195
- Sterling, S. M., Ducharne, A., & Polcher, J. (2013). The impact of global land-cover change on the terrestrial water cycle. Nature Climate Change, 3, 385–390. doi: 10.1038/nclimate1690
- Torres, R., Snoeij, P., Geudtner, D., Bibby, D., Davidson, M., Attema, E., … Rostan, F. (2012). GMES Sentinel-1 mission. Remote Sensing of Environment, 120, 9–24. doi: 10.1016/j.rse.2011.05.028
- Turner, B. L., II, Lambin, E. F., & Reenberg, A. (2007). The emergence of land change science for global environmental change and sustainability. Proceedings of the National Academy of Sciences, 104(52), 20666–20671. doi:10.1073/pnas.0800052105
- Usman, M., Liedl, R., Shahid, M. A., & Abbas, A. (2015). Land use/land cover classification and its change detection using multi-temporal MODIS NDVI data. Journal of Geographical Sciences, 25, 1479. doi: 10.1007/s11442-015-1247-y
- Vaglio Laurin, G., Puletti, N., Hawthorne, W., Liesenberg, V., Corona, P., Papale, D., … Valentini, R. (2016). Discrimination of tropical forest types, dominant species, and mapping of functional guilds by hyperspectral and simulated multispectral Sentinel-2 data. Remote Sensing of Environment, 176, 163–176. doi: 10.1016/j.rse.2016.01.017
- Walker, W. S., Stickler, C. M., Kellndorfer, J. M., Kirsch, K. M., Nepstad, D. C (2010). Large-area classification and mapping of forest and land cover in the Brazilian Amazon: A comparative analysis of ALOS/PALSAR and Landsat data sources. IEEE Journal of Selected Topics in Applied Earth Observation and Remote Sensing, 3(4), 594–604.
- Wagner, W., Sabel, D., Doubkova, M., Hornáček, M., Schlaffer, S., & Bartsch, A. (2012). Prospects of Sentinel-1 for land applications. IEEE International Geoscience and Remote Sensing Symposium, Munich, 1741–1744. doi: 10.1109/IGARSS.2012.6351184
- Wang, X., Ge, X., & Li, X. (2012). Evaluation of filters for Envisat ASAR speckle suppression in pasture area. ISPRS Annals of the Photogrammetry, Remote Sensing and Spatial Information Sciences, Volume I-7, 2012 XXII ISPRS Congress, 25 August–01 September 2012, Melbourne, Australia. doi: 10.5194/isprsannals-I-7-341-2012