
ABSTRACT
Flash floods are natural hazards that may last only a few hours, but their sudden onset often results in severe impacts on society and the environment. Therefore, efforts to reduce flash flood-related losses have primarily focused on the compilation of emergency operation plans (EOPs). Conversely, there have been only a few attempts to provide cartographic representations of EOPs in order to show the spatial context of crisis operations. In the present map and its commentary, we describe a pilot study of flash flood household labelling for use in emergency operations carried out in Chrastava town, Northern Czechia. Analyses of existing geographical databases, together with detailed field surveys, have been performed to map relevant characteristics of 1110 buildings in terms of their location, function, number of residents and degree of flood hazard, as well as the presence of flood-protection measures. The map sheet is composed of the main map (overview of flood extent and impacts) and three supplementary maps (technical and social vulnerability of buildings), and the map key is designed to facilitate strategic planning and directing of emergency operations in the study area.
1. Introduction
1.1. Flash floods and emergency management
Flash floods are natural hazards that are caused mainly by small-scale convectional rainstorms. Although they may last only a few hours, their sudden onset (in minutes to hours) often results in severe impacts on society and the environment. In addition to improvements in our knowledge of the frequency–magnitude relations (CitationGaume et al., 2009) of flash floods, as well as their forecasting (CitationMontz & Gruntfest, 2002; CitationŠálek, Březková, & Novák, 2006) and precautionary factors, a key avenue for reducing flash flood-related losses is the compilation of effective strategies for emergency management based on emergency operation plans (EOPs).
According to CitationAlexander (2005), an EOP is defined as a coordinated set of protocols for managing an adverse event, whether expected or unexpected, in the future. The list of structural components of EOPs varies, but institutional frameworks, hazard and risk zoning, emergency needs and resources, and the processes of dissemination, testing and revision are usually mentioned as the fundamental components (e.g. CitationAlexander, 2002; CitationLumbroso, Stone, & Vinet, 2011). Therefore, although EOPs are directly linked to general risk reduction strategies, their scope is more specifically aimed at particular frameworks and modes of behaviour that are relevant for a short interval immediately before, during and after a hazardous event. Although individual behaviour during emergencies increasingly includes self-help or community action, designing EOPs is traditionally strongly associated with public administrative bodies (CitationPetak, 1985). The disastrous riverine floods and flash flood events during the last few decades have resulted in the implementation of new risk reduction strategies on international scales, such as the European Floods Directive (CitationEC, 2007), and national scales, such as the Strategy for Protection Against Floods in the Czech Republic (CitationStrategie, 2000). These strategies call for creation of flood EOPs at regional and municipal scales, which, in turn, must comply with other legislative norms (e.g. laws addressing crisis management and public law). The design, completeness and implementation of EOPs differ strongly among countries, however.
Most importantly, the discrepancies between tasks undertaken during the process of emergency management, on one hand, and spatial representation of the area under risk, on the other, are apparent. CitationLumbroso et al. (2011) compared flood EOPs from England, Wales, France and the Netherlands and concluded that components of flood-risk receptors and evacuation strategies were the weakest components of the plans. At the same time, these components should be placed on a cartographic basis (or in a geographical database) to be effectively implemented as risk zones and evacuation routes in EOPs. CitationPiatyszek and Karagiannis (2012) suggested a new functional model for local EOPs, which have been designed since 2004 according to a new law in France, but they do not pay explicit attention to the creation of spatial databases. The situation in the United States of America is variable; while some towns have complemented their EOPs with cartographic representations of spatial data (e.g. CitationSurfside, 2013), others have created detailed process- and actor-based EOPs without reference to cartographic representations (e.g. CitationFairfax, 2015). Moreover, the official guide for EOPs published by the Federal Emergency Management Administration (CitationFEMA, 2009, Citation2010) does not require supplementing EOPs with the creation of flood-related geographical databases and their cartographic representations.
In Czechia, flood plans must be developed in all municipalities where floods may potentially occur. At present, the plans have been completed mainly for the large towns and some of the medium-sized towns (CitationMŽP ČR, Hydrosoft, 2016), and include both descriptions of emergency protocols and cartographic representations of flood zones, sites of hydrological monitoring, infrastructure-related flood-protection measures and evacuation sites. Most of the smaller towns that have fewer than 20,000 inhabitants where flash floods frequently occur do not have such plans, however. Moreover, similar to EOPs in other countries, data sets represented in the cartographic part are processed at a municipal level and do not provide information on local variations of characteristics at a household scale. Household labelling programmes are in their infancy and have only been carried out as pilot studies in a few towns in Czechia. Moreover, they focus only on houses affected during floods and do not include comprehensive geographical databases for emergency operations (CitationČeselský, 2011).
To sum up, even though CitationAlexander (2002) clearly argued for a cartographic basis for EOPs, and although there are examples of GIS-assisted emergency operations (CitationGunes & Kovel, 2000), there is a continued lack of research devoted to identifying suitable tools and methods for EOP-related flood-risk mapping. Simply put, many local EOPs say ‘what to do’, but do not indicate ‘where to do it first’. During rapidly developing hazardous events such as flash floods, such information is crucial, because any action must be structured according to spatially differentiated levels of risk, the spatial availability of emergency resources and possible societal responses to emergency efforts. For this reason, mapping of variables at a household level (household labelling) is essential as the resulting geographical database and its cartographic representation may provide a basis for fast decision-making about where to focus immediate help during flash floods (cf. CitationHaddow, Bullock, & Coppola, 2014).
1.2. The 2010 flash flood in Czechia
Several periods of extreme daily precipitation totals resulting in flash floods have been documented in Czechia since the late nineteenth century (CitationŠtekl et al., 2001). During the last several decades, the country has experienced an increased frequency of summer flash floods, which have had significant social and economic impacts (CitationDaňhelka & Šercl, 2011). The last of these events was the 2010 Central European flash flood, which also struck the northern part of Czechia, destroyed buildings and infrastructure, and required large amounts of resources for reconstruction. The flash flood occurred in two phases in August 2010 (6–8 August and 13–15 August) related to a shallow cyclone passing from the Mediterranean over Central Europe (CitationKašpar, Müller, & Pecho, 2013). The total losses in the northern part of Czechia were estimated to be 10bn Czech crowns (i.e. ∼370 m Euro), with the highest share spent on infrastructure (46.7%), water courses and hydrotechnical infrastructure (25.5%), and households (10.4%). Along with public losses, insurance companies received more than 11,000 claims, with 61% of insurance settlements occurring immediately after the flash flood (CitationVÚV, 2010).
Among the places most affected was Chrastava town (; 50°49'00″, N 14°58'00″E), where total rainfall between 6 and 8 August reached almost 240 mm. The town is situated in Northern Czechia along the Jeřice River and has a population of ∼6200 inhabitants on a total area of ∼27 km2. The catchment of the Jeřice River collects water from the forested NW slopes of the Jizerské hory Mts., where an average annual precipitation varies between 700 and 800 mm. The river then runs through a built-up valley within a slightly undulating agricultural landscape to join the Lužická Nisa River in the Chrastava town. The town itself belongs to the metropolitan area of the Liberec town (∼100,000 inhabitants), which represent an economic centre of a national importance and a destination for daily commuters (CitationŠašek, 2016; CitationŽenka, Pavlík, & Slach, 2017). Although the town has experienced several flash floods in the last several centuries (), the 2010 flash flood was extreme and had an estimated recurrence interval of Q > 100 years at the Jeřice River (CitationVÚV, 2010; ; ). The severity of the flash flood was also due to the presence of several points of surface runoff concentration within the territory of the town. The total losses in Chrastava town were estimated to be 789 m Czech crowns (i.e. ∼29 m Euro) and the flash flood resulted in emergency operations with extensive evacuations. The traffic connection between the right bank of the Jeřice River and the regional road was hindered, and several critical infrastructure elements were under direct threat. Although it was possible to manage the emergency operations according to the regional EOP, the 2010 flash flood event highlighted the lack of detailed EOPs at the municipal and household levels. In particular, it can be shown, through the comparison of data made by different authorities for different purposes (), that coherent spatial information about flash flood hazard and risk is absent for the town. Based on the experiences from 2010 event, the main aim of the present research was to propose a pilot flash flood household labelling system that would include the creation of a geographical database and its cartographic visualization for the purposes of emergency operations planning at the municipal level of Chrastava town. Along with creating a geographical database, our aim was to evaluate suitable variables that could be included in household labels to provide the necessary basic information for emergency operations, while keeping the geographical database flexible and easy to update.
Figure 1. Study area – central cadastres of Chrastava town. Critical points of surface runoff concentration during flash floods are drawn from the Czech flood information system (CitationMŽP ČR, Hydrosoft, 2016; CitationVÚV, 2009).
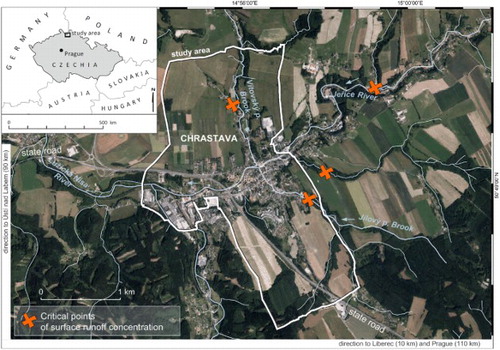
Figure 2. Historical occurrence of flood events (black; after CitationVydra, 1995), flood-triggering extreme precipitation events (grey; after CitationŠtekl et al., 2001) and the recent 2010 flash flood (red) in the study area.
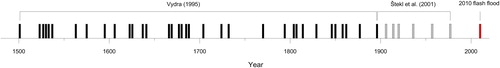
Figure 3. Hydrograph for the 2010 August flash flood in Chrastava town (based on data of Czech Hydrometeorological Institute).
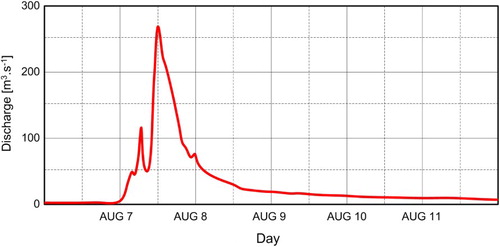
Figure 4. Comparison of the Q100 flood extent from a pre-2010 hydrological model according to T. G. Masaryk Water Research Institute (A), the extent of flood-prone areas according to the Czech Association of Insurance Companies (B), and the 2010 flood extent according to the Digital Flood Portal of the Liberec Region (C).
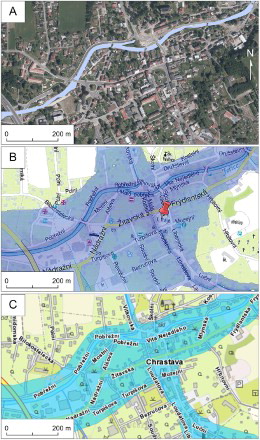
Table 1. Discharges at the gauging station of Jeřice River in the Chrastava town. Note: Qa − annual average discharge Qmax − culmination discharge during the 2010 flash flood. (Data compiled from Czech Hydrometeorological Institute.)
2. Methods and map design
When assessing vulnerability and resilience to flash floods, the selection of suitable variables is crucial to ensure their relevance for key purposes, such as risk assessment, vulnerability mapping and emergency operations. The purpose, in turn, implies the necessity for concurrent updating of the data as well as an appropriate scale. CitationCutter et al. (2008) have developed a set of community resilience indicators that are relevant for their disaster resilience of place model, including indicators of adaptive capacity that account for ecological, social, economic, institutional, infrastructure and community competence factors. The broad scope of these indicators may often create difficulties in obtaining and updating accurate data on community and household scales, however. Moreover, only some of the listed indicators may be considered relevant for the rapid action envisioned by EOPs.
The list of variables in the present study was designed to comply with two criteria: (i) thematic relevance for the response stage of emergency management (CitationHaddow et al., 2014), and (ii) the availability and accessibility of data to municipal authorities. First, the thematic dimension of variables was defined to indicate (i) local variations in characteristics of the population and built structures (physical vulnerability, e.g. CitationKelman & Spence, 2004) and (ii) local accessibility of emergency services. Second, the availability, accessibility, and spatial determinability of data for variables fundamental for vulnerability studies was checked (see CitationAdger, 2000; CitationBirkmann, 2006; CitationCutter, 1996; CitationHufschmidt, 2011 for reviews) within the two previously mentioned dimensions. Combining these criteria, we started with the broader set of variables mentioned in the literature and then checked for their relevance during the reconnaissance of the study area and for their availability in official data sources. The final list of variables shown in was composed into a passport card further used during the detailed field inventory survey. The classification scheme for the variables is shown in and in Map supplement). In terms of data updating, the majority of attributes (variables) for each building may be derived from publicly accessible registries, based on the legislative obligation to report any changes in personal status (e.g. permanent place of residence), as well as modifications made to structures, to municipal authorities. Similarly, constructing any new building, which will therefore represent a possible object for flash flood labelling, must be declared to local municipal authorities (see for the frequency of updating). The only attributes that must be provided by the field survey are smaller flood-protection measures and a photograph of the object after modifications or of a new object.
Table 2. List of variables used in household flood labelling for EOP purposes.
Table 3. Classification scheme for variables of the household labelling.
For the purposes of this pilot study, flash flood household labelling was carried out for the central parts of Chrastava town (area of 5.8 km2), which were most affected during the 2010 flash flood. The basic spatial data were obtained from ZABAGED data (Fundamental Base of Geographical Data) derived from digitized 1:10,000 topographic maps and available as shapefiles (SHP, ESRI shapefile) from the Czech State Administration of Land Surveying and Cadastre. All maps are realized in Krovak EN projection (special projection used for the territory of former Czechoslovakia), which has been transformed by rotation to north for final design of the Map supplement. We used the GCS_S_JTSK Coordinate System. For orientation purposes, North arrow is used in orthophotomaps, while in other maps we used the geographical grid. The following spatial thematic data were used. (a) Roads were represented as polylines, (b) individual buildings were represented as polygons and (c) water courses were represented as polylines. The spatial accuracy of the data and their completeness were checked using aerial photos with a pixel size of 10 cm taken in 2014–2015 (CitationSeznam.cz, 2015). After completion of the basic spatial data set in ESRI ArcGIS 10.x, the buildings were assigned unique IDs corresponding to their numbers in the official registry and assigned attributes according to . Afterwards, the field survey was performed to cross-check the variables and take a photo of each of the buildings. All variables and photos have been input as attributes into the geographical database and the summary results have been analysed using descriptive statistics. While the geographical database was intended to be used primarily during emergency operations, the cartographic representation was prepared in ESRI ArcGIS 10.x and Adobe Creative Suite 6 (Photoshop, Illustrator and InDesign) to provide a supportive and informational tool for members of the public and decision makers at the municipal level. Another reason was that municipal authorities in Czechia are still not familiar with the use of GIS tools. According to the flood household labelling variables, the cartographic representations of the study area were prepared (Map supplement), which focused on (i) technical vulnerability to flash floods and (ii) social vulnerability to flash flood, including data on population under risk and accessibility of emergency services. Because the map key for crisis management is still not standardized in Czechia (CitationKonečný, Zlatanova, & Bandrova, 2010), the colour setting and the use of visual variables (CitationBertin, 1967) for basic characteristics have been newly proposed.
The main orthophotomap (i) at the scale of 1:5000 represents buildings in the area of Chrastava town and distinguishes between buildings in/outside the study area. Furthermore, the raster filling indicates buildings affected by 2010 flood and flood-protection measures. On the map are also seen maximal limits of the 2010 flood and modelled flood zones (Q100, Q20, and Q5 based on CitationDIBAVOD, 2017). The three supplementary maps at the scale of 1:7500 use the following representations. The first supplementary map (ii) primarily reflects the characteristics of the built structures, using fill colour hues to differentiate the functions of buildings, while various materials (or construction types) are represented by outline colour hues. The colour hues are based on principles of connotation and association. On the second supplementary map (iii), a colour system using two single-hue sequential colour scales according to CitationBrewer (1994) shows the flood-risk areas (colour scale of violet) and numbers of families (colour scale of yellow). On the third supplementary map (iv), the intensity of filling colour indicates number of families and the traffic light rating system indicates accessibility.
3. Map commentary
The flash flood household labelling was performed for 1110 buildings within the central parts of Chrastava town (Map supplement), including buildings occupied by individuals and families and buildings used by companies and public services. Of all labelled buildings, 39% are not permanently inhabited and serve as seats of companies, authorities, recreational facilities, services, other technical facilities or are empty (codes B01, B02 and B07–B11 in ). The majority (54%) of inhabited buildings are represented by family houses with one family only, which may pose an issue because of higher cumulative transportation distances during emergency operations. On the other hand, 36% of buildings of those inhabited by more than one family are located in two major flood-risk zones near the town’s centre. Construction material of the buildings is dominated by brick (85%), which has a moderate vulnerability curve in terms of its loss-inundation depth relation (cf. CitationGodfrey, Ciurean, vanWesten, Kingma, & Glade, 2015; CitationHolub & Hübl, 2008). Timber (wooden) buildings, which are most vulnerable in terms of instabilities due to inundations, represent 6% of labelled objects, but they are mostly used only for recreation. On the other hand, 8% of the buildings are concrete or concrete-reinforced structures, which have higher stability during flood events.
Although three years have passed since the catastrophic 2010 flash flood, after which many damaged buildings must have been destroyed, the field survey identified only 16 (1.5%) buildings with a new, individual flood-protection construction, such as walls and fences. This indicates that, although flood-protection measures may decrease monetary flood losses by as much as 80% (CitationGrothmann & Reusswig, 2006), the adoption of private mitigation measures drives at a low coping appraisal in local population in terms of costs and benefits of flood-protection measures (cf. CitationRaška, 2015). At the same time, more than 18% of buildings are located in the first, and another 14% are located in the second, most threatened hazard occupation zone, according to the Czech Association of Insurance Companies. Critical infrastructure (elementary schools and municipal offices), which serve as centres for crisis operations and relief, are also located in the second most threatened hazard occupation zone. The occupation of hazard zones may be illustrated by the abundance of buildings (46%) in the area which was flooded during the catastrophic 2010 flash flood.
The accessibility of emergency services was classified into three categories depending on closures of roads due to flash floods and based on the connection of local roads and town’s streets to regional roads. In this respect, more than 67% of buildings are highly affected (class 3) by flash floods, due to the closure of easily traversed automobile routes. This is mostly because of their location on the right bank of the Jeřice River, which has no direct connection to regional roads and must rely on long road detours. Of the buildings in class 3, households in family houses are most frequent. To sum up, 47% of buildings with the lowest accessibility are located in the two most threatened occupation zones. Moderate effects on traffic accessibility in the whole study area are reported in 14% of cases, and 19% of buildings are located in areas accessible even during flash flood events. In 3% of all cases, buildings represent a source of pollutants released from companies and small businesses (e.g. car repair facilities and factories − the sources were determined according to the economic specializations of firms).
4. Conclusions
Current experiences involving catastrophic flash floods in Central Europe indicate that EOPs are far from fully effective if they do not provide a spatial context for emergency operations. In this paper, a pilot study of household labelling for flood emergency operation purposes in Chrastava town (Northern Czechia) was presented. The detailed mapping of social and technical characteristics and the occupation of flood hazard zones at a household level enabled us to create a geographical database and cartographic visualizations for emergency operations and decision-making related to flash flood-related planning. The selection of variables was performed to meet the necessary standards of accuracy and relevance for vulnerability mapping, while keeping in mind that updating must be possible with the limited resources available to municipal offices. In further work, the semi-automatic process of data acquisition and updating from national registries should be tested to facilitate the process of flash flood household labelling in other municipalities to complement municipal and regional EOPs.
Software
The geographical database was created in ESRI ArcGIS 10.x and the data sets were in geodatabase format. Cartographic representations (map output) were produced using ESRI ArcGIS 10.x and Adobe Creative Suite 6 (Photoshop, Illustrator and InDesign).
Data
The topographic digital data underlying the field survey and GIS processing were provided as shapefiles created by digitization of 1:10,000 topographical maps (ZABAGED; Czech State Administration of Land Surveying and Cadastre).
Map: Household labelling for flash flood emergency management (Chrastava town, Northern Czechia)
Download PDF (8 MB)Acknowledgements
The administration of Chrastava municipality is acknowledged for discussion on emergency management design. Language Editing Services provided revisions to the language and style.
Disclosure statement
No potential conflict of interest was reported by the authors.
Additional information
Funding
Related Research Data
References
- Adger, W. N. (2000). Social and ecological resilience: Are they related? Progress in Human Geography, 24, 347–364. doi: 10.1191/030913200701540465
- Alexander, D. (2002). Principles of emergency planning and management. Hertfordshire: Terra.
- Alexander, D. (2005). Towards the development of a standard in emergency planning. Disaster Prevention and Management: An International Journal, 14, 158–175. doi: 10.1108/09653560510595164
- Bertin, J. (1967). Sémiologie graphique: Les diagrammes – Les Réseaux – Les Cartes. Paris: Mouton.
- Birkmann, J. (2006). Measuring vulnerability to natural hazards: Towards disaster resilient societies. Tokyo: United Nations University Press.
- Brewer, C. A. (1994). Color use guidelines for mapping and visualization. In A.M. MacEachren & D.R.F. Taylor (Eds.), Visualization in modern cartography (pp. 123–147). Oxford: Pergamon.
- Česelský, J. (2011). Passportization in context of sustainable management of municipal housing and flat resources. (in Czech). Ostrava: Technical university in Ostrava.
- Cutter, S. L. (1996). Vulnerability to environmental hazards. Progress in Human Geography, 20, 529–539. doi: 10.1177/030913259602000407
- Cutter, S. L., Barnes, L., Berry, M., Burton, C., Evans, E., Tate, E., & Webb, J. (2008). A place-based model for understanding community resilience to natural disasters. Global Environmental Change, 18, 598–606. doi: 10.1016/j.gloenvcha.2008.07.013
- Daňhelka, J., & Šercl, P. (2011). Floods in the Czech Republic in 2010 (in Czech). Meteorologické zprávy, 64, 4–9.
- DIBAVOD. (2017). Digital basis of hydrological data (in Czech). VÚV T.G.M., Prague. Retrieved from http://www.dibavod.cz/17/geodatabaze-dibavod.html
- EC. (2007). Directive on the assessment and management of flood risks. Brussels: European Community.
- Fairfax. (2015). Fairfax County Emergency Operations Plan. Retrieved from www.fairfaxcounty.gov/oem/emergency-operations-plan.htm
- FEMA. (2009). Basic emergency operations planning: Emergency operations basic plan template. Washington: National Preparedness Directorate (NPD).
- FEMA. (2010). Developing and Maintaining Emergency Operations Plans. Washington: National Preparedness Directorate (NPD). Retrieved from www.fema.gov/media-library/assets/documents/25975
- Gaume, E., Bain, V., Bernardara, P., Newinger, O., Barbuc, M., Bateman, A., … Viglione, A. (2009). A compilation of data on European flash floods. Journal of Hydrology, 367, 70–78. doi: 10.1016/j.jhydrol.2008.12.028
- Godfrey, A., Ciurean, R. L., vanWesten, C. J., Kingma, N. C., & Glade, T. (2015). Assessing vulnerability of buildings to hydro-meteorological hazards using an expert based approach – An application in Nehoiu Valley, Romania. International Journal of Disaster Risk Reduction, 13, 229–241. doi: 10.1016/j.ijdrr.2015.06.001
- Grothmann, T., & Reusswig, F. (2006). People at risk of flooding: Why some residents take precautionary action while others do not. Natural Hazards, 38, 101–120. doi: 10.1007/s11069-005-8604-6
- Gunes, A., & Kovel, J. (2000). Using GIS in emergency management operations. Journal of Urban Planning and Development, 126(3), 136–149. doi: 10.1061/(ASCE)0733-9488(2000)126:3(136)
- Haddow, G., Bullock, J., & Coppola, D. P. (2014). Introduction to emergency management. Waltham: Butterworth-Heinemann.
- Holub, M., & Hübl, J. (2008). Local protection against mountain hazards – state of the art and future needs. Natural Hazards and Earth System Science, 8, 81–99. doi: 10.5194/nhess-8-81-2008
- Hufschmidt, G. (2011). A comparative analysis of several vulnerability concepts. Natural Hazards, 58, 621–643. doi: 10.1007/s11069-011-9823-7
- Kašpar, M., Müller, M., & Pecho, J. (2013). Comparison of meteorological conditions during May and August 2010 floods in Central Europe. AUC Geographica, 48(2), 27–34. doi: 10.14712/23361980.2015.2
- Kelman, I., & Spence, R. (2004). An overview of flood actions on buildings. Engineering Geology, 73, 297–309. doi: 10.1016/j.enggeo.2004.01.010
- Konečný, M., Zlatanova, S., & Bandrova, T. L. (2010). Geographic information and cartography for risk and crisis management: Towards better solutions. Springer: Berlin.
- Lumbroso, D., Stone, K., & Vinet, F. (2011). An assessment of flood emergency plans in England and Wales, France and the Netherlands. Natural Hazards, 58, 341–363. doi: 10.1007/s11069-010-9671-x
- Montz, B. E., & Gruntfest, E. (2002). Flash flood mitigation: Recommendations for research and applications. Global Environmental Change Part B: Environmental Hazards, 4, 15–22. doi: 10.1016/S1464-2867(02)00011-6
- MŽP ČR, Hydrosoft Veleslavín. (2016). Povodňový informační systém. Retrieved from www.povis.cz
- Petak, W. J. (1985). Emergency management: A challenge for public administration. Public Administration Review, 45, 3–7 . Special issue: Emergency management: A challenge for public administration. doi: 10.2307/3134992
- Piatyszek, E., & Karagiannis, G. M. (2012). A model-based approach for a systematic risk analysis of local flood emergency operation plans: A first step toward a decision support system. Natural Hazards, 61, 1443–1462. doi: 10.1007/s11069-011-0079-z
- Raška, P. (2015). Flood risk perception in Central-Eastern European members states of the EU: A review. Natural Hazards, 79, 2163–2179. doi: 10.1007/s11069-015-1929-x
- Šálek, M., Březková, L., & Novák, P. (2006). The use of radar in hydrological modeling in the Czech Republic – case studies of flash floods. Natural Hazards and Earth System Sciences, 6, 229–236. doi: 10.5194/nhess-6-229-2006
- Šašek, M. (2016). Population development and its typology in the Czech Republic at the level of micro-regions. GeoScape, 10, 53–61. doi: 10.1515/geosc-2016-0005
- Seznam.cz. (2015). Retrieved from Mapy.cz. www.mapy.cz
- Štekl, J., Brázdil, R., Kakos, V., Jež, J., Tolasz, R., & Sokol, Z. (2001). Extreme daily precipitation on the territory of the Czech Republic in the period 1879-2000 and their synoptic causes. (in Czech). Praha: Národní klimatický program České republiky 31.
- Strategie. (2000, April 19). Strategy of protection against floods in the Czech Republic. (in Czech). Resolution of the parliament no. 382.
- Surfside. (2013). Town of Surfside Emergency Management Plan and Procedures. Retrieved from www.townofsurfsidefl.gov
- VÚV. (2009). Methodical procedure for identification of critical points. (in Czech). Prague: VÚV T.G.M.
- VÚV. (2010). Evaluation of floods in 2010. (in Czech). Prague: VÚV T.G.M. and Ministry of Environment.
- Vydra, F. (1995). Chrastava: Chapters from the history of the town and its surrounding. (in Czech). Chrastava: Public Authority.
- Ženka, J., Pavlík, A., & Slach, O. (2017). Resilience of metropolitan, urban and rural regions: A central European perspective. GeoScape, 11, 25–40. doi: 10.1515/geosc-2017-0003