
ABSTRACT
The aim of this paper is to illustrate the history of one of the world's greatest multi-stage bicycle races, the Tour de France, by mapping all the stage finish places from the first race in 1903 to the present. On the one hand, there is a long list of places that the Tour de France has visited just once in its whole history, but on the other, there are also several places that different editions include fairly regularly. Since the Tour de France is one of the most watched sports events on the planet, spatial variability is a good means for promoting the different regions of France and the surrounding countries where individual stages have been held. The organisation of individual editions does not depend on the existence of purpose-built sports stadiums but makes use of the existing infrastructure and settlement structure that have developed over long periods. By showing the finish places, we are able to capture not only the frequency of the inclusion of the places in the race, but also show the success of cyclists from different countries at each stage finish and thus identify the countries that have historically been most successful at winning stages.
1. Introduction
The first edition of the Tour de France multi-stage bicycle race took place in 1903. This event established the tradition of cyclists competing in gruelling multi-stage races. Apart from intervals during the First and Second World Wars, the event has been held continuously since then and the 103rd edition took place in 2016. From its beginning, it has been a major event for more than just the world of sport. The Tour de France is one of the world’s most important sporting events and also a global social phenomenon. It has undergone many changes over its long life, reflecting the technological, organisational and social characteristics of different periods. From the very beginning, the Tour de France received great attention from both cycling enthusiasts and the general public. The diversity of views on this sports event can be seen in the many works that have been written about it in different fields. The spatial character of the race, which is also the focus of the present paper, is discussed in the works of CitationBoury (1997), CitationFumey (2006), CitationCampos (2003) and CitationReed (2007). The authors of these works focus largely on the race itself and its effect on the space where it takes place. An evaluation of the long history of the race requires study of the work of CitationMcGann and McGann (2006, Citation2008), and CitationMignot (2014, Citation2016a, Citation2016b) as well as works published to mark the centenary of the race by authors such as CitationDauncey and Hare (2003), CitationWheatcroft (2005) and CitationWhittle (2003). There are, of course, many other perspectives for analysing this event. One of the most controversial aspects of the Tour de France is the issue of doping. Detailed discussions of this problem can be found in CitationSchneider (2006), CitationMignon (2003) and CitationAndreff (2016). Another interesting area is the evaluation of cyclists’ performance from the viewpoint of medicine and sports training. Interesting works in this area include CitationSaris, van Erp-Baart, Brouns, Westerterp, and Ten Hoor (1989), CitationLucia, Hoyos, Carvajal, and Chicharro (1999, Citation2003, Citation2004), CitationMarijon et al. (2013) and CitationVogt et al. (2007). Another interesting question is the local impact of the Tour de France on specific locations where the race has taken place. This has been addressed in works by CitationBull and Lovell (2007), CitationSmith (2009) and CitationCollins, Munday, and Roberts (2012). The social question of the local population’s view of the Tour de France in affected areas is discussed in CitationBalduck, Maes, and Buelens (2011), whose work studies local inhabitants’ perception of the race before and after it takes place. The Tour de France has a significant impact on the local economic development of the areas that it passes through, and is also influential at the global level. Authors who reflect on this issue include CitationDesbordes (2007, Citation2008) and CitationBerridge (2012), who emphasise the connection between the Tour de France and international tourism. Comprehensive view in the history of this sport and its social, cultural and economic aspects is captured in CitationReed (2015).
This brief review of the literature indicates that the Tour de France interests researchers in many fields. Such interest is to a significant extent prompted by the long history of the race, which covers several important periods in the development of Europe and the way the tour currently reflects the trends of the modern information age. The pomp and fascinating character of the Tour de France attract interest far beyond the race’s home nation and it has become a global event.
2. Research objectives
The previous section mapped out several areas in which the Tour de France has been studied. One of the interesting approaches for geographers is to look at the spatial dimension of the event in terms of the variability of the venues chosen for the stages in the itineraries of different editions and the success that cyclists from different countries have achieved in the event. The space in which the Tour de France takes place is different each year. This is a fundamental difference from other sports events, which are always held in existing sports venues. In the history of this event dating back more than a century, there have been more than 2000 stages, and nearly every one of them can be considered unique in terms of the results achieved and its spatial organisation. The long history of Tour de France itineraries includes many stage venues and mountain climbs whose inclusion has had a strong impact on the character of the race. On the one hand, there is a long list of places that the Tour de France has visited just once in its whole history, but on the other, there are also several places that different editions include fairly regularly. Since the Tour de France is one of the most watched sports events on the planet, changing its spatial organisation is a good means of promoting the different regions of France and the surrounding countries where individual stages have been held. The main aim of the present paper is to illustrate the long history of the Tour de France from its inception to the present (Main Map). The challenge is to map the history of an event where the organisation of individual editions does not depend on the existence of purpose-built sports stadiums but makes use of the existing infrastructure and settlement structure that have developed over long periods. We decided to capture this long history by displaying all the places that had been chosen as stage finish places. The benefit of choosing finish rather than start places is that it can also record the successes of individual cyclists from various countries at different stage finishes and thus show the history of the most successful countries in terms of their number of stage wins. This spatial representation of the history of the sporting event is non-typical and may prove inspirational for researchers in various fields of sport and other activities in which the spatial aspect is an important part of their organisation.
3. Methods
A key condition for the creation of the resulting map (Main Map) was the acquisition and subsequent effective processing of the results of stages from all the editions of the Tour de France to date, of which there were 103 between 1903 and 2016. We acquired this information from official material published on the website www.letour.fr (Le Tour de France – Guide Historique), which we then compared with other websites dedicated to the history of the Tour de France (www.lagrandeboucle.com, www.bikeraceinfo.com, www.tourfacts.dk). We decided that the most suitable way to save the data was to use a database (created in MS Access and then transferred to a MySQL database on a server for online presentation). The tables of the database were designed to allow us to save the largest quantity of relevant data on each stage. (So far there have been 2215 stages including prologues and time trials; 5 stages were cancelled.) The organisation of the database tables is shown in .
Figure 1. Basic structure of database tables in the program MS Access.
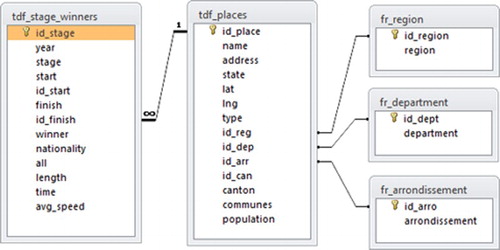
The chosen structure of tables allowed SQL queries to be used to answer all the necessary questions whose answers we wanted to display on the map (). The location data on the finish places entered in the tables included not only the necessary geographical coordinates (latitude, longitude) but also the French administrative units that they belong to at each level (regions, departments, arrondissements). This information was used in aggregating data on the regional level (see Conclusions). The geographical coordinates of each location were obtained via Google’s geocoding service.
Table 1. Example of a question and the corresponding SQL syntax for displaying the answer.
After entering the necessary information into the database, the SQL language was used to determine the number of stage wins of cyclists from each country at each finish place from the total of 462 finish places identified. These counts were then paired with the towns in MS Excel using the VLOOKUP function. The results were represented on the map in the form of structured circle diagrams whose size corresponded to the total number of stage finishes at a given location and whose sectors represented the stage victories of cyclists from different countries.
3.1. Supporting web page
Primary data collection enabled the construction of a very rich database on the history of the Tour de France. Since a print map provided limited space to display the acquired data, we decided to present our results in an online environment. For this purpose, we created a webpage that can be accessed at www.stagefinishes.tdfrance.eu. The relevant data are stored in a MySQL database and displayed on the client page via a PHP script. Map outputs on the page use the D3 library and write spatial data using the TopoJSON format (underlying country map). The graphical visualisation of data on the page was carried out using the HTML-Graphs tool developed by Gerd Tengler and Google Visualization Tools. The online presentation also allows clients to set a time period as the basis for a personalised map of stage finish places.
4. Conclusions
Before we take a look at the final map of stage finish places, it is important to make a few remarks about the history of this race that will help to reveal a strategy of selecting stage finish places. An important fact is that the Tour de France has always been owned by a private company, so it is understandable that the efforts of the creators have been concentrated on maximum profits. According to CitationReed (2003), the Tour was probably often in deficit from the late 1930s until the mid-1970s. Technological progress in the field of television broadcasting has brought significant turnover. The first TV broadcast of the Tour de France occurred in 1948 when the arrival at the velodrome of the Parc des Princes was put on air live. The role of television and its importance in terms of revenue has constantly increased. In the early 1980s broadcasting rights represented less than 10% of the total turnover; now they represent more than two-thirds of it. Television broadcasting has also enriched the Tour de France indirectly, by making cities and sponsors willing to pay more and more to gain access to a wider, globalised audience. Nowadays, the Tour’s turnover is mainly composed of television broadcasting rights (70% of the total turnover), while advertising and sponsoring (25%) and city contributionsFootnote1 (5%) are far less important sources of the Tour’s revenues (CitationMignot, 2016b). These days, the Tour is one of the world’s largest sports events, with approximately 10–15 million spectators on the roads per year and over 20 million TV viewers worldwide per racing day (CitationAndreff, 2016).
The resulting map illustrates the more than one-hundred-year history of the Tour de France by displaying the finish places and the successes of cyclists from different countries in these towns (Main Map). Data on 462 finish places were collected. At this point, it should be noted that the map is based only on official data on stage venues published in historical material. This means that the stage finish places do not include, for example, Chalet Reinard, where a stage of the most recent edition of the tour (edition 2016) ended due to bad weather although the original target was Mont Ventoux. Our map records the official stage finish place, Mont Ventoux. Given the large number of stages (2210) and the long-time period, it would be very difficult to check retrospectively for equivalent cases where the stage finish place was modified. When we look at the long-term trends in the statistics on the Tour de France, it is possible to identify two areas in which there have been significant changes. One of the notable features of the tour’s first period from 1903 to 1939 was the degree of stability in the stage finish places, which had a strong influence on the overall ranking of stage venues over the whole period of the study (1903–2016). The success of individual nationalities is affected by the dominance of French cyclists in the starting list of the race.
Regarding the spatial perspective, the key period for stable finish places was the period from the beginning in 1903 to the start of the Second World War (1939). During this period, towns with 10 or more stage finishes accounted for a third of all stage finishes. As stated above, this period laid the foundation for some of the stable stage venues to the present. Out of a total of 24 stage finish places that hosted more than 10 stage finishes in the period 1903–1939, 17 of them are in the overall top 25 places. During the history of the race there has been a sharp change in the overall philosophy governing the selection of finish places. While in the early years, the routes were almost identical (as regards finish places), it gradually became the trend to make large modifications in the route each year and this affected the number of stage finish places included in the race itinerary. We illustrate this by comparing three main periods () The first period is defined as 1903–1939 (a total of 80 finish places). This period can be described as a period of relative stability in the finish places, which were placed close to France’s national borders and implemented the race’s objective of setting a course ‘around’ France. As regards the success of the different nations in stage wins, French cyclists are clearly dominant, winning nearly half of all the stages that took place. This is naturally linked to the structure of the starting list, in which domestic cyclists made up the absolute majority of participants. The remainder were countries where cycling had a strong base and tradition: Belgium, Italy, Spain and the Netherlands. Overall in this period, winning cyclists came from just nine countries. The other five countries were Luxembourg, Switzerland, Germany and Austria.
Figure 2. Representation of finish places of the Tour de France in selected periods.
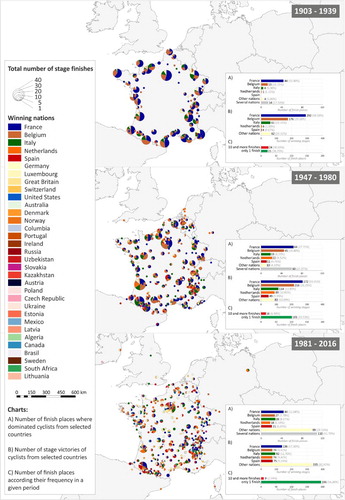
In the period after the Second World War, there was a sharp increase in the number of stage finishes (231 destinations in total). This period also saw greater spatial differentiation in the finish places and the itinerary for individual years increasingly included locations in the interior of the country. There was a sharp increase in the number of places that were featured only once within the period (101 finish places, whereas in the first period, there were only 21 such finish places). France remained the dominant country in terms of stage wins (272), followed by Belgium (216). In this period, there were 13 countries that won at least 1 stage. In this period Great Britain, Ireland, Portugal, AlgeriaFootnote2 and Denmark joined the ranks of winning countries. According to CitationMignot (2014) there are two main reasons why the situation in the selection of stage finish places was changed between these two periods (1903–1939 and 1947–1980):
as the Tour organisers paid for riders’ hotels and accommodations, they preferred to visit the inland because these expenses were cheaper there than they were in regions closer to France’s borders
one of the Tour’s main sources of revenue was cities’ payments. So cities were willing to pay them the most money; and many cities in the inland of France paid money, because for them the Tour was one of the few occasions to get some advertisement and tourists.
The largest increase in finish place locations and the diversity of countries on the winner’s rostrum took place in the last period (1981–2016).
In Graph A, the value ‘Several nations’ means that no single country is dominant in terms of the number of wins at the given finish place. This could happen, for example, if a town was used as a finish place three times and each time a cyclist from a different country won so that all countries were tied with one win.
As we can see, there is a noticeable spatial variability of the Tour de France stage finishes. Some standard stage finish places from the past are rarely included in the itinerary today. Conversely, some places are gaining increasing popularity, and their inclusion in the itinerary is regular. Examples of the former are some of the traditional stage finishes from the introductory period (1903–1939) which were at the forefront of the frequency of their inclusion as stage finishes at the Tour de France, and which are rarely found in the itinerary nowadays. Such examples are Brest and Belfort. Both places belonged to a staggered stage finishes in the first period, but the last visits of the Tour de France were registered in 1974 and 1978 respectively. An interesting example is the town of Evian, where 12 of the 13 stages were in the first period (and yet the last stage finish was in 1979). An example of the latter category is mountain resorts, which are attractive from a racing and spectator point of view as well, and they are an essential part of the Tour de France. The Alpe d’Huez ski resort has become the second most frequent stage finish place (just after Paris) in the last surveyed period. A similar example is mountain finishes with a distinct spectator scene (Mont Ventoux, Luz Ardiden).
Now let us take a brief look at the aggregate statistics for the various regions of France.Footnote4 From the main map, we can see that stage finish places cover the whole of France, but not evenly. There are some dominant regions in terms of the number of visits received ().
Figure 3. Visits to individual regions of France during the long history of the Tour de France (1903–2016).
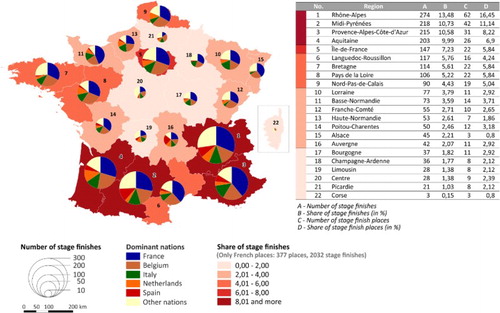
The most visited regions were those with a mountainous character. The mountain stages have a strong influence on the character of routes and the regular annual visits to climb in the Alps and Pyrenees greatly increase the share of visits received by these regions (Rhône-Alpes, Midi-Pyrénées). The Aquitaine region has a high number of stage finishes because of the historically important destinations of Bordeaux, Pau and Bayonne. There is a similar explanation for the region Provence-Alpes-Côte-d’Azur, which has not only important alpine centres but the common destinations of Marseille and Nice. The lowest share of all regions is in Corsica, because the Tour has visited this island region only once, in 2013, when three stages took place there. Referring to , we can observe the basic dimension of the dominance of cyclists from the most successful countries in the individual regions. Are there also some specificities within the dominance of certain states in specific stage places which are visible? The answer to this question significantly affects the composition of the starting list, especially in the first monitored period. The dominance of cyclists from France, Italy and Belgium was unambiguous in the first survey period, and thus the number of victories in individual cities was tilted towards these countries. Another important factor is the typology of riders who won the stage. In this case, this is clearly a factor unrelated to the nationality of a cyclist. (We can see good climbers, as well as sprinters, in all nations. Despite these factors, we can see some historical specifics about the success of countries in individual finish places. The home environment is a great motivation for athletes in similar events. In the case of Tour de France, we can see a certain connection, for example, in the stages finishing in Belgium. Out of a total 72 Belgian stages, 22 of them were won by Belgian cyclists. It is the most victories among all nations. (French cyclists have dominated 18 times). An even better example is Italy, where the number of ending stages is relatively low (12), but also here the Italian cyclists are dominant; they have won six stages. From the point of view of rider typology, a similar link is seen between the successes of Italian and Spanish cyclists. They have a larger share of victories in the Alps and Pyrenees (Midi-Pyrénées, Rhône-Alpes, Provence-Alpes-Côte d’Azur regions), which confirms their position as ‘climbers’. It is worth mentioning another well-known fact here. The Alpe d’Huez alpine centre is an important place for the success of Dutch cyclists. Up to now there were 29 stages here, with Dutch cyclists winning eight times (all victories won in 1976-1989; 8 triumphs out of a total of 13). Despite the long-time gap since the last triumph, thanks to this period of dominance, the climb on the Alpe d’Huez gained the nickname ‘Dutch mountain’.
As the world’s oldest multi-stage bicycle race, the Tour de France has a special standing in the world of sport. Its history is inextricably linked with the achievements of the cyclists who take part in this prestigious event each year. This part of its history is emphasised in the quantity of specialist and popular articles and books that have been dedicated to this important sports event. Our paper is an attempt to record this history through a map of the stage finish places that have made a major contribution to this race’s status in the sporting world. Every finish place (and the whole route of the stage passing through many towns) can be considered a special sort of sports arena, in which many cyclists from different countries have celebrated their success. The Tour de France is a global phenomenon that is also interesting from the geographical point of view because of the space in which it takes place. This space will continue to grow if the annual discussions on the where to hold the race’s ‘Grand Départ’ are any indication. It is becoming increasingly common for it to take place abroad (out of the last 5 editions, 3 had their start abroad – Liege (2012, Leeds (2014) and Utrecht (2015)) and this has helped to raise the race’s profile outside France.
This spatial diversity is observable thanks to the success of the Tour de France brand. Attempts by cities to use the race for their own promotion are obvious. Despite the fees for hosting stage places (start-up towns pay 50,000 Euros, finish places are charged 80,000 Euros)Footnote5, the benefits for cities are not only direct, which are related to the actual implementation of the race (overnight stays of cyclists, organisers, journalists and spectators, souvenir shopping, eating and drinking, etc.) but also indirect. These include the promotion of the region through television broadcasting in more than 180 countries worldwide, media promotion on TV, radio and the Internet in connection with the implementation of the Tour de France in the locality as well as a number of accompanying events directly or indirectly related to the event. The influence of the event on the population is also significant, in terms of the positive promotion of cycling not only as a race but also as a leisure activity. The Tour de France continues to develop in every dimension (sport, technology, logistics etc.) and it therefore deserves great attention from many academic fields. Geography is one of the disciplines that can bring a unique perspective to bear on the topic and its long history by, for example, mapping important historic moments and their spatial context.
Software
When creating our map, we used the ArcGIS 10.1 for all necessary changes. The final version of the map was then modified in CorelDraw X7.
Final map
Download PDF (22.4 MB)Acknowledgements
We would like to express our very great appreciation to Mrs Catherine Dimmock-Benko, external teacher at the Department of Languages, for her willingness to provide the linguistic correction of this paper.
Disclosure statement
No potential conflict of interest was reported by the authors.
ORCID
Vladimír Bačík http://orcid.org/0000-0001-6883-9863
Michal Klobučník http://orcid.org/0000-0002-7253-2992
Additional information
Funding
Notes
1 From the early 1950s to the late 1970s, contributions of the host cities were around 30–40% of the total turnover (Mignot Citation2016b).
2 In 1950 Marcel Molines won stage 13. At that time, Algeria was a colony of France, but the nationality of Marcel Molines was declared as Algerian, so Molines is the first cyclist born in Africa to win a stage of the Tour de France.
3 Information is taken from the page: https://cyclingtips.com/2016/06/eyes-in-the-sky-how-the-tour-de-france-is-broadcast-to-the-world/.
4 To give more detailed results, we have used the original 27 regions, which 2016 reforms reduced to 18 (including territories outside France).
5 An interesting example of financial effectiveness is the Grand Départ. According to Economische impact Le Grand Départ du Tour de France 2010, the city of Rotterdam invested €12million to attract the 2010 Grand Départ, but its own research suggests the city secured a €35–40 million return on their investment, with a total of 1million visitors, all hotels in the Rotterdam region booked for a week solid, 800 campers, and massive worldwide TV exposure.
Related Research Data
References
- Amaury Sport Organisation and Jacques Augendre. (2017). Le Tour de France. Guide historique. Retrieved January 12, 2017, from http://netstorage.lequipe.fr/ASO/cyclisme/le-tour/2017/histoire/TDF17_GH_Interactif-PROD.pdf
- Andreff, W. (2016). The Tour de France: A success story in spite of competitive imbalance and doping. In D. Van Reeth, & D. J. Larson (Eds.), The economics of professional road cycling (pp. 233–255). London: Springer International Publishing.
- Balduck, A. L., Maes, M., & Buelens, M. (2011). The social impact of the tour de France: Comparisons of residents' Pre- and post-event perceptions. European Sport Management Quarterly, 11(2), 91–113. doi: 10.1080/16184742.2011.559134
- Berridge, G. (2012). The promotion of cycling in London: The impact of the 2007 Tour de France Grand Depart on the image and provision of cycling in the capital. Journal of Sport & Tourism, 17(1), 43–61. doi: 10.1080/14775085.2011.635018
- Boury, P. (1997). La France du Tour: Le Tour de France, un espace sportif à géographie variable. Paris: Editions L'Harmattan.
- Bull, C., & Lovell, J. (2007). The impact of hosting major sporting events on local residents: An analysis of the views and perceptions of Canterbury residents in relation to the Tour de France 2007. Journal of Sport & Tourism, 12(3–4), 229–248. doi: 10.1080/14775080701736973
- Campos, C. (2003). Beating the bounds: The Tour de France and national identity. The International Journal of the History of Sport, 20(2), 149–174. doi: 10.1080/09523360412331305673
- Collins, A., Munday, M., & Roberts, A. (2012). Environmental consequences of tourism consumption at major events. Journal of Travel Research, 51(5), 577–590. doi: 10.1177/0047287511434113
- Dauncey, H., & Hare, G. (2003). The Tour De France 1903-2003: A century of sporting structures, meanings and values. London: Routledge.
- Desbordes, M. (2007). A review of the economic impact studies done on the Tour de France: Methodological aspects and first results. International Journal of Sport Management and Marketing, 2(5–6), 526–540. doi: 10.1504/IJSMM.2007.013965
- Desbordes, M. (2008). The future of the Tour de France: From an independent style of organization to a Formula One model. In S. Chadwick, & D. Arthur (Eds.), International cases in the business of sport (pp. 358–371). London: Elsevier.
- Fumey, G. (2006). Le Tour de France ou le vélo géographique. Annales de Géographie, 115, 388–408. doi: 10.3406/geo.2006.21447
- Lucia, A., Hoyos, J., Carvajal, A., & Chicharro, J. L. (1999). Heart rate response to professional road cycling: The Tour de France. International Journal of Sports Medicine, 20(3), 167–172. doi: 10.1055/s-2007-971112
- Lucia, A., Hoyos, J., Perez, M., Santalla, A., Earnest, C. P., & Chicharro, J. L. (2004). Which laboratory variable is related with time trial performance time in the Tour de France? British Journal of Sports Medicine, 38(5), 636–640. doi: 10.1136/bjsm.2003.008490
- Lucia, A., Hoyos, J., Santalla, A., Earnest, C., & Chicharro, J. L. (2003). Tour de France versus Vuelta a Espana: Which is harder? Medicine and Science in Sports and Exercise, 35(5), 872–878. doi: 10.1249/01.MSS.0000064999.82036.B4
- Marijon, E., Tafflet, M., Antero-Jacquemin, J., El Helou, N., Berthelot, G., Celermajer, D. S., … Jouven, X. (2013). Mortality of French participants in the Tour de France (1947–2012). European Heart Journal, 34(40), 3145–3150. doi: 10.1093/eurheartj/eht347
- McGann, B., & McGann, C. (2006). The story of the Tour de France Volume 1: 1903-1964: How a newspaper promotion became the greatest sporting event in the world. Indianapolis: Dog Ear Publishing.
- McGann, B., & McGann, C. (2008). The story of the Tour de France, Volume 2: 1965-2007: How a newspaper promotion became the greatest sporting event in the world. Indianapolis: Dog Ear Publishing.
- Mignon, P. (2003). The Tour de France and the doping issue. The International Journal of the History of Sport, 20(2), 227–245. doi: 10.1080/09523360412331305703
- Mignot, J. F. (2014). Histoire du Tour de France. Paris: La Decouverte.
- Mignot, J. F. (2016a). The history of professional road cycling. In D. Van Reeth, & D. J. Larson (Eds.), The economics of professional road cycling (pp. 7–31). London: Springer International Publishing.
- Mignot, J. F. (2016b). An economic history of the Tour de France, 1903-2015. In R. Pomfret, & J. K. Wilson (Eds.), Sports through the Lens of economic history (pp. 55–70). Cheltenham: Edward Elgar Publishing.
- Reed, E. (2003). The economics of the tour, 1930–2003. In H. Dauncey, & G. Hare (Eds.), The Tour de France, 1903–2003. A century of sporting structures, meanings and values (pp. 103–127). Abingdon: Routledge.
- Reed, E. (2007). The Tour de France in the provinces: Mass culture and provincial communities’ relations with the broader world. French Historical Studies, 30(4), 651–684. doi: 10.1215/00161071-2007-011
- Reed, E. (2015). Selling the Yellow Jersey: The Tour de France in the Global Era. Chicago: University of Chicago Press.
- Saris, W. H. M., van Erp-Baart, M. A., Brouns, F. J. P. H., Westerterp, K. R., & Ten Hoor, F. (1989). Study on food intake and energy expenditure during extreme sustained exercise: The Tour de France. International Journal of Sports Medicine, 10(1), S26–S31. doi: 10.1055/s-2007-1024951
- Schneider, A. J. (2006). Cultural nuances: Doping, cycling and the Tour de France. Sport in Society, 9(2), 212–226. doi: 10.1080/17430430500491272
- Smith, A. (2009). Using major events to promote peripheral urban areas: Deptford and the 2007 Tour de France. In J. Ali-Knight, M. Robertson, A. Fyall, & A. Ladkin (Eds.), International perspectives of festivals and events: Paradigms of analysis (pp. 3–19). London: Elsevier.
- Vogt, S., Schumacher, Y. O., Roecker, K., Dickhuth, H. H., Schoberer, U., Schmid, A., & Heinrich, L. (2007). Power output during the Tour de France. International Journal of Sports Medicine, 28(9), 756–761. doi: 10.1055/s-2007-964982
- Wheatcroft, G. (2005). Le Tour: A history of the Tour De France. London: Simon & Schuster UK.
- Whittle, J. (2003). Le Tour: A century of the Tour de France. London: MBI.
- Internet sources:
- www.bikeraceinfo.com
- www.colorbrewer2.org
- www.cyclingtips.com/2016/06/eyes-in-the-sky-how-the-tour-de-france-is-broadcast-to-the-world/
- www.kenniscentrumsport.nl/publicatie/?economische-impact-le-grand-depart-du-tour-de-france-2010-rotterdam&kb_id=14633&kb_q=
- www.lagrandeboucle.com
- www.letour.fr
- www.tourfacts.dk