
 ?Mathematical formulae have been encoded as MathML and are displayed in this HTML version using MathJax in order to improve their display. Uncheck the box to turn MathJax off. This feature requires Javascript. Click on a formula to zoom.
ABSTRACT
The paper presents the map of intrinsic groundwater vulnerability of the Isonzo/Soča High Plain, which is located between the Collio Hills and the Classical Karst Region and holds an aquifer shared between Italy and Slovenia. The map, produced at a scale of 1:25,000 and printed in A0 format, was obtained by means of the SINTACS method and shows the intrinsic vulnerability of the aquifer in terms of seven vulnerability classes, from extremely high to low. It is accompanied by four supplementary sketches that illustrate the geological framework, the bedrock top surface, the groundwater flow paths, the Hazard Index map and three diagrams that summarize the percentages of vulnerability classes and of Hazard Index classes of the study area.
1. Introduction
The Isonzo/Soča High Plain is located on the eastern side of the Friuli Venezia Giulia Region, straddling the border between Italy and Slovenia. It holds a significant phreatic aquifer that represents an important natural wealth, in terms of quantity, quality and ease of supply (CitationZini et al., 2013). The aquifer is used for drinking, household, industrial, and agricultural purposes. The increasing interest of the local administrations, private water suppliers and the resident population using this important resource gave rise to the ‘GEP’ and ‘ASTIS’ Projects (CitationBisaglia et al., 2014; CitationZini et al., 2014a). As part of these projects, this research focuses on the evaluation of the intrinsic vulnerability of the Isonzo/Soča aquifer that can be used as a tool to safeguard the groundwater resource and support environmental protection and management policies. The intrinsic vulnerability of aquifers is defined as the specific susceptibility of aquifer systems to ingest and diffuse fluid or/and hydro-vectored contaminants, whose impact on the ground water quality is a function of space and time (CitationCivita, 1994, Citation2010). The vulnerability of an underground water body depends on the hydro-lithology and hydro-structure of the hydrogeological system, the nature of soil and overburden, its recharge, groundwater inflow-outflow processes, the physical and hydro-geochemical processes that produce natural quality of water and the attenuation of the contaminants affecting the system (CitationCivita & De Maio, 2000).
Moreover, this work aims to improve the existing researches (CitationCucchi et al., 1999; CitationCucchi, Massari, Oberti, & Piano, 2002) with new and updated data and with the integration with the Slovenian part of the aquifer.
2. Study area
The Isonzo/Soča is an alpine river 138 km long that runs from the Julian Alps (source: southern side of Mt. Travnik, Slovenia, 990 m a.s.l.) to the North Adriatic Sea (mouth: near Monfalcone, Italy) ((a)). Except along the sector between Tolmin and Gorizia, where the river flows over carbonate rocks ((a)), the Isonzo/Soča riverbed consists of a thick fluvioglacial and alluvial cover (CitationD'Ambrosi & Mosetti, 1972).
Figure 1. (a) Geographical setting of the Isonzo/Soča River; (b) Geological map of the Isonzo/Soča High Plain and surroundings (redrawn from CitationBuser, 1968; CitationCarulli, 2006; CitationJurkovšek et al., 2016).
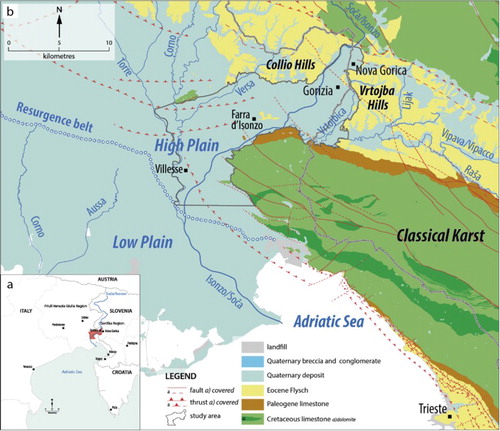
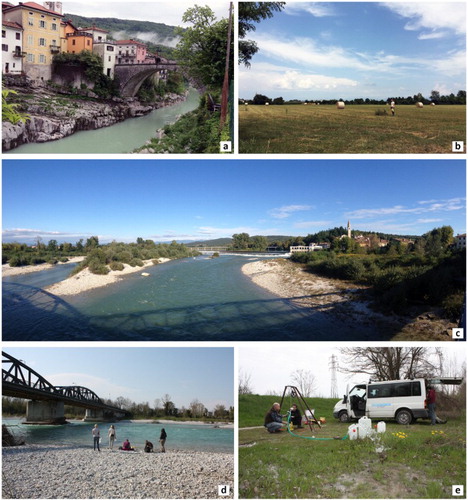
Figure 2. (a) the Isonzo/Soča river in its northern sector, where it flows over carbonate rocks (Kanal ob Soči, GO, SLO); (b) view of the High Plain (San Pier d’Isonzo, GO, ITA); (c,d) the Isonzo/Soča river in the High Plain and water monitoring (Poggio Terza Armata, GO, ITA); (e) pumping test at Turriaco (GO, ITA).
The study area extends for about 150 km2, taking in the southern stretch of Isonzo/Soča, from the outlet on the plain, north of Gorizia, to the aqueduct pumping wells at San Pier d’Isonzo ((b)).
The Isonzo/Soča High Plain represents the easternmost part of the Friuli Plain, which hosts several aquifers composed of thick Eocene- to Quaternary-aged gravel and sand beds interbedded with clay and silty layers (CitationCucchi, Franceschini, & Zini, 2008 and references therein) and is bounded to the north by the Collio (ITA) and Vrtojba (SLO) hills ((b)), made up of marlstones and sandstones belonging to the Eocene Flysch Formation (CitationVenturini & Tunis, 1991). To the South it is bounded by the limestones and dolomites belonging to the Cretaceous–Paleogene carbonate platform of the Classical Karst Region (CitationJurkovšek et al., 2016). Quaternary sediments constitute the Isonzo/Soča and Torre megafans, large fan-shaped landforms that were formed during the Last Glacial Maximum as a result, respectively, of the drainage of the Isonzo/Soča (CitationBavec, Tulaczyk, Mahan, & Stock, 2004) and Tagliamento glaciers (CitationFontana et al., 2014). The megafans show a longitudinal sedimentary differentiation with a strong contrast between the proximal sector, where gravels prevail and the distal one, where fine-grained sediments dominate (CitationFontana, Mozzi, & Bondesan, 2008).
The Resurgence Belt divides the Isonzo/Soča Plain into the High and the Low Plain. The High Plain consists mainly of coarse and very permeable sediments, related to the above-mentioned Isonzo/Soča and Torre rivers, as well as other minor streams such as Judrio and Versa. These sediments hold a phreatic aquifer. Rivers dissipate a great amount of water during their way across the High Plain and for this reason the Torre and Judrio rivers remain dry for most of the year while the Isonzo/Soča loses about 26% of its discharge (CitationZini et al., 2013). These river losses, together with the rain and runoff waters coming from the hills, recharge the phreatic aquifer of the High Plain. Towards the Low Plain, the phreatic aquifer joins with a multi-layered aquifer system characterized by alternating gravel-sand and clay–silt deposits (CitationStefanini & Cucchi, 1976). The gradual decrease in permeability southwards constrains the outflow of the High Plain phreatic waters in correspondence to the Resurgence Belt ((b)).
The study area includes 23 municipalities (20 in Italy and 3 in Slovenia). On the Italian side, the groundwater is tapped and distributed by two main aqueducts (Irisacqua and AcegasApsAmga) that supply more than 300.000 citizens of the provinces of Gorizia and Trieste. On the Slovenian side the groundwater is used for domestic and agricultural purposes.
There are more than 1550 wells in the alluvial deposits, of which 31.8% are domestic, 23.5% have an unknown use, 15% are industrial, 6.8% are used for agricultural and irrigation purposes, 5.4% supply drinking water and aqueducts, 0.5% are used for fish breeding and 3% are geognostic boreholes while the remaining 14% are for various other applications. The overall withdrawal amounts to about 2 m3/s.
3. Materials and methods
The first step for the production of the intrinsic vulnerability map was the assessment of the climatic and hydrogeological settings.
The average yearly effective precipitation (Pe) was calculated by means of the equation:where Er is the yearly average effective evapotranspiration (CitationTurc, 1954) and P the yearly average precipitation. A 30-years period (1981–2010) was considered for an accurate assessment of the Pe, taking into account daily precipitation and temperature for several meteorological stations, covering an area of 5817 km2 straddling Italy and Slovenia. Rainfall and temperature data were mapped as a function of the orography, using a co-kriging interpolation method based on the stations’ elevations.
A monitoring survey was carried out to determine depth to the water table and to identify groundwater flow paths in different hydrological conditions ((d)). Depth to the water table was measured manually, biweekly, for 2 years (2012–2014) in 58 wells (46 in Italy, 12 in Slovenia). Several isophreatic maps for different groundwater flow conditions were drawn up using the Natural Neighbor interpolation tool.
Moreover, the depth, temperature and specific electric conductivity of the groundwater were continuously monitored by means of diver data loggers, installed in seven wells (three in Italy and four in Slovenia). Seven Slug and Bail Test (CitationBouwer & Rice, 1976; CitationBouwer, 1989) and two Aquifer Pumping Tests were performed ((e)). In addition, hydraulic conductivity was defined using the Specific Capacity Method (CitationTheis, 1963) in 24 piezometers.
A 3D model of the bedrock was designed starting from the stratigraphic columns of 243 wells, 55 of which reach the bedrock, together with 197 profiles of Vertical Electrical Soundings, 47 of which reach the bedrock. Three seismic sections and three electrical tomography profiles were also considered (CitationBerlasso & Cucchi, 1991; CitationAccaino, Boehm, Busetti, Baradello, & Affatato, 2015). The integrated analysis of all these data provided the bedrock surface model with a grid cell of 10 × 10 m. Afterwards, by subtracting the bedrock surface from the DTM (10 × 10 m), the isopach map of the alluvial sediments was obtained.
The intrinsic vulnerability was evaluated using a point count system model, the SINTACS method (CitationCivita & De Maio, 1997; CitationCivita & De Maio, 2000). It takes into account seven parameters: the depth to groundwater table ‘S’, effective infiltration ‘I’, the unsaturated zone attenuation capacity ‘N’, the soil attenuation capacity ‘T’, the hydrogeological characteristics of the aquifer ‘A’, the hydraulic conductivity ‘C’ and the topographical slope ‘S’.
An increasing score is assigned to each parameter from 1 to 10, where the lowest represents conditions that guarantee greater protection for the groundwater and thus low vulnerability, while a maximum score means low or no protection and therefore high vulnerability. Scores are attributed to each cell into which the area is divided, using special charts and reference tables. Afterwards it is necessary to identify the different hydrogeological contexts and each situation is quantified using a weight string made up of seven integers with values ranging from 1 to 5. Each number is a weight coefficient multiplier that serves to enhance or mitigate the effect of each parameter in the specific scenario encountered (see Section 4.3).
The SINTACS index calculated for each cell is the sum of the weighted scores of the seven parameters, while the intrinsic vulnerability map is obtained by normalizing the SINTACS index to 100.
4. Results
4.1. Base maps
The achievements of the climatic and hydrogeological analysis that constitute the base maps of the vulnerability evaluation were the representation of precipitation and temperature as a function of the elevation, the isophreatic trend map and the reconstruction of the bedrock surface.
In particular, the analysis of long-term meteorological data was carried out for daily precipitation collected at 15 stations and air temperature at 10 stations. We computed mean annual precipitation (MAP) and mean annual temperature (MAT) for each weather station during the years 1981–2010. MAP varied between 965 and 2572 mm/yr, while the minimum MAT was 4.6°C and the maximum 15.0°C. Temperatures were strongly affected by topography and stations located in the flat areas closer to the Adriatic Sea had higher MATs, while the stations in mountainous sites had lower ones. Similarly, precipitation was influenced by topography and stations in flat areas had low MAPs compared to mountainous locations. We therefore analyzed the relations between the measured MAP and MAT with topography and found significant simple linear regressions between the elevation of the weather stations and MAT (MAT = −0.006*elevation + 13.781; R2 = 0.93, n = 10) as well as between elevation and MAP (MAP = 1.206*elevation + 1100.746; R2 = 0.83, n = 15). This strong effect of elevation on both precipitation and temperature was considered in the kriging approach used to interpolate MAP and MAT on the study area. Interpolated maps were then used as a basis for the estimation of Er and Pe for each grid cell.
The Isophreatic map was drawn up using the depth to water table under high flow conditions during the first two weeks of February 2014 at a time of one of the highest groundwater levels ever recorded (lower-left side of the Main Map ).
The isophreatic trend highlights a NE-SW groundwater flow, turning southwards in correspondence to the residential area of Sagrado. In detail, the contribution coming from the Isonzo/Soča and Vipacco/Vipava rivers and the surrounding hills is clearly visible in the northeastern part, together with the input from the Torre River in the western sector that brings about the southwards turn of the groundwater flow. South of Gorizia the groundwaters are conveyed towards the Classical Karst reliefs, where they partially supply the karst aquifer (CitationZini, Calligaris, & Zavagno, 2014b). At the same time, these waters, together with the contribution of precipitation, supply the Isonzo/Soča High Plain aquifer between Fogliano Redipuglia and Ronchi dei Legionari (CitationD’Ambrosi, 1972).
Finally, the Bedrock isobath map highlights a complex buried morphology characterized by valleys and reliefs formed as a result of past erosion and tectonic movements. The map shows a depression south from Gorizia, where the bedrock was detected at more than 100 m below mean sea level (b.s.l.). Another significant depression starts at 50 m b.s.l., in the municipality of Mariano del Friuli, and gradually reaches 350 m b.s.l., in the surroundings of Villesse (left side of the Main Map ).
4.2. SINTACS parameters
On the base of the above-mentioned layers, the seven thematic maps required by SINTACS method were elaborated.
4.2.1. Depth to groundwater table ‘S’
This parameter plays a very important role in the vulnerability assessment since, together with the unsaturated zone characteristics, it defines the travel time of a hydro-vectored or fluid contaminant and the duration of the attenuation process of the unsaturated thickness and, in particular, the oxidation process by atmospheric O2 (CitationCivita, 2010).
The depth to groundwater table map ((a)) was obtained by subtracting the piezometric surface from the topographic height acquired from the DTM. In particular, the water table elaborated in the high groundwater flow conditions recorded during the first weeks of February 2014, was used. Depth to groundwater values varied from few meters, in correspondence to streams and the most depressed areas, to more than 35 meters below the city of Gorizia. Consequently, the ‘S’ scores vary from 1 to 10 ((b)).
Figure 3. (a,b) Depth to groundwater map and relative ‘S’ scores; (c,d) Effective infiltration map and corresponding ‘I’ ratings; (e,f) Soil textures map and relative ‘T’ values.
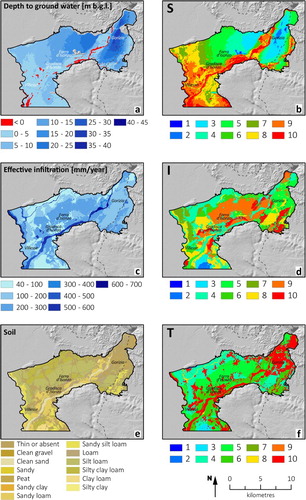
4.2.2. Effective infiltration ‘I’
The effective infiltration directly affects the dragging down of pollutant and its subsequent dilution during its passage through the unsaturated zone and then within the saturated zone (CitationCivita & De Maio, 2000). The parameter values are calculated starting from the effective precipitation (Pe) coupled with the potential infiltration index (χ), which is a function of the surficial lithology (in the case of outcropping or under conditions of scarce soil cover) or of the hydraulic characteristics of the soil (where its thickness is more than 0.5 m).
The effective infiltration (I) for each cell was obtained by multiplying Pe with χ. The results vary from 40 to over 700 mm/year, as a function of the soil permeability. The ‘I’ scores thus vary, from 2 to 10 ((d)).
4.2.3. Unsaturated zone attenuation capacity ‘N’
The unsaturated zone is composed by the subsoil included between the lower surface of the soil and the saturated zone. Its attenuation capacity is assessed starting from the hydro-lithological features such as texture, mineral composition, grain size, fracturing and karst development (CitationCivita & De Maio, 2000).
In order to evaluate the ‘N’ ratings for the unsaturated zone, a score was assigned to the different hydro-lithological levels located between the ground and the water table for the 210 stratigraphic columns available () and then a weighted average was calculated, based on their thickness. The weighted values varied from 5 to 9; in particular the highest values are observed where the unsaturated zone is richer in gravel and in correspondence of the riverbeds ((a)).
Figure 4. (a) Scores for the attenuation action of the unsaturated zone (N); (b) Ratings related to the aquifer characteristics (A); (c) Scores for the hydraulic conductivity (C); (d) Ratings for the slope ranges (S).
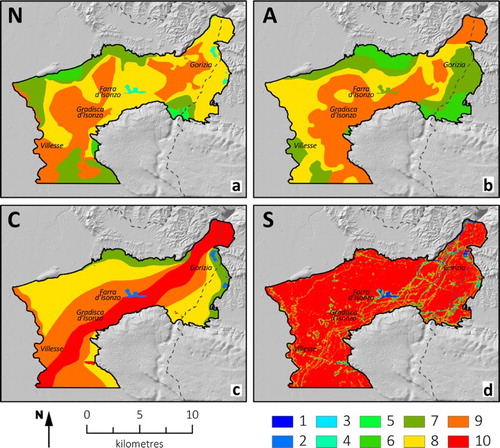
Table 1. Scores of “N” (Unsaturated zone attenuation capacity) and “A” (Hydrogeological characteristics of the aquifer) assigned to the different hydro-lithological levels.
4.2.4. Soil attenuation capacity ‘T’
The type of overburden and particularly of the soil plays a significant role in the attenuation process for a contaminant travelling within a hydrogeological system. Indeed, within the soil, fundamental processes take place and provide some degree of attenuation (CitationCivita & De Maio, 2000).
The physical (e.g. grain size, texture and bulk density) and chemical characteristics of the soil (e.g. pH, cationic exchange capacity and organic matter content) affect the soil’s attenuation capacity. In order to calculate the ‘T’ scores, the soil (CitationMichelutti, Barbieri, & Bianco, 2006; CitationStepančič et al., 1992) and the land use (CitationRAFVG, 2003; CitationTTN5) maps were categorized as a function of the textures ((e)). Values of ‘T’ vary from 2, where clayey and/or silty soils outcrop and at the base of reliefs, to 10, where the soil is absent, such as in urban areas, and where clean gravel and sand prevail or constitute the riverbeds ((f)).
4.2.5. Hydrogeological characteristics of the aquifer ‘A’
The hydrogeological characteristics of the aquifer describe the processes that involve a contaminant below the piezometric level when it mixes with groundwater and loses part of its original concentration. These processes are molecular and kinematic dispersion, dilution, sorption and chemical reactions (CitationCivita & De Maio, 2000).
Considering only the levels located below the water table of the 210 available stratigraphic columns and weighting them as a function of their thicknesses, the hydrogeological characteristics of the aquifer were defined and ‘A’ scores were assigned (). The ‘A’ scores lie between 6 and 9; the highest value is correlated to the presence of coarse alluvial deposits, especially along the riverbed of the Isonzo/Soča ((b)).
4.2.6. Hydraulic conductivity ‘C’
Hydraulic conductivity represents the groundwater mobility capacity within the saturated aquifer and thus the mobility potential of a contaminant having density and viscosity almost the same as the groundwater itself (CitationCivita & De Maio, 2000).
Hydraulic conductivity was evaluated for 33 wells through the above-mentioned hydrogeological tests and spatially interpolated to obtain a map of hydraulic conductivity of the whole study area. Thereafter, the map was critically reviewed to take into account the hydrogeological characteristics of the aquifer.
In general, the hydraulic conductivity of the Isonzo/Soča High Plain is high, the values lying between 10−2 and 10−4 m/s and thus the ‘C’ scores for the alluvial area vary from 7 to 10 ((c)).
4.2.7. Topographical slope ‘S’
The topographic slope governs the amount of surface runoff and the velocity of water (a fluid and/or hydro-vectored contaminant) over the equipotential surface (CitationCivita & De Maio, 2000).
The slope map was drawn up from the DTM. Slope values in the plain are generally low and, consequently, almost everywhere, the ‘S’ scores reach the maximum value of 10 ((d)).
4.3. Hydrogeological and impact situations
Four different hydrogeological and impact situations were identified: ‘severe impact’, ‘seepage’, ‘fissured’ and ‘karstified’ (). The most widespread situation in the plain is that of ‘severe impact’ and is represented by scenarios of low-slope gradient and intense urbanization, diffuse agriculture and/or industrialization. Along the riverbeds delimited seepage areas occur, within which exist or could exist considerable water exchange between surface water bodies and groundwater. The outcropping rocks are classified either as ‘fissured’ (Flysch) or as ‘karstified’ (limestone). The weight strings used are shown in .
Figure 5. Hydrogeological and impact situations.
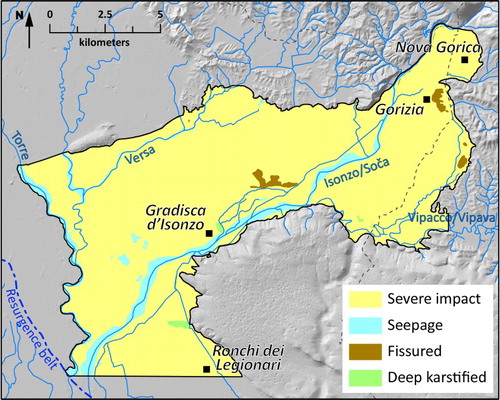
Table 2. Weight strings for the hydrogeological and impact situations identified.
4.4. The SINTACS intrinsic vulnerability map
The SINTACS intrinsic vulnerability map is represented using six increasing vulnerability classes according to the normalized score (as suggested by CitationCivita & De Maio, 2000):
Very low (0–25);
Low (25–36);
Medium (36–50);
High (50–70);
Very high (70–80);
Extremely high (80–100).
5. Hazard sources and hazard index map
An evaluation procedure of hazard sources, promoted by the European Union (CitationVarious authors, 2004), points out that a range of factors contribute, either individually or together, to render any human activity a ‘hazard source’. Indeed, sources of pollution are associated with a wide range of industrial, agricultural, commercial and domestic activities. Hazard sources can be distinguished as punctiform (such as a petrol station) or diffuse (such as a cultivated area).
To integrate the intrinsic vulnerability map, the pollution sources were identified and digitized. The hazard of each point or area was evaluated using the rating system proposed by CitationCivita and Zavatti (2006) for the anthropic and/or industrial activities and integrated with the hazard factors suggested by CitationTrevisan, Padovani, Errera, Capri, and Del Re (1998) for the agricultural areas. Initially the types of hazard were mapped, separating the two classification systems.
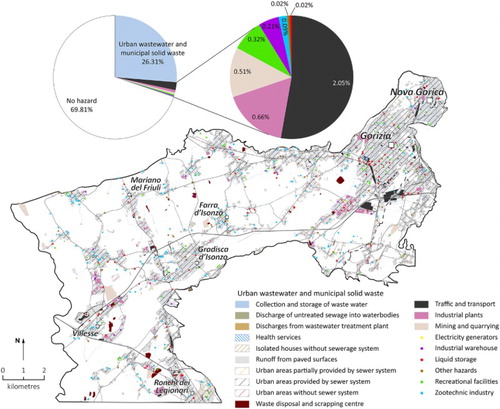
shows the potential hazard sources, according to CitationCivita and Zavatti (2006). This classification associates a Hazard Index (HI) to each activity, as function of different hazard factors (e.g. the production of special or hazardous waste, the discharge of organic or inorganic pollutants). Punctiform and areal data were collected from different sources, such as the Chamber of Commerce of Gorizia for industrial and manufacturing plants, the Regional Agency for Environmental Protection (ARPA) for liquid storage, AcegasApsAmga and Irisacqua for urban wastewater and municipal waste management and the S.I.AGRI.FVG (CitationRAFVG, 2006) database for the location of animal husbandry activities. In order to cover all the categories, the data regarding traffic and transport, recreational facilities and quarrying were extracted from an online available database (Open Street Map), from the land use map (CitationRAFVG, 2003), from the layers of the Regional Technical Map and from the Regional Geological-Technical Map (CitationRAFVG, 2008). Most of the data were finally verified through orthophoto assessment or the Street View tool (Google Maps). Almost the 70% of the study area has no classified hazard, according to the categories proposed by CitationCivita and Zavatti (2006). The main source of pollution hazard is derived from the urban wastewater and municipal solid waste management systems (26.31%, 8 ≤ HI ≤ 15) with all the other categories covering the remaining 3.88%.
Figure 6. Hazard sources according to CitationCivita and Zavatti (2006).
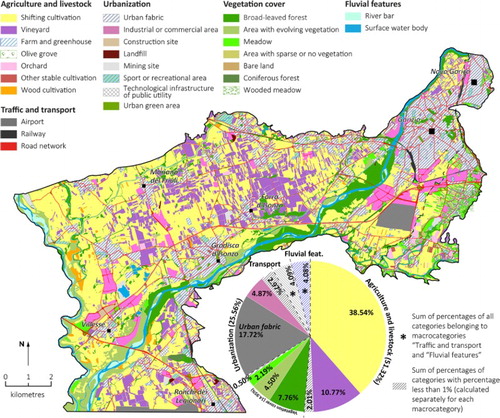
reports the main land use classes according to CitationTrevisan et al. (1998). This system correlates a Hazard Factor (HF) value to each class, based on the probability that the pollution is caused by pesticides and/or fertilizers. Three RapidEye satellite images of 2012 were acquired to classify crops, which have different phenological phases in the course of the year. Specifically, 1st April (to detect the presence of vineyards, wheat and barley and grassland), 17th June (to classify maize, soybeans, meadows and vineyards) and 24th of October (to identify meadows and vineyards) were chosen. Contextual image classification methods using sequential maximum a posteriori (SMAP) estimation was used in GRASS 6.4 GIS. Due to the highly fragmented nature of the territory and the shift in crop cultivation (mainly alternation between barley and soya), each image was classified separately and then combined using a complex post-classification processing. Data belonging to ‘Urbanization’ and ‘Traffic and transport’ categories were derived from the existing land use maps (CitationRAFVG, 2003; CitationTTN5). More than 38% of the Isonzo/Soča High Plain is affected by shifting cultivations (HF = 5), more than 17% is occupied by urban fabric (HF = 1–2), about 11% by vineyard (HF = 9) and about 15% is covered by other vegetation (HF = 0–1) with the other categories representing less than 5% of the total. In this case, the HI is obtained by adding to the HF other four control factors related to agronomic practices, climatic conditions, irrigations and slope (CitationTrevisan et al., 1998).
Figure 7. Land use classes according to CitationTrevisan et al. (1998).
In order to calculate a single HI, the two maps ( and ) were overlapped and the worse condition, i.e. the higher HI, was taken as prevailing for creating a unique HI map (lower-right side of the Main Map ).
6. Conclusions
The SINTACS intrinsic vulnerability map shows that the Isonzo/Soča High Plain aquifer is fairly vulnerable as a result of its hydrogeological characteristics, the most exposed areas occurring in correspondence to the riverbeds and, in the south, at the line of contact between High and Low Plain, along the Resurgence Belt.
Almost half of the study area (49%) has high vulnerability. 37% of the area is classified as of very high vulnerability, while 11% of territory has extremely high values. Only 2% and 1% of the study area are considered as having medium and low vulnerability, respectively. There is no territory with very low vulnerability. In general, the vulnerability is greater in the flat areas characterized by very high hydraulic conductivity and minimum depths to groundwater.
Conversely, the HI map indicates that the surface water bodies and their flat surroundings have minimum HI values. Medium values are identified around almost all of the towns. The higher HI values correspond to the industrial zones and to vineyards or shifting cultivation. However, classes of HI equal or greater than 11 constitute about the 20% of the study area. By combining the analysis of the Vulnerability and HI maps, the most vulnerable areas correspond to low values of HI (≤10) and in less than 3% of areas extremely high vulnerability coincide with high HI values (>10).
The Intrinsic vulnerability map highlights that the aqueduct wells of Gorizia and Farra d’Isonzo are located in extremely vulnerable areas. The wells located in the surroundings of San Pier d’Isonzo, that guarantee the supply of water to the city of Trieste (located about 35 km to the SE), are set within a slightly better context (high vulnerability), given the presence of finer and less permeable sediments.
Software
The maps were produced by means of Esri ArcGIS v. 10.1 and GRASS 6.4 GIS while Adobe Illustrator CS6 and Adobe InDesign CS6 were used for graphic operations and layout building respectively.
Treu_etal_map_final.pdf
Download PDF (71.3 MB)Treu_etal_JoM_MapDesign.doc
Download MS Word (24 KB)Acknowledgements
The joint activities were carried out within the framework of the European CBC Projects Italia-Slovenia 2007–2013: GEP (http://www.gepgis.eu) and ASTIS (http://astis.ung.si), both funded by the European Union.
In particular, the authors are grateful to Flavio Accaino, Alessandro Affatato, Alfredo Altobelli, Luca Baradello, Alfio Barbagallo, Marco Borga, Martina Busetti, Barbara Čenčur Curk, Silvia Cleva, Massimiliano Fazzini, Cristina Gerdol, Tamara Ferjan, Francesco Marra, Miroslav Medić, Kim Mezga, Katja Mignozzi, Daniel Nieto, Salvatore Pepi, Tanja Prebil, Sabrina Russo, Nataša Simac, Marta Stopar, Mauro Scimone, Carmela Vaccaro, Davide Zoccattelli, AcegasApsAmga s.p.a., ARPA FVG, Irisacqua s.r.l., Servizio Geologico, Servizio disciplina servizio idrico integrato, gestione risorse idriche, tutela acque da inquinamento and Civil Defense of Friuli Venezia Giulia Region for their precious collaboration during field and desk activities.
Disclosure statement
No potential conflict of interest was reported by the authors.
ORCID
Zini Luca http://orcid.org/0000-0001-6564-1683
Enrico Zavagno http://orcid.org/0000-0001-7669-7201
Sara Biolchi http://orcid.org/0000-0003-2446-3627
Boccali Chiara http://orcid.org/0000-0003-4564-2253
Giulia Zuecco http://orcid.org/0000-0002-2125-0717
Related Research Data
References
- Accaino, F., Boehm, G., Busetti, M., Baradello, L., & Affatato, A. (2015). New geologic and tectonic insight in the Isonzo plain through seismic imaging. Near surface geoscience 2015–21st European meeting of Environmental and Engineering Geophysics, 386–390, ISBN 978-151081412-7.
- Bavec, M., Tulaczyk, S. M., Mahan, S., & Stock, G. M. (2004). Late quaternary glaciation of the Upper Soča River region (Southern Julian Alps, NW Slovenia). Sedimentary Geology, 165, 265–283. doi: 10.1016/j.sedgeo.2003.11.011
- Berlasso, G., & Cucchi, F. (1991). Caratteristiche geologiche e strutturali della Bassa Pianura Isontina (Friuli Venezia Giulia). Rend Soc Geol It, 14, 13–16.
- Bisaglia, M., Cisotto, A., Stocco, R., Guarino, M., Biolchi, S., Boccali, C., … Čenčur-Curk, B. (2014). La salvaguardia degli acquiferi LINEE GUIDA/Smernice za zaščito vodonosnikov. Progetto/Projekt ITA-SLO 2007–2013 ASTIS, Autorità di Bacino Alto Adriatico, 50+50 pp., Rubano (PD).
- Bouwer, H. (1989). The Bouwer and rice slug test, an update. Groundwater, 27(3), 304–309. doi: 10.1111/j.1745-6584.1989.tb00453.x
- Bouwer, H., & Rice, C. (1976). A slug test for determining hydraulic conductivity for unconfined aquifers with completely or partially penetrating wells. Water Resources Research, 12(3), 423–428. doi: 10.1029/WR012i003p00423
- Buser, S. (1968). Osnovna geološka karta SFRJ, list Gorica, 1:100.000. Beograd: Zvezni geološki zavod.
- Carulli, G. B. (2006). Carta Geologica del Friuli Venezia Giulia, scala 1:150000. Regione Friuli Venezia Giulia, S.EL.CA. Firenze. A cura della Regione Autonoma Friuli Venezia Giulia, Direzione Centrale Ambiente e Lavori Pubblici, Servizio Geologico.
- Civita, M. (1994). Le Carte della vulnerabilità degli acquiferi all'inquinamento: Teoria & Pratica, pp. 325. Bologna: Pitagora Editrice.
- Civita, M. V. (2010). The combined approach when assessing and mapping groundwater vulnerability to contamination. Journal of Water Resource and Protection, 2, 14–28. doi: 10.4236/jwarp.2010.21003
- Civita, M., & De Maio, M. (1997). SINTACS un sistema parametrico per la valutazione e la cartografia della vulnerabilità degli acquiferi all’inquinamento. Metodologia e automazione, pp. 191. Bologna: Pitagora Editrice.
- Civita, M., & De Maio, M. (2000). SINTACS r5, a new parametric system for the assessment and automating mapping of groundwater vulnerability to contamination, pp. 226. Bologna: Pitagora Editrice.
- Civita, M., & Zavatti, A. (2006). Un manuale per l'analisi di sito e la valutazione del rischio d'inquinamento (p. 350). Bologna: Pitagora Editrice.
- Cucchi, F., Franceschini, G., & Zini, L. (2008). Hydrogeochemical investigations and groundwater provinces of the Friuli Venezia Giulia Plain aquifers, Northeastern Italy. Environmental Geology, 55, 985–999. doi: 10.1007/s00254-007-1048-4
- Cucchi, F., Marinetti, E., Massari, G., Oberti, S., Piano, C., & Zini, L. (1999). Carta della vulnerabilità intrinseca della pianura friulana. Quaderni di Geologia Applicata, 1999, pp. 1283–1289. Bologna: Pitagora Ed. Pubbl. n°1976 del GNDCI, LR4.
- Cucchi, F., Massari, G., Oberti, S., & Piano, C. (2002). La vulnerabilità integrata delle falde acquifere della pianura isontina. Mem Soc Geol It, 57, 551–560. 6ff. Pubbl. n° 2242 del GNDCI, LR4.
- D’Ambrosi, C., & Mosetti, F. (1972). Il conoide isontino e le sue falde acquifere nel loro stato attuale e con riferimento alle influenze carsiche collaterali. Atti e memorie della Commissione Grotte “E. Boegan”, XI, 19–36.
- Fontana, A., Monegato, G., Zavagno, E., Devoto, S., Burla, I., & Cucchi, F. (2014). Evolution of an Alpine fluvioglacial system at the LGM decay: The Cormor megafan (NE Italy). Geomorphology, 204, 136–153. doi: 10.1016/j.geomorph.2013.07.034
- Fontana, A., Mozzi, P., & Bondesan, A. (2008). Alluvial megafans in the Veneto-Friuli plain: Evidence of aggrading and erosive phases during late Pleistocene and Holocene. Quaternary International, 189, 71–90. doi: 10.1016/j.quaint.2007.08.044
- Jurkovšek, B., Biolchi, S., Furlani, S., Kolar-Jurkovšek, T., Zini, L., Jež, J., … Cucchi, F. (2016). Geology of the classical Karst Region (SW Slovenia – NE Italy). Journal of Maps, 12(Suppl. 1), 352–362. doi: 10.1080/17445647.2016.1215941
- Michelutti, G., Barbieri, S., & Bianco, D. (2006). Suoli e paesaggi del Friuli Venezia Giulia, vol. 2, Province di Gorizia e Trieste. Mappa 1:50.000. Ed. ERSA, ISBN 8889402083, 636 pp., Pozzuolo del Friuli (Udine).
- Regione Autonoma Friuli Venezia Giulia. (2003). Progetto MOLAND-FVG sul consumo ed uso del territorio nel Friuli Venezia Giulia. Direzione regionale della pianificazione territoriale. Ispra: CCR della Commissione Europea.
- Regione Autonoma Friuli Venezia Giulia. (2006). Sistema informativo agricolo – S.I.AGRI.FVG. Retrieved May 24, 2014, from http://siagri.regione.fvg.it/portale/it/
- Regione Autonoma Friuli Venezia Giulia. (2008). Carta geologico Tecnica digitale in scala 1:5.000 dei fogli 088 “Gorizia” e 109 “Grado”. Retrieved October 28, 2013, from http://www.regione.fvg.it/rafvg/cms/RAFVG/ambiente-territorio/tutela-ambiente-gestione-risorse-naturali/FOGLIA201/FOGLIA6/
- Stefanini, S., & Cucchi, F. (1976). Gli acquiferi del sottosuolo della provincia di Gorizia (Friuli Venezia Giulia), CNR, Istituto di Ricerca sulle Acque. Quaderni dell’Istituto di Ricerca sulle Acque, 28(13), 351–366.
- Stepančič, D., Kodrič, M., Šrok, D., Šporar, M., Lobnik, F., & Vrščaj, B. (1992). Pedologic map of Slovenia 1:25,000. Ljubljana: University of Ljubljana, Biotechnical faculty, Center for pedology and environmental protection.
- Theis, C. V. (1963). Estimating transmissibility of a water table aquifer from specific capacity of wells. In R. Bentall (Ed.), Methods of determining permeability, transmissibility and drawdown (pp. 332–336). Washington: USGS Water supply paper, 1536.
- Trevisan, M., Padovani, L., Errera, G., Capri, E., & Del Re, A. A. M. (1998). Indici di pericolosità delle attività agricole per il calcolo del rischio di inquinamento delle acque sotterranee a scala Regionale. In: Atti della giornata mondiale dell’acqua. “Acque Sotterranee: Risorsa Invisibile” Roma 23 Marzo 1998, 121–125 CNR-GNDCI.
- TTN5. Slovenian national topographic map 1:5000, Ministry of the Environment and Spatial Planning, The surveying and mapping authority of the Republic of Slovenia (access 2013).
- Turc, L. (1954). Le bilan d’eaux des sols: Relation entre les précipitations, l’èvaporation et l’ecoulement. Ann Agron, 5, 491–596.
- Various Authors. (2004). Cost Action 620, Vulnerability and risk mapping for the protection of carbonate (karst) aquifers. Final report. F. Zwahlen (Ed.), pp. 297, Luxembourg, ISBN 92-894-6416-X.
- Venturini, S., & Tunis, G. (1991). New stratigraphical, paleoenvironmental and tectonic data of the Flysch di Cormons. Eastern Friuli, Gortania, 13, 5–30.
- Zini, L., Calligaris, C., Treu, F., Zavagno, E., Iervolino, D., & Lippi, F. (2013). Groundwater sustainability in the Friuli Plain. Aqua Mundi, 4, 41–54.
- Zini, L., Calligaris, C., & Zavagno, E. (2014b). Classical karst hydrodynamics: A shared aquifer within Italy and Slovenia. IAHS-AISH proceedings and reports 364, 499–504.
- Zini, L., Cucchi, F., Treu, F., Biolchi, S., Boccali, C., Cleva, S., … Vaccaro, C. (2014a). Idrogeologia dell’Alta Pianura Isontina. In Ricerche idrogeologiche e ambientali e Sistema Informativo Geografico del Progetto GEP, Progetto/Projekt ITA-SLO 2007-2013 GEP, (pp. 19–27). Trieste: EUT - Edizioni Università di Trieste. ISBN 978-88-8303-588-3.