
ABSTRACT
In the context of rising sea level, many estuaries and bays show an overall trend to sedimentary infilling. Among these coastal environments, the Bay of Somme is a hypertidal tide and wave-dominated estuary, filled in by marine sands, with a superficy of 70 km2. This study proposes a spatial zonation of the intertidal area of the bay based on the combination of information on sediments, seabed morphology and dynamics. Data come from a surficial sediment sampling campaign and six airborne LiDAR topographic surveys, acquired over the period 2011–2013, providing information on grain size, carbonate content, bedform occurrence and seabed dynamics. The Main Map shows the morpho-sedimentary and -dynamic zonation used as a basis to describe infilling stages in the bay.
1. Introduction
Currently, many estuaries and bays are being filled with sediment since the Holocene transgression (CitationAnthony, Citation2002; CitationDavis & Fitzgerald, Citation2004; CitationDyer, Citation1986; CitationGibbard & Lautridou, Citation2003; CitationGreen & MacDonald, Citation2001; CitationHarris, Citation1988; CitationJago, Citation1980; CitationMoore, Wolf, Souza, & Flint, Citation2009; CitationNichols & Biggs, Citation1985; CitationPaphitis, Bastos, Evans, & Collins, 2010; CitationPsuty & Silveira, Citation2009; CitationTessier, Billeaud, Sorrel, Delsinne, & Lesueur, Citation2012). The characterization of the degrees of sedimentary infilling and the quantification of its rates constitute an important information in order: (i) to better understand past evolution of estuaries, and (ii) to forecast future landscape, habitat and usage modifications for an adapted management.
Sea-level rise rate, bedrock morphology, sediment supply and sediment transport rate are the main controlling factors of the general infilling pattern of estuaries and bays (CitationTessier et al., Citation2012). According to CitationHarris (Citation1988), bedforms (e.g. sandbanks, hydraulic dunes, tidal flats) can constitute a source of information on the stages of sedimentary infilling of bays and on the directions of sediment transport. Estuary evolution is mainly driven by bedform evolution, which is strongly controlled by sediment dynamics on the estuarine bed, itself dependent on sediment characteristics (CitationBoyd, Dalrymple, & Zaitlin, Citation1992; CitationGreen & MacDonald, Citation2001; CitationJarvis & Riley, Citation1987).
The Bay of Somme, ranked 10th ‘Grand Site de France®’ (CitationSyndicat Mixte Baie de Somme Grand Littoral Picard, 2011), is located on the French coast of the Eastern English Channel. It is the biggest estuarine bay of Picardy (70 km²), with a mixed energy regime, influenced by both tides and waves: the tide has a hypertidal range (8.5 m in mean spring conditions, up to 10.55 m in case of exceptional tides) and prevailing waves are of west provenance (75% of the time) with mean significant wave height and period around 2 m and 7 s, respectively, along the littoral of Cayeux-sur-Mer. These weather-marine forcings control the infilling of the bay by marine sands (CitationDupont, Citation1981), derived from the sedimentary prism of Picardy (CitationFerret, Le Bot, Tessier, Garlan, & Lafite, Citation2010), and by an important endemic bioclastic production (CitationDesprez, Olivesi, Duhamel, Loquet, & Rybarczyk, Citation1998). A sand bulge occupies the bay, which is fully located in the intertidal domain. The seabed of the Bay of Somme is characterized by: (1) a uniform and relatively flat beach (almost devoid of bedforms) connecting the Pointe de St-Quentin to the Crotoy; (2) tidal channels; (3) sand banks; (4) sedimentary bars systems and (5) more than 4200 hydraulic dunes arranged in fields and usually covered with ripples (CitationMichel, Citation2016). Two rivers flow into the bay: the Somme river (mean flow rate of 32 m3/s) to the east of the bay, channeled from Abbeville to Saint-Valery-sur-Somme, and the Maye river (mean flow rate of 1.5 m3/s) leading to the north of the bay. They bring low amounts of fine particles (67 800 T year−1 from the Somme river; CitationLoquet, Rybarczyk, & Elkaim, Citation2000), which deposit on salt marshes (altitude beyond + 4 m NGF-IGN69).
In this study, an interpretative map of the morpho-sedimentary and -dynamic characteristics of the Bay of Somme is proposed, based on the combination of data on seabed dynamics and bedform occurrence, obtained from airborne LiDAR topographic surveys, and refined with sedimentary data (grain-size parameters, carbonate content) derived from surficial sediment sampling (Main Map). On the basis of these sedimentological, morphological and dynamic criteria, the definition of sectors with homogeneous morpho-sedimentary and -dynamic characteristics allows to propose a zonation of the Bay of Somme, which can be then used as a spatial framework to describe the different infilling stages in the bay.
2. Methods
2.1. Data
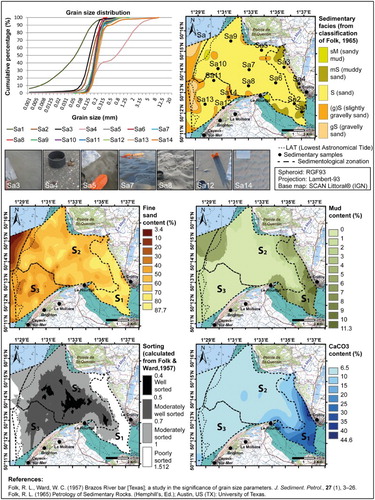
A total of 246 surficial sediment samples were realized on the sandy seabed of the bay, between 13 February 2013 and 22 August 2013, at a mean sampling interval of 500 m. Most of the areas were reached by foot and samples were collected by hand in the first 4 cm. For the water areas (tidal channels, the western border of the intertidal domain), samples were collected with an Ekman grab from a zodiac. Grain-size analyses were performed using an LS230 laser granulometer (© Beckman Coulter) on the fine fractions (<2 mm) and a sieving column for the coarsest fractions (>2 mm). A calcimetric analysis (Bernard calcimeter) was performed on 64 samples, distributed according to a 1 km grid. All results have been entered into the Granush® software of SHOM (CitationPedreros, Citation1996) to calculate sedimentological parameters (e.g. mean grain size, sorting) according to the CitationFolk and Ward (Citation1957) method, as well as weight percentages of the different sedimentary classes (e.g. mud and fine sand contents) and the sedimentary facies according to the classification of CitationFolk (Citation1965).
Topographic data were acquired by airborne LiDAR (ALS60 LiDAR, © Leica Geosystems) at low tidal waters in the period February 2011–April 2013 at a seasonal to annual timescale: one campaign in February–March 2011 (RGE® Alti product by IGN; Institut National de l’Information Géographique et Forestière) and five campaigns from 28 September 2011 to 11 April 2013 realized by the CIRCLE operational team: three have been conducted in autumn, 28 September 2011, 18 November 2012 and 4 November 2013, in the framework of the SNO DYNALIT with funding from SFR SCALE 3730 and the Région Haute-Normandie, the two others in spring, the 2 June 2012 and 1 April 2013, with funding from Région Picardie and FEDER. These data are referenced into the French altimeter system IGN69. They cover the intertidal area with a vertical accuracy of ±0.15 m for the February–March 2011 data and ±0.08 m for the other surveys (28 September 2011 to 11 April 2013), except in water areas in which the LiDAR signal does not penetrate (e.g. bottom of tidal channels, hunting ponds in salt marshes, lowest areas of the intertidal zone, subtidal areas). These topographic LiDAR data have been used to perform the mapping of the morphology and the dynamics of the bay.
2.2. Cartography and computer graphics
Maps were realized from the sediment and topographic data by means of ArcGIS10 (© ESRI) and Adobe® Illustrator® CS6 Tryout (© Adobe Systems Inc.) softwares.
The sedimentary facies map (), established according to the classification of CitationFolk (Citation1965), was built as a shapefile of polygons drawn by hand. All other sedimentary maps (mean grain size on Main Map; mud and fine sand contents, sorting, CaCO3 content on ) correspond to rasters created using kriging interpolation proposed in ArcGIS10 (© ESRI), with a resolution of 1 m. On the Sediment Map (Main map), sedimentary zones were delimitated on the basis of the distribution of mean grain size, which is a synthetic sediment parameter, and content in fine sands, which is the most represented sedimentary class in the bay (). The other sediment parameters have been synthetized for each zone and presented on the Interpretative Map.
Figure 1. Grain-size and sediment characteristics in the Bay of Somme, in 2013. Maps of the facies distribution (classification of CitationFolk, Citation1965), the fine sand, mud and CaCO3 contents, and the sorting parameter (phi) (CitationFolk & Ward, Citation1957), with the sediment zones presented on the Main map (S1–S3 zones). Grain-size curves (cumulative percentage, AFNOR norm) and photos for 14 characteristic samples.
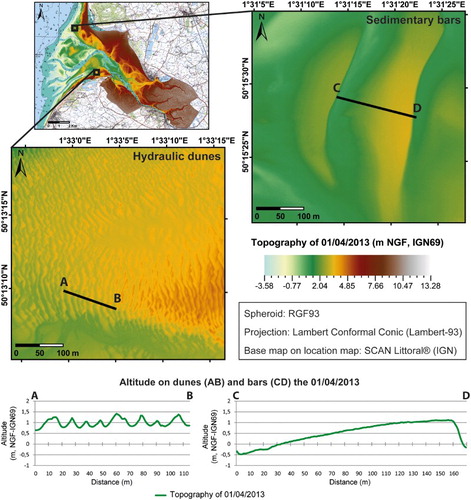
The morphology map (Main map) presents the topography of the bay and the localization of the crests of sedimentary bars and hydraulic dunes for the 1 April 2013, as well as a morphological zonation, based on DEMs (resolution: 1 m) created from all the six airborne LiDAR topographic data sets in the 2011–2013 period, using a conversion from points to raster. Since the LiDAR beam does not penetrate water, data in the tidal channels and the lowest parts of the tidal flats were removed from DEMs. Nevertheless, tidal channels can be easily localized in these blind areas as sinuous and straight features, meandering between the entrance and the bottom of the bay. Hydraulic dunes crests were automatically determined using ParamDunes software of SHOM (CitationHoche, Garlan, & Thomas, Citation2006). The ParamDune software uses an algorithm based on the principle of watershed delimitation, which allows to detect crest and feet of hydraulic dunes, and then to calculate dune morphometric parameters. Sedimentary bars were digitized by hand using ArcGIS10 (© ESRI). The morphological zonation has been delimitated qualitatively according to the dominant morphological feature observed on the six topographic data sets acquired during the 2011–2013 period. Five types of morphology have been considered and mapped: tidal channels, sedimentary bars, hydraulic dunes, salt marshes and flat high-altitude beaches. They have been recognized: (i) in a qualitative way from the texture observed on the LIDAR data (rough due to vegetation for salt marshes, smooth for high-altitude beaches, wavy for sedimentary bars), and (ii) in a quantitative way for hydraulic dunes using the ParamDune software. When the dominant morphological feature changes over time in a given area, we have favored morphologies indicative of sedimentary infilling: (i) first, salt marshes, which is a direct marker of achieved infilling, then (ii) flat high-altitude beaches, indicative of nearly infilled areas, and then (iii) the dynamic morphological features (tidal channels, sedimentary bars and dunes), which indicate zones of active sediment transport, mainly concerned with active infilling but in some places with active erosion. highlights morphological characteristics of specific bedforms (sedimentary bars and hydraulic dunes) extracted from the 1 April 2013 topographic map.
Figure 2. Morphology of characteristic bedforms of the Bay of Somme, 1 April 2013. Expanded views show sedimentary bars from sector M3 and hydraulic dunes from sector M4 (extract of the morphology map presented on the Main map). Vertical profiles in a sector of hydraulic dunes (AB profile in sector M4) and sedimentary bars (CD profile in sector M3) showing altitude the 1 April 2013.
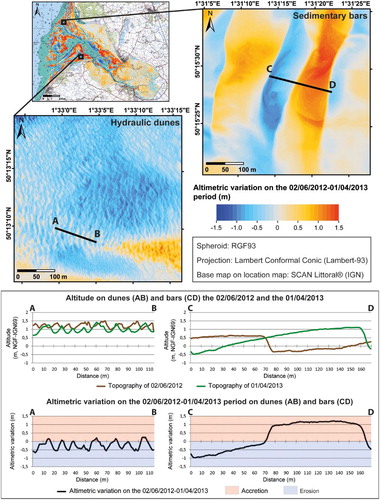
The dynamic map (Main map) is based on DEMs Of Difference (DODs, resolution: 1 m) that show differences in surface altitudes by cell from all DEMs, allowing identification of sectors in accretion (in red) or in erosion (in blue). As an example, the DOD for the 2 June 2012–1 April 2013 period (the longest period with the best vertical accuracy) is presented (Main map). A zonation is proposed on the basis of all DODs from 2011 to 2013 period, to distinguish stable or dynamic sectors. On , evolution on fields of sedimentary bars and hydraulic dunes is shown for two areas extracted from the DOD for the 2 June 2012–1 April 2013 period.
Figure 3. Sediment dynamics on sectors with characteristic bedforms of the Bay of Somme, 2 June 2012–1 April 2013 period. Expanded views show sedimentary bars from sector M3 and hydraulic dunes from sector M4 (extract from the dynamic map presented on the Main map). Vertical profiles in a sector of hydraulic dunes (AB profile in sector M4) and sedimentary bars (CD profile in sector M3), showing: (i) altitude on the 2 June 2012 and 1 April 2013 datasets, and (ii) altimetric variations during the 02 June 2012–1 April 2013 period.
The morpho-sedimentary and -dynamic interpretative map of the Bay of Somme (Main map) results from the combination of the three previous maps, using ArcGIS10 (© ESRI). Different sectors with similar morphological, sedimentary and dynamic characteristics (Z1–Z8; Main Map) have been delimitated, allowing the zonation of the bay, which can be used as a spatial framework to describe the different infilling stages. This zonation has been realized on the basis of the dynamic (D1–D3; Main Map) and morphological (M1–M5) zonations, refined in some places with sediment characteristics (Sediment Map on Main Map and ). A synthesis of the main sediment characteristics (proportions of sedimentary classes, average mean grain size and carbonate content) is presented for each zone (Z2–Z8), except for salt marshes (Z1), few sampled, where three isolated samples are shown. Information on the intensity of the sediment dynamics (low to strong) is represented with four different colors.
3. Results and interpretation
3.1. Grain-size and nature of the surficial sediments
In 2013, sediments are unimodal to bimodal sands (), essentially composed of fine sands (27–88% in the intertidal area), and differ from the sediments located below the LAT (lowest astronomical tide), where the rapid bathymetry fall leads to wave breaking and to the presence of coarser beds (gravelly sands according to CitationFolk, Citation1965).
Analysis of sedimentological parameters (Main Map and ) delimitates the intertidal area into three distinct sectors, showing a decrease in grain size from offshore to the inner areas of the bay and from the central channels to the edges of the bay, classically observed in estuaries and bays (CitationDavis & Fitzgerald, Citation2004), and observed in the Bay of Somme in 1980 (CitationDupont, Citation1981).
In the inner and sheltered parts (sector S1; Main map), corresponding to salt marshes and highest areas (above +3 m NGF-IGN69), sediment consists of muddy sands and sandy muds (e.g. samples Sa1, Sa2 and Sa3; ), with an average mean grain size of 153 µm (locally reaching 669 µm in shell beds deposited along the coastline; e.g. sample Sa4; ), a mean fine sand content between 28% and 88%, a mud and CaCO3 mean contents of 8.3% and 26%, respectively, and poor sorting (mean of 1.3 phi).
In the central area where channels migrate and in the external part of the bay, west of a line between La Maye and Le Hourdel, the sediment corresponds to sand (e.g. samples Sa5–Sa10; ) or, locally, to slightly gravelly sand (e.g. sample Sa14; ) or gravelly sand. Mud and CaCO3 contents are lower than 4.3% and 14% respectively, and the sorting is moderate to high (mean of 0.7 phi). In the northern part (sector S2; Main map), fine sand content is greater (mean of 59%) and the mean grain size is smaller (mean of 211 µm) than compared to the southern part (sector S3; Main map) (mean of 45% and 249 µm, respectively).
3.2. Morphology of the seabed
The intertidal area of the Bay of Somme is composed of tidal flats, where salt marshes and four other types of seabed morphology are observed (Main map).
Salt marshes (sector M1; Main map), covered with vegetation, are situated in the inner parts of high altitude, beyond +4 m (NGF-IGN69): (i) near Maye estuary (0.5 km²), (ii) in a sheltered sector linking Le Hourdel and Cap Hornu (5 km²), and (iii) to the east, in the bottom of the bay, where salt marshes are the most developed (13 km²). Salt marshes tend to expand with bed elevation (up to 23.7 m year−1 on the 1947–2011 period; CitationMichel, Citation2016) and constitute a good indicator of sedimentary infilling (CitationVerger, Citation1995, Citation2005).
Tidal flats are cut by tidal channels and covered by numerous bedforms, such as sand banks, sedimentary bars and hydraulic dunes.
Channels (sector M2; Main map) allow the Somme river to flow from Saint-Valéry-sur-Somme, located in the bottom of the bay, to the ebb delta, and facilitate the penetration of the tide from the west.
Sedimentary bars (sector M3; Main map) are located along the northern and southern coasts of the bay (west of the Pointe de St-Quentin and the Pointe du Hourdel), exposed to waves and where they are connected to coastal barriers. They are up to 1 km long and 3 m high, with a spacing of about 200 m and are generally parallel to the coast ().
Hydraulic dunes (sector M4; Main map) are the most represented tidal bedforms on the intertidal area (Main map and ). Automatic detection realized by ParamDunes software (CitationHoche et al., Citation2006) identified 4189 dunes on the 1 April 2013 topographic DEM. They have a height less than 2.67 m (0.37 m on average) and a wavelength less than 50 m (17.7 m on average) (CitationMichel, Citation2016; ). Thus, they correspond to small to large dunes according to CitationBerné et al. (Citation1989) classification, as observed in other estuaries (e.g. CitationDalrymple, Citation1984; CitationMasselink, Cointre, Williams, Gehrels, & Blake, Citation2009).
Dunes are absent on beaches of high altitude (greater than + 4 m NGF-IGN69), located between Le Crotoy and the Pointe de St-Quentin (sector M5; Main map) and near to sedimentary bar systems. Absence of dunes in high sectors can be explained by a finer sediment grain-size, in accordance with observations of CitationBokuniewicz, Gordon, and Kastens (Citation1977), CitationLanghorne (Citation1973) and CitationTodd, Shaw, Li, Kostylev, and Wu (Citation2014).
3.3. Sediment dynamics in the bay
In the 2011–2013 period (e.g. 2 June 2012–1 April 2013 period; Main map), the sectors of high altitude (> +3.5 m NGF-IGN69) show non-significant altimetric variations (gray color), and can be considered as stable areas (sector D1; Main map). In central and external zones of the bay, lower and exposed to the powerful hydrodynamic forcings (hypertidal tide, frequent wind waves), the bed is very dynamic with altimetric variations, in the 2 June 2012–1 April 2013 period, up to 6 m in channels and up to 2.7 m in zones of migrating bedforms (sector D2; Main map). We observed both: (i) large erosion (blue colors) and accretion (orange colors) zones (up to more than 1 km wide in the 2 June 2012–1 April 2013 period), due to the mobility of channels and sand banks, and (ii) periodical narrower bands (up to 300 m wide in the 2 June 2012–1 April 2013 period), normal to tidal and wave currents, with an alternation of erosion/accretion, that correspond to the migration of sedimentary bars and hydraulic dunes (maps and vertical profiles; ). The small to large hydraulic dunes of the Bay of Somme are very dynamic bedforms that migrate up to 4.7 m with possible polarity inversion, per high spring semi-diurnal tidal cycle associated with strong wavy conditions (maximum Hs: 1.98 m) (CitationMichel, Citation2016).
Finally, tidal channels, and especially the main channel, concern a large area and display important migration over time (sector D3; zone of channel migration over the period 2011–2013; Main Map).
3.4. Morpho-sedimentary and dynamic zonation
The combination of the three criteria (sediment, morphology, dynamics) distinguishes eight zones with specific morpho-sedimentary and -dynamic characteristics. Seven zones are concerned with sedimentary infilling with three types of infilling stages over the 2011–2013 period (infilling values from CitationMichel, Citation2016, with volume incertitudes calculated using the method presented by CitationBrasington, Langham, & Rumsby, Citation2003; Interpretative map on the Main Map): (i) salt marshes, corresponding to the highest sectors (> +4 m NGF-IGN69) covered with vegetation characterized by fine sediment with high rates of mud (up to 11.3% measured on the front of salt marshes) and CaCO3, are already filled in (very low sediment dynamics) (Z1 ); (ii) two high (+3–4 m NGF-IGN69) sectors are at a final stage of infilling (low sediment dynamics): a sector composed of fine sand, extending from the Maye estuary to Le Crotoy, with high content of mud and carbonate (+0.088 ± 0.17 m3/m2) (Z2 ), and a sector almost devoid of bedforms, with an equivalent rate of fine sand and sand, little mud and carbonate (+0.164 ± 0.17 m3/m2) (Z3 ); and (iii) most of the low areas are currently being filled in (strong sediment dynamics): to the north and south of the bay, two sectors, mainly controlled by wave action, covered with sedimentary bars, one of fine sand with low carbonate (+0.065 ± 0.17 m3/m2) (Z4 ), the other with fine sand to slightly gravelly sand (+0.372 ± 0.17 m3/m2) (Z6 ); in the central part of the Bay, mainly tide influenced, a sector of fine sand covered with fields of hydraulic tidal dunes, with low carbonate content (+0.156–0.249 ± 0.17 m3/m2) (Z5 ), and the area of tidal channel migration made of fine sand (Z7 ). One sector displays a strong dynamic of erosion, corresponding to low areas of coarser sands covered with dune fields, with very low carbonate content, located on the front of the ebb delta (−0.508 ± 0.17 m3/m2) (Z8 ).
4. Conclusion
Sedimentary infilling is a widespread characteristic of estuaries and bays started with the Holocene transgression (e.g. CitationDavis & Fitzgerald, Citation2004; CitationDyer, Citation1986; CitationGreen & MacDonald, Citation2001; CitationHarris, Citation1988; CitationNichols & Biggs, Citation1985; CitationTessier et al., Citation2012). The definition of a morpho-sedimentary and -dynamic zonation of these environments may help conducting a sectoral approach of the characterization and quantification of their infilling dynamics.
In the case of the hypertidal estuary of the Bay of Somme, a zonation is established, based on relationships between sedimentological, morphological and dynamic characteristics of the intertidal area. We observe seven zones showing three different infilling stages, from internal to external locations in the bay: (i) salt marshes filled in with sand and mud (Z1), (ii) high-altitude sectors made of sand and mud at a final stage of infilling (Z2 and Z3), and (iii) zones being currently filled in and displaying a strong sediment dynamics associated with important bedform migration (bars and medium-to-large hydraulic dunes), made of sand and gravelly sand (Z4, Z5, Z6), and channel migration on a sandy seabed (Z7). One zone of low altitude, made of sand with gravel, located on the front of the ebb delta (Z8), is in erosion.
Results of the sectoral approach allow adjustment of monitoring strategies (e.g. airborne LiDAR topography) for this type of infilling bay, restricting monitoring to areas still having an infilling dynamics (Z4–Z8), and ignoring those already filled or at a final stage of infilling (Z1–Z3).
Software
Granush® (SHOM) was used to calculate the sedimentological parameters and weight percentages of the different sedimentary classes, and to define the sedimentary typology according to the classification of CitationFolk (Citation1965). ‘ParamDunes’ software (SHOM) was used for automatic digitizing of the crests of hydraulic dunes, based on the DEM of 1 April 2013 LiDAR topography. Sedimentological and morphological information was integrated into ArcGIS10 (© ESRI) to create all maps, including shapefiles, rasters, DEMs and DODs. Finally, Adobe® Illustrator® CS6 Tryout (© Adobe Systems Inc.) was used to design the final version of maps and figures.
Morpho-sedimentary and -dynamic characteristics of the Bay of Somme
Download PDF (14 MB)Acknowledgements
The authors thank the colleagues from the M2C Laboratory who helped collecting the sediment data and the operational team CIRCLE who acquired and processed the LIDAR data. The Bay of Somme is a site of the SNO DYNALIT, from which they received support. The paper and the map benefited greatly from reviews by J. Abraham, B. J. Todd and F. Mascioli, and helpful suggestions from editors M. J. Smith and T. Piacentini.
Disclosure statement
No potential conflict of interest was reported by the authors.
ORCID
Sophie Le Bot http://orcid.org/0000-0003-0058-5953
Stéphane Costa http://orcid.org/0000-0001-9347-3920
Carole Dubrulle-Brunaud http://orcid.org/0000-0002-5084-1479
Robert Lafite http://orcid.org/0000-0002-9828-4018
Additional information
Funding
Related Research Data
References
- Anthony, E. J. (2002). Long-term marine bedload segregation, and sandy versus gravelly Holocene shorelines in the eastern English channel. Marine Geology, 187(3–4), 221–234. doi: 10.1016/S0025-3227(02)00381-X
- Berné, S., Allen, G., Auffret, J.-P., Chamley, H., Durand, J., & Weber, O. (1989). Essai de synthèse sur les dunes hydrauliques géantes tidales actuelles [Synthesis essay on current giant hydraulic tidal dunes]. Bulletin de la Société Géologique de France, 6, 1145–1160.
- Bokuniewicz, H. J., Gordon, R. B., & Kastens, K. A. (1977). Form and migration of sand waves in a large estuary, long Island sound. Marine Geology, 24, 185–199. doi: 10.1016/0025-3227(77)90027-5
- Boyd, R., Dalrymple, R. W., & Zaitlin, B. A. (1992). Classification of clastic coastal depositional environments. Sedimentary Geology, 80(3–4), 139–150. doi: 10.1016/0037-0738(92)90037-R
- Brasington, J., Langham, J., & Rumsby, B. (2003). Methodological sensitivity of morphometric estimates of coarse fluvial sediment transport. Geomorphology, 53(3–4), 299–316. doi: 10.1016/S0169-555X(02)00320-3
- Dalrymple, R. W. (1984). Morphology and internal structure of sandwaves in the Bay of Fundy. Sedimentology, 31, 365–382. doi: 10.1111/j.1365-3091.1984.tb00865.x
- Davis, R. A., & Fitzgerald, D. M. (2004). Beaches and coasts (1st ed., 432 pp.). Malden, MA: Wiley-Blackwell.
- Desprez, M., Olivesi, R., Duhamel, S., Loquet, N., & Rybarczyk, H. (1998). L’ensablement en baie de somme: évolution physique, conséquences biologiques et perspectives d'aménagements [Silting in the Bay of Somme: Physical evolution, biological consequences and development perspectives]. In C. Auger & J.-L. Verrel (Eds.), Les estuaires franc̦ais : évolution naturelle et artificielle. Quel avenir pour leur zone d'intérêt biologique ? (pp. 279–287). Brest: IFREMER.
- Dupont, J.-P. (1981). Relations entre Bios et Phénomènes sédimentaires intertidaux : le modèle de la Baie de Somme [Relations between Bios and intertidal sedimentary phenomena: the Bay of Somme model] (Thèse de doctorat) [Unpublished doctoral dissertation] (417 pp.). Université de Rouen.
- Dyer, K. R. (1986). Coastal and estuarine sediment dynamics (358 pp.). Chichester: Wiley.
- Ferret, Y., Le Bot, S., Tessier, B., Garlan, T., & Lafite, R. (2010). Migration and internal architecture of marine dunes in the eastern English channel over 14 and 56 year intervals: The influence of tides and decennial storms. Earth Surface Processes Landforms, 35(12), 1480–1493. doi: 10.1002/esp.2051
- Folk, R. L. (1965). Petrology of sedimentary rocks (159 pp.). Austin, TX: Hemphill.
- Folk, R. L., & Ward, W. C. (1957). Brazos River bar [Texas]; a study in the significance of grain size parameters. Journal of Sedimentary Research, 27(1), 3–26. doi: 10.1306/74D70646-2B21-11D7-8648000102C1865D
- Gibbard, P. L., & Lautridou, J.-P. (2003). The Quaternary history of the English channel: An introduction. Journal of Quaternary Science, 18(3–4), 195–199. doi: 10.1002/jqs.743
- Green, M. O., & MacDonald, I. T. (2001). Processes driving estuary infilling by marine sands on an embayed coast. Marine Geology, 178(1–4), 11–37. doi: 10.1016/S0025-3227(01)00188-8
- Harris, P. T. (1988). Large-scale bedforms as indicators of mutually evasive sand transport and the sequential infilling of wide-mouthed estuaries. Sedimentary Geology, 57(3–4), 273–298. doi: 10.1016/0037-0738(88)90034-6
- Hoche, M. A., Garlan, T., & Thomas, L. (2006). Logiciel de calcul des paramètres morphologiques des dunes à partir des données bathymétriques SMF [Software for calculating morphological parameters of dunes from multibeam bathymetric data] (Report) (24 pp.). Brest: SHOM.
- Jago, C. F. (1980). Contemporary accumulation of marine sand in a macrotidal estuary, southwest Wales. Sedimentary Geology, 26(1–3), 21–49. doi: 10.1016/0037-0738(80)90004-4
- Jarvis, J., & Riley, C. (1987). Sediment transport in the mouth of the Eden estuary. Estuarine, Coastal and Shelf Science, 24(4), 463–481. doi: 10.1016/0272-7714(87)90128-4
- Langhorne, D. N. (1973). A sandwave field in the outer Thames estuary, Great Britain. Marine Geology, 14(2), 129–143. doi: 10.1016/0025-3227(73)90056-X
- Loquet, N., Rybarczyk, H., & Elkaim, B. (2000). Echanges de sels nutritifs entre la zone côtière et un système estuarien intertidal : La baie de somme (Manche, France). Oceanologica Acta, 23(1), 47–64. doi: 10.1016/S0399-1784(00)00117-1
- Masselink, G., Cointre, L., Williams, J., Gehrels, R., & Blake, W. (2009). Tide-driven dune migration and sediment transport on an intertidal shoal in a shallow estuary in Devon, UK. Marine Geology, 262(1–4), 82–95. doi: 10.1016/j.margeo.2009.03.009
- Michel, C. (2016). Morphodynamique et transferts sédimentaires au sein d’une baie mégatidale en comblement (Baie de Somme, Manche Est). Stratégie multi-échelles spatio-temporelles [Morphodynamics and sediment transfers within a megatidal bay (Bay of Somme, Eastern English Channel). Spatio-temporal multi-scale strategy] (Thèse de doctorat) [Unpublished doctoral dissertation] (325 pp.). Université de Rouen.
- Moore, R. D., Wolf, J., Souza, A. J., & Flint, S. S. (2009). Morphological evolution of the Dee estuary, eastern Irish Sea, UK: A tidal asymmetry approach. Geomorphology, 103(4), 588–596. doi: 10.1016/j.geomorph.2008.08.003
- Nichols, M. M., & Biggs, R. B. (1985). Estuaries. In R. A. Davies (Ed.), Coastal sedimentary environments (2nd ed., pp. 77–186). New York, NY: Springer.
- Paphitis, D., Bastos, A. C., Evans, G., & Collins, M. B. (2010). The English channel (La Manche): Evolution, oceanography and sediment dynamics – a synthesis. In J. E. Whittaker & M. B. Hart (Eds.), Micropalaeontology, sedimentary environments and stratigraphy: A tribute to Dennis Curry (1912–2001) (pp. 99–132). London: Geological Society of London – The Micropalaeontological Society, Special Publications. doi: 10.1144/TMS004.6
- Pedreros, R. (1996). Granush: Logiciel de traitement et de formatage des données granulométriques et microgranulométriques pour leur intégration dans la BDSS [Granush: Software for processing and formatting granulometric and microgranulometric data for their integration in the BDSS] (Report) (34 pp.). Brest: SHOM.
- Psuty, N. P., & Silveira, T. M. (2009). Geomorphological evolution of estuaries : The dynamic basis for morpho-sedimentary units in selected estuaries in the Northeastern United States. Marine Fisheries Review, 71(3), 34–45.
- Syndicat Mixte Baie de Somme Grand Littoral Picard. (2011). Grand Site de France®. Baie de Somme, HS1, 16 pp.
- Tessier, B., Billeaud, I., Sorrel, P., Delsinne, N., & Lesueur, P. (2012). Infilling stratigraphy of macrotidal tide-dominated estuaries. Controlling mechanisms: Sea-level fluctuations, bedrock morphology, sediment supply and climate changes (The examples of the seine estuary and the Mont-Saint-Michel Bay, English channel, NW France). Sedimentary Geology, 279, 62–73. doi: 10.1016/j.sedgeo.2011.02.003
- Todd, B. J., Shaw, J., Li, M. Z., Kostylev, V. E., & Wu, Y. (2014). Distribution of subtidal sedimentary bedforms in a macrotidal setting: The Bay of Fundy, Atlantic Canada. Continental Shelf Research, 83, 64–85. doi: 10.1016/j.csr.2013.11.017
- Verger, F. (1995). Slikkes et schorres, milieux et aménagement. Norois, 42(165), 235–245. doi: 10.3406/noroi.1995.6622
- Verger, F. (2005). Marais et estuaires du littoral français [Marshes and estuaries of the French littoral]. Paris: Belin. 335 pp.