
ABSTRACT
Mapping of urban landscape change in detail scale is a difficult task when analysis is focused on a longer period with little data available. This is also the case of Romanian resort towns, where the latest development replaces former urban structures characterized by lower densities and larger green areas with a new pattern, consisting of more compact districts. The paper focuses on mapping urban change in one of the most popular mountain resorts in Romanian Carpathians, the town of Bușteni (820–980 m), located along the Upper Prahova Valley, at the bottom of Bucegi Massif. This research integrates data from historical aerial photos, photogrammetrically processed (1969) as well as digital orthophotos (2012). For an adequate representation, we created a database containing two vector datasets (buildings), corresponding to both historical moments, in order to calculate the Built-up Index (BI). The change map features, in detail scale, the difference in urban patterns, concerning their spatial distribution and intensity. This type of analysis is a very useful instrument in urban planning, protected area designing and touristic resort development.
1. Introduction
Mapping urban landscape changes based on remote sensing imagery is a common research topic, usually focused on large cities, metropolises or other higher ranked urban systems (CitationModica et al., Citation2012; CitationParece & Campbell, Citation2013; CitationPatti, Citation2017; CitationWu & Zhang, Citation2012). Although less used in the last decades, historical aerial imagery in analogical format is a useful source of information for mapping landscape change (CitationMcNally & McKenzie, Citation2011; CitationRisbol, Briese, Doneus, & Nesbakken, Citation2015). In Romania, this type of analysis was limited to the capital city of Bucharest, in the context of its downtown development between 1966 and 2002 (CitationȘandric, Mihai, Săvulescu, Suditu, & Chițu, 2007), as well as more recently, in the broader context of urban sprawl phenomenon, between 1984 and 2010 (CitationMihai, Nistor, & Simion, Citation2015). Similar case studies integrated historical maps for Sinaia resort (CitationHuzui, Abdelkader, & Patru-Stupariu, Citation2013; CitationPatru-Stupariu, Stupariu, Cuculici, & Huzui, Citation2011) or, in a few rare occurrences, multitemporal aerial imagery for Predeal resort town (CitationMihai, Savulescu, Sandric, & Chitu, Citation2014).
The paper focuses on searching for a solution, by means of detail scale mapping, regarding recent changes in urban landscape (1969–2012) within a representative mountain resort of the Romanian Carpathians. The spatial resolution introduced by aerial images allows the opportunity for mapping such changes at the level of buildings, cadastral units or ownership structures.
Bușteni town (820–980 m altitude) – , is an important resort along the Upper Prahova Valley, located in a small basin spanning 10–11 km across the main valley corridor between Bucegi and Baiu Mountains. This settlement began with a group of small hamlets and inns and developed in a short period of time, after the opening of the Transcarpathian road (1847) and railroad (1879), when timber industry emerged together with the first touristic developments. The political and economic evolution following World War II changed the traditional urban pattern of compact built-up areas and continuous urban structures with districts composed of block of flats and big hotels. After 1990, an intensification of real-estate market investments produced a densely built urban network, which sprawled to the border of the Bucegi Natural Park ().
Figure 1. The study area for Bușteni town, Upper Prahova Valley, Romanian Carpathians.
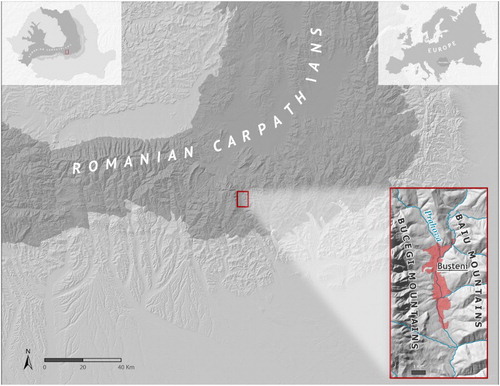
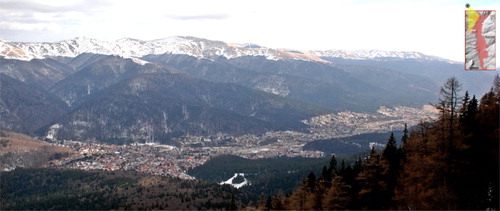
Figure 2. Panoramic view of Bușteni town seen from North West (Photo: B. Olariu, 2017).
The main objective of the current research was the production of a reliable diachronic vector dataset, representing the built-up area included in the actual boundary of Bușteni town, for two reference years (1969, the socialist urban development and 2012, the present-day situation), in order to build a adequate model for spatial analysis.
Large-scale mapping of the urban development phenomenon required the integration of processed photogrammetric data, together with GIS approaches, in order to prepare analytical data layers, which could be further used in urban planning.
2. Materials and method
The main data source was represented by high-resolution aerial imagery (0.5 m), imposed by the limited spatial extension and particularities of the urban study area.
For this approach, we integrated two datasets:
Panchromatic photogrammetric imagery from 1969, in analogical format (23 × 23 cm), produced by the Romanian Topographic Military Directorate (DTM) with a Wild Heerbrugg RC-9 mapping camera. These frames belong to Professor Mihai Grigore, from Faculty of Geography, University of Bucharest.
RGB digital orthophoto imagery from 2012, with 0.5 m spatial resolution, supplied by the National Agency for Cadastre and Land Registration (ANCPI) ().
Table 1. Data sources and their characteristics.
For mapping purposes, we have also integrated basic raster and vector datasets, derived from various sources: Digital Elevation Model (DEM) processed from contour lines, road network and railway mainline extracted from the Open Street Map database (OSM) and enhanced by means of topographic maps and orthophotos, administrative boundary 3rd order for Busteni town (2016) provided by ANCPI.
Methodology includes three levels of data processing. The first one is the digital photogrammetric approach, the second refers to the GIS analysis of diachronic orthophotos and the third consists of the cartographic representation stage.
Photogrammetric data processing: The workflow started with the scanning of hard copy photogrammetric frames at very high resolution (1800 dpi), in greyscale, using a common A3 flat scanner. The interior orientation of images has been reconstructed using the specific camera parameters, the principal point location (PPA) and positions of fiducial marks ().
Figure 3. Flow chart for data processing and analysis.
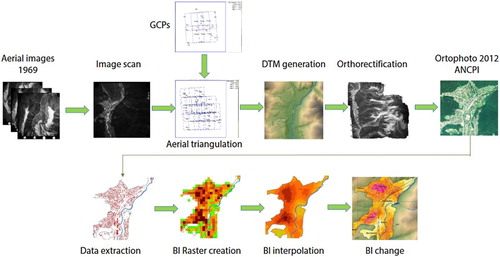
The exterior orientation was based on Ground Control Points (GCPs) extracted from 2012 orthophotos, in a virtual 3D space described by X,Y,Z coordinates and omega (ω), phy (ϕ) and kappa (κ) angles. For aerial triangulation we used common tie points, manually marked on the stereo imagery coverage, which allowed for the bundle adjustment of photogrammetric block and the extraction of a Digital Terrain Model (DTM). Unfortunately, the low quality of these images and the usage of a common scanner resulted in a low-quality DTM, which had to be improved by means of topographic data.
The image orthorectification process, based on the improved DTM, generated an image with uniform scale for the entire area of interest. The RMS (root-mean-square) error between 0.5 and 0.8 m also allowed the integration of both orthophotos into a GIS environment.
GIS spatial data analysis is based on the interpretation (CitationNocerino, Menna, & Remondino, Citation2012) of the two sets of orthophoto imagery (1969 and 2012) and consisted in the extraction of building footprints in vector format, using the national Stereographic 1970 projection (EPSG 31700).
This time difference of more than four decades is superposing on a period of important political, social and economic changes. The state ownership was replaced by private property after 1990, together with the change in urban planning policy, which shifted from central authorities to local decision agents.
The Built-Up Index (BI) was calculated for a network grid with a cell size of 100 m × 100 m, covering a surface of 1 ha (hectare). Each cell was updated with its corresponding building surface value. Taking into consideration the fact that the BI formula represents a ratio between the built-up surface and the reference grid (one hectare), the BI is given by the constructed area. This analysis was applied for both time moments (1969 and 2012), and the polygons were converted to centroid points. This new dataset was geostatistically analyzed for kriging interpolation method with ordinary function, using a semivariogram graph for standard error prediction, which ensured the best fit for the model, with standardized error between −4.7 and 2.8 m. Then the interpolation has been used to convert the vector values into a raster grid, in order to present the continuous distribution of BI for both time moments.
Mapping of urban landscape change (1969–2012): Proceeding with the GIS analysis, we reached the last stage, during which the final map was produced, as a difference of BI rasters for the reference time moments. This calculation returned the changes in spatial distribution of built-up areas for the city of Bușteni. The synthetic BI was correlated in a qualitative formula with the type of urban structures and the relationship with the main transportation axis, as the town developed along a valley passage way. The generalization was focused on the identification of gradual urban pattern densification across different sites.
3. Results and discussion
The cartographic products of the analysis consist of a set of three maps. The first two correspond to the BI maps for the reference time moments: 1969 – the socialist urban development at its full intensity and 2012 – the end of an intensive real-estate market boom, after the systematic recovery of private ownership rights (2001–2009). The third map was produced for a better illustration of urban landscape change. This is a difference map, which illustrates the spatial patterns and the intensity of urban landscape change between 1969 and 2012.
The resulted maps (Main map) show an interesting situation of urban landscape transformation in a changing socio-political context (CitationMihai et al., Citation2016). In 1969, the highest BI values featured limited areas, such as the downtown of Bușteni, because the socialist urban planning policy focused on land use restrictions within built-up areas, manifested through the development of apartment buildings for the industrial working force. Tourist accommodation facilities in Bușteni and along the entire Upper Prahova Valley were limited to a few big hotels and villas.
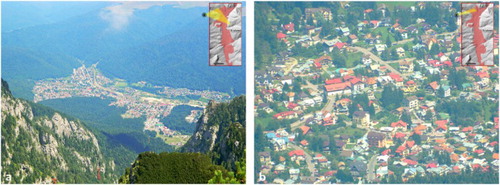
The image from 2012 features a completely different urban configuration. After a decade of real-estate boom (2001 – Law of Private Ownership Recovery), almost all empty land parcels were covered with diverse buildings, mostly villas and small hotels (). The closure of the pulp and paper factory, located inside the city, changed the functionality of this area from industrial to touristic and trading.
Figure 4. (a) Spatial urban sprawl of Bușteni town towards Bucegi Massif. (b) Detail image of Bușteni town (Valea Albă district) (Photo: B. Mihai, 2016).
The map of urban landscape change shows an increase of BI from 0% to 50% for the southern part of the town, between Bușteni – Zamora and Poiana Țapului, on the terraces of Prahova River, where no built-up area was allowed during the socialist period. Another significant increase is located between the downtown and the ski area of Kalinderu, emerged after 2000, with a BI value twice higher than previously. The increase of BI from 0% to 20% is common for the entire mapped area, as an effect of the real-estate market liberalization. The map also features the development of a compact urban structure, at the bottom of the mountain massif, and a structural transformation along the main transportation axis (Bucharest to Brașov highway and railway).
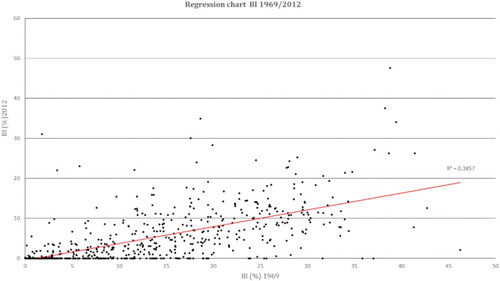
Another approach used to assess changes in the built-up area was to plot the data from both moments in a scatter plot chart (). Data distribution indicates a low statistical correlation of BI variables, with R2 < 0.4, as a consequence of important changes in urban landscape from 1969 to 2012.
Figure 5. Scatter plot chart for BI (1969–2012).
These pattern changes related to built-up areas, which were discovered through diachronic analysis, show an increasing space-absorption tendency in the development of the small town. Most of the modifications that have been made according to change maps were located in the center of Bușteni town and in the western part, close to Bucegi Natural Park. This explains the pressure exerted on the boundaries of this small town, as well as on the limits of neighboring protected nature reserves, which had to change their status several times during the last decade. Therefore, the importance of spatial analysis in the context of urban development is reaffirmed, as there are several environmental incompatibilities and planning issues which require to be considered in the near future.
4. Conclusion
The integration of high-resolution historical photogrammetric imagery in GIS analysis and thematic mapping for urban change studies is indeed a challenge, because the analogical format of this data type introduces a limitation in metadata availability. This kind of analysis is suitable for the evaluation of changes in built-up areas and urban landscapes, providing a good substitute for the lack of highly accurate data.
This research reveals an important change in urban planning patterns, consisting of the replacement of built-up and green areas with recent continuous urban features, along the Prahova River corridor. Observing such changes in built-up areas over time is an important factor for the prediction of urban development and also, for the improvement of urban infrastructure.
Software
For aerial image processing SOCET GXP block triangulation was used, as for the new image-mosaic, the OrthoVista (GISBOX SRL licence). The creation of the database and data processing were performed using ESRI ArcGIS 10.3.1. The cartographic processing was conducted in both ArcGIS software and Inkscape 0.91.
Main_map.pdf
Download PDF (94.9 MB)Disclosure statement
No potential conflict of interest was reported by the authors.
ORCID
Constantin Nistor http://orcid.org/0000-0003-1978-9980
Bogdan-Andrei Mihai http://orcid.org/0000-0002-5834-8697
Bogdan Olariu http://orcid.org/0000-0002-5581-0890
Marina-Ramona Rujoiu-Mare (Vîrghileanu) http://orcid.org/0000-0003-4665-9620
Related Research Data
References
- Șandric, I., Mihai, B. A., Săvulescu, I., Suditu, B., & Chițu, Z. (2007). Change detection analysis for urban development in Bucharest-Romania, using high resolution satellite imagery. Urban Remote Sensing Joint Event. doi: 10.1109/URS.2007.371848
- Huzui, A., Abdelkader, A., & Patru-Stupariu, I. (2013). Analysing urban dynamics using multi-temporal satellite images in the case of a mountain area, Sinaia (Romania). International Journal of Digital Earth, 6(6), 563–579. doi: 10.1080/17538947.2011.642901
- McNally, A. J. D., & McKenzie, S. J. P. (2011). Combining multispectral aerial imagery and digital surface models to extract urban buildings. Journal of Maps, 7(1), 51–59. doi:10.4113/jom.2011.1152. Retrieved from <Go to ISI>://WOS:000290233500006
- Mihai, B., Nedelcu, A., Buterez, C., Cruceru, I., Olariu, B., Rujoiu-Mare, M. R., … Tudose, I. (2016). Județul Prahova. Spațiu, societate, economie, mediu. Bucharest: Romanian Academy Publishing House.
- Mihai, B., Nistor, C., & Simion, G. (2015). Post-Socialist urban growth of Bucharest, Romania – a change detection analysis on landsat imagery (1984–2010). Acta Geographica Slovenica-Geografski Zbornik, 55(2), 223–234. doi:10.3986/AGS.709. Retrieved from <Go to ISI>://WOS:000358541700002
- Mihai, B., Savulescu, I., Sandric, I., & Chitu, Z. (2014). Integration of landslide susceptibility assessment in urban development: A case study in Predeal town, Romanian Carpathians. Area, 46(4), 377–388. doi:10.1111/area.12123. Retrieved from <Go to ISI>://WOS:000345338200004
- Modica, G., Vizzari, M., Pollino, M., Fichera, C. R., Zoccali, P., & Di Fazio, S. (2012). Spatio-temporal analysis of the urban-rural gradient structure: An application in a Mediterranean mountainous landscape (Serra San Bruno, Italy). Earth System Dynamics, 3(2), 263–279. doi:10.5194/esd-3-263-2012. Retrieved from <Go to ISI>://WOS:000328760100014
- Nocerino, E., Menna, F., & Remondino, F. (2012). Multi-temporal analysis of landscapes and urban areas. Xxii Isprs Congress, Technical Commission Iv, 39-B4, 85–90. Retrieved from <Go to ISI>://WOS:000358212000016
- Parece, T. E., & Campbell, J. B. (2013). Comparing urban impervious surface identification using landsat and high resolution aerial photography. Remote Sensing, 5(10), 4942–4960. doi:10.3390/rs5104942. Retrieved from <Go to ISI>://WOS:000328614900011
- Patru-Stupariu, I., Stupariu, M. S., Cuculici, R., & Huzui, A. (2011). Understanding landscape change using historical maps. Case study Sinaia, Romania. Journal of Maps, 7(1), 206–220. doi:10.4113/jom.2011.1151. Retrieved from <Go to ISI>://WOS:000298021000003
- Patti, D. (2017). Metropolitan governance in the peri-urban landscape: The tower of Babel? The case of the Vienna–Bratislava metropolitan region. Planning Practice & Research, 32(1), 29–39. doi: 10.1080/02697459.2016.1146431
- Risbol, O., Briese, C., Doneus, M., & Nesbakken, A. (2015). Monitoring cultural heritage by comparing DEMs derived from historical aerial photographs and airborne laser scanning. Journal of Cultural Heritage, 16(2), 202–209. doi:10.1016/j.culher.2014.04.002. Retrieved from <Go to ISI>://WOS:000351858900008
- Wu, K. Y., & Zhang, H. (2012). Land use dynamics, built-up land expansion patterns, and driving forces analysis of the fast-growing Hangzhou metropolitan area, eastern China (1978–2008). Applied Geography, 34, 137–145. Retrieved from <Go to ISI>://WOS:000306199400014 doi: 10.1016/j.apgeog.2011.11.006