
 ?Mathematical formulae have been encoded as MathML and are displayed in this HTML version using MathJax in order to improve their display. Uncheck the box to turn MathJax off. This feature requires Javascript. Click on a formula to zoom.
ABSTRACT
We present a multi-layer, multi-temporal flood map of the event occurred on December 2013 in Basilicata (southern Italy), documenting the spatial evolution of the inundated areas through time, as well as some ground effects of floodwaters inferred from the imagery. The map, developed within a GIS and consisting of four, 1:20,000 scale, different layers, was prepared using image processing, visual image interpretation and field survey controls. We used two COSMO-SkyMed synthetic aperture radar (SAR) images, acquired during the event, and a Plèiades-1B High-Resolution optical image, acquired at the end of the event. We also used the information derived from the satellite imagery to update some local features of the OpenStreetMap (OSM) geospatial database, and then integrated it within the flood map. A classified multi-temporal dynamic map of inundation and flood effects has been produced in the form of a multi-layer pdf file (Main Map).
1. Introduction
Floods are one of the most important natural hazards because of their social and economic impact all over the world. In the last decades, flood hazard became particularly relevant in many Mediterranean areas (CitationLlasat et al., 2010), including the Basilicata Region in southern Italy (CitationSole, Giosa, & Copertino, 2007), because of climate and land-use changes (CitationCapolongo, Pennetta, Piccarreta, Fallacara, & Boenzi, 2008).
In particular, in Basilicata, the study of the inter-annual variability of precipitation shows an increase in intensity and in frequency of extreme events (CitationPiccarreta, Pasini, Capolongo, & Lazzari, 2013) due to the variation of the length of dry spells (increase) compared to the wet days (decrease). On the other hand, the farming practices and the abandonment of several mechanized-remodeled areas for agriculture have increased the soil erosion and desertification processes, and this results in land degradation by rill networks and gullying, which have a positive feedback on flooding (CitationPiccarreta, Capolongo, Boenzi, & Bentivenga, 2006).
In recent years, flood risk assessment and management have been addressed by the EU Flood Directive, (2007/60/EC, Citation2007), which requires, for each member state, the redaction of hazard maps, the detection of risk areas and finally an effective monitoring and alerting system. For these reasons, interest in mapping inundations and flood geomorphic effects is continuously increasing (CitationSanto, Santangelo, Forte, & De Falco, 2017; CitationSurian et al., 2016; CitationSurian & Rinaldi, 2003).
Recent availability of high-resolution satellite images pushed remote sensing application forward in this field. Great improvement is provided by images acquired in both the optical and microwave range of the electromagnetic spectrum (CitationSkakun, Kussul, Shelestov, & Kussul, 2014). The availability of multi-source, high-resolution remote sensing data poses the problem of how to integrate them in ready-to-use maps. Satellite data, compared with data acquired in situ, can meet broader needs aimed at flood risk detection, flood monitoring and damage assessment (CitationBates, 2004; CitationSanyal & Lu, 2004), especially on large areas (CitationCova, 1999; CitationGitas, Polychronaki, Katagis, & Mallinis, 2008; CitationKhan, 2005; CitationNirupama & Simonovic, 2002; CitationSerpico et al., 2012).
High-resolution optical satellite imagery has been used for flood mapping production (e.g. Sertit Rapid Mapping Service section: http://sertit.u-strasbg.fr; Copernicus Project: http://emergency.copernicus.eu/mapping), although its use is usually limited by cloud cover and nighttime. This problem can be overcome by synthetic aperture radar (SAR) measurements from space, which are independent of daytime and weather conditions. Thanks to its synoptic view (CitationHorritt, Mason, Cobby, Davenport, & Bates, 2003), and the high sensitivity of microwave backscattering to water, that permits discriminating it from land, SAR systems are particularly suitable for flood mapping (CitationPierdicca, Pulvirenti, Chini, Guerriero, & Candela, 2013; CitationPulvirenti, Chini, Pierdicca, Guerriero, & Ferrazzoli, 2011). Furthermore, interferometric SAR (InSAR) coherence analysis is capable of highlighting subtle changes of surface reflectivity between subsequent observations, thanks to the sensitivity of the interferometric phase, and can be of help in discriminating changes due to flood from other types of surface change (CitationGeudtner, Winter, & Vachon, 1996; CitationRefice et al., 2013; CitationRefice et al., 2014).
Many examples of satellite-derived flood extent maps have been published recently (e.g. CitationBellifemine et al., 2010; CitationD’addabbo et al., 2016; CitationKravchenko et al., 2008; CitationKussul et al., 2007; CitationPulvirenti et al., 2011; CitationSchumann, Di Baldassarre, & Bates, 2009; CitationSkakun, 2010), even for small- to medium-sized river catchments, where flooding processes are very fast (CitationBoni et al., 2009). In vegetated areas, SAR data have been used to map flooded forests in temperate regions regardless of season and water stage (CitationTownsend, 2001). Recent studies have shown the efficiency of using satellite images for flood damage assessment also in urban areas with both SAR (CitationMason et al., 2010) and optical satellite imagery (CitationZhang, Zhu, & Liu, 2014).
Optical images can be useful to assess sediment transfer processes (e.g. erosion and deposition), allowing to mainly focus on the post-flood investigation, but can also be used as an indication of the local runoff generation (CitationGaume & Borga, 2008).
We present here a multi-temporal inundation map for the flood event occurred in December 2013 in Basilicata [Main Map]. We used two COnstellation of Small Satellites for Mediterranean Basin Observation (COSMO-SkyMed), stripmap, high-resolution (3 m) SAR images, and a Plèiades-1B High-Resolution (0.5/2 m, PAN/XS) optical image, acquired during and at the end of the flooding event, to map the evolution of the inundation through time, as well as its ground effects.
The ground effects areas were identified by visual interpretation of the optical image. We also included data on the elements at risk of the area, updating the OSM open-access database, and then integrating it in our ground effects map layer, to visualize infrastructures most affected by runoff and sediment dynamics during the flood event. The map layer was prepared in order to show the sediment transfer processes related to the flood event and to determine, as precisely as the resolution allows, the spatial distribution of the ground effects (e.g. sediment erosion and deposition) on the river bed and floodplain.
2. Study area and flood event
The study was conducted in an area of the Metaponto floodplain, in the southeastern part of the Basilicata region, which spans a stripe of about 40 km across the Ionian coast, covering part of the Sinni and of the Bradano river catchments. The area covers most of the wide coastal plain representing the terminal sector of all the main Basilicata river basins, which flow into the Ionian Sea ().
Figure 1. (A) Location of study area, within an overview map of Italy, annotated upon a 40 m Digital Terrain Model (DTM) hillshade (available as WMS Display Services from http://www.pcn.minambiente.it); the yellow rectangle delimits the detail map area. (B) Detail map, annotated upon a false-color hillshade of a Shuttle Radar Topography Mission (SRTM), 90 m DEM (available from CGIAR Consortium for Spatial Information – CGIAR-CSI); the red rectangle delimits the study area.
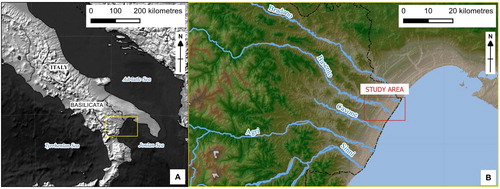
From a geologic perspective, the study area lies on the eastern side of the Bradanic Trough (BT), facing the Ionian Sea. The BT is a wide depression (CitationRicchetti, 1980), elongated from North West (NW) to South East (SE), between the southern Apennines at South West (SW), and the ‘Murge’ relief at North East (NE). This tight Plio-Pleistocene sedimentation basin, 200 km long and from 5–20 to 50–60 km wide, is filled by a massive Plio-Pleistocene sedimentary sequence, up to 2–3 km thick, and by Holocene and recent alluvial deposits that testify that this area has experienced recurrent flooding at least in the past 4000 years (CitationPiccarreta, Caldara, Capolongo, & Boenzi, 2011).
The outcropped part of the BT succession is made up of lowland middle Pleistocene offshore silty clays (CitationCiaranfi, Marino, Sabato, D’Alessandro, & De Rosa, 1996), covered locally by coarse-grained coastal and continental deposits, known as ‘regressive coastal deposits of the Bradanic Trough’ (CitationPieri, Sabato, & Tropeano, 1996). These regressive deposits diachronously developed onto the south Apennines clays formation (CitationTropeano, Sabato, & Pieri, 2002), forming the well-known staircase of marine-terraced deposits of the Metaponto area (CitationCilumbriello et al., 2010; CitationCilumbriello, Tropeano, & Sabato, 2008) in the southernmost sector of the BT.
From the geomorphological point of view, the Metaponto plain extends inland for about 4–4.5 km. Its Eastern part is characterized by extensive flat surfaces, corresponding to marine terraces. The latest terraces, i.e. those at lower altitudes, are gently sloping towards the sea, dissected by both the wide river valleys and smaller, narrow and deep tributaries. Upstream, terraces are more engraved, and the higher ones have a limited extension (CitationPescatore et al., 2009). Hills, stretched in the NW-SE direction, dominate the northeastern part of the landscape, whose tabular top consists of regressive conglomeratic-sandy Plio-Pleistocene cycle sediments, while slopes consist of clay and gray-blue marl deposits, widely affected by instability and gully erosion landslide phenomena. The rivers are Mediterranean type streams, characterized by dry summers and winter floods. Recently, due to climate change, the area was impacted by autumn and/or spring flash floods (CitationPiccarreta, Capolongo, Miccoli, & Bentivenga, 2012), some of which source from the Apennines, while others flow from the BT.
At present, the area is affected by intense anthropogenic activities, causing the dismantling of wide sectors of shore and sand dunes, thus modifying the natural environment.
Several flood events occurred in the last years in the Basilicata region and, in particular, in its coastal area on the Jonian Sea, due to its intrinsic lithological (CitationBoenzi et al., 2008) and geomorphological (CitationBentivenga, Capolongo, Palladino, & Piccarreta, 2015) properties.
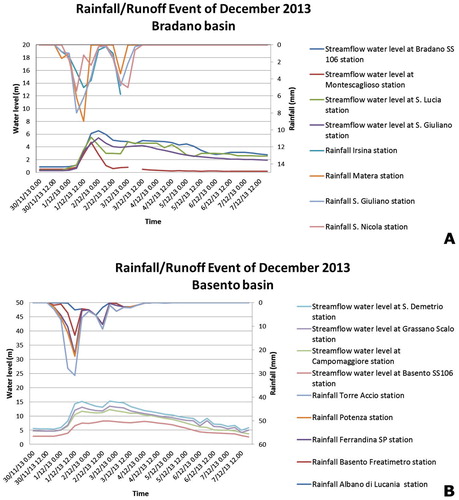
In particular, between 30 November and 7 December 2013, the whole Basilicata region was hit by heavy and persistent rainfall, as confirmed by rainfall and runoff data acquired by the National Civil Protection (). This meteorological event began on 1–2 December, reaching maximum intensity from 1–3 December; after that, rainfall gradually decreased until 5 December. The runoff data show that stream flow water levels, both in the Bradano and Basento river basins, recorded a sharp increase on 1 December, reaching up to 15 m in the Basento river and 12 m in the Bradano river. Water levels then gradually decreased in the following days, returning to values, recorded on 7 December, of 5 m in the Basento river basin (Grassano and S. Demetrio river gauges) and 3 m in the Bradano river basin (Bradano SS 106 and S. Lucia river gauges). The high water levels triggered the overflow of the Bradano, Basento, Cavone and Sinni rivers.
Figure 2. Rainfall and streamflow gauge data recorded during the event for the (A) Bradano and (B) Basento river basins.
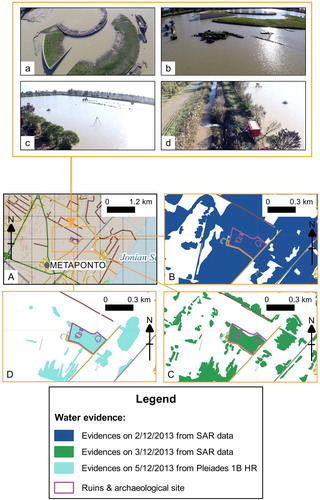
Several main roads were closed, due to mud waves, and the southeastern part of the Basilicata region suffered the most severe flood effects. The towns of Policoro and Metaponto, hosting very important ‘Magna Graecia’ archaeological sites (CitationGioia, Bavusi, Di Leo, Giammatteo, & Schiattarella, 2016), were flooded (). Most of the local farms suffered damages, due to the inundation of their cultivated fields.
Figure 3. (A–D) Flood effects photographs for the inundated Magna Greciae archaeological site of Metaponto (courtesy of Il Quotidiano della Basilicata). (A–D) detail maps of the archeological area inudation during all the observation period: (A) overview location map, highlighting in the yellow rectangle the area of interest detailed in (B–D); (B,C) water evidence, respectively, on 2 and 3 December 2013 from RGB SAR composition, (D) water evidence on 5 December 2013 from Plèiades-1B HR.
Coupled to the heavy rainfall, a sea storm affected Marina di Pisticci and Metaponto Lido, towns located in the coastal area. During 1 December, the sea storm razed a large part of the coast affecting most of the roads and tourist facilities behind the shoreline.
3. Data and methods
3.1. Data availability
The flooded area is partly covered by one Pléiades-1B high-resolution (0.5/2 m) optical image, with an extension of about 200 km2, acquired on 5 December 2013 at 10:05 (). The frame covers the terminal sectors of the Bradano and Basento Rivers, with part of the Jonian coast at East, up to the town of Bernalda at West. A larger area is covered by a series of COSMO-SkyMed stripmap SAR images, acquired with a ground pixel size of approximately 3 m, in the same geometry, polarization (VV) and incidence angle (38°), so that InSAR processing could be performed. The acquisitions were made on 2 and 3 December 2013.
Table 1. Image data availability.
Plèiades 1-B belongs to a satellite constellation composed by two very high resolution satellites. They acquire images in panchromatic and multispectral mode (PAN + XS), at 0.5 and 2 m ground resolution, respectively (http://www.satimagingcorp.com; https://pleiades.cnes.fr).
The COSMO-SkyMed constellation consists of four satellites, each equipped with a high-resolution SAR operating in X band. They have a revisit time potentially less than 12 hours, acquiring images at various resolutions, reaching up to about 1 m in spotlight mode (http://www.asi.it/en/activity/observation-earth/cosmo-skymed).
3.2. Flood map production
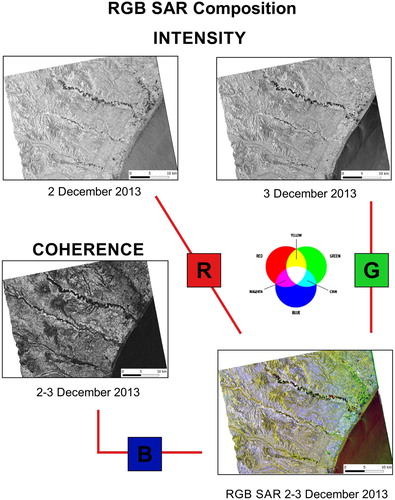
SAR data acquired in the same configuration can be combined coherently into an interferogram. Phase signal visibility is encoded in a quality figure, called coherence, which gives information about the variations occurred in the microscopic arrangement of the individual scatterers composing the scene (CitationBürgmann, Rosen, & Fielding, 2000). SAR interferometric coherence has been proven to be a viable tool to detect subtle changes due to the passage of water on one or both the acquisition dates (CitationGeudtner et al., 1996). To map the inundation time sequence from the SAR data, a red–green–blue (RGB) image has been created, where each of the RGB channels is assigned to a different image as follows: the red channel to the SAR backscatter intensity acquired on 2 December, the green channel to the intensity acquired on 3 December, and the blue channel to the interferometric coherence between the two images (for further details, see CitationRefice et al., 2014). shows the adopted conceptual scheme. Often, pre- or post-flood SAR imagery is used together with acquisitions during the event, to facilitate the recognition of, e.g. permanent water bodies or other areas potentially identified as false positives. In our case, since the small size of the imaged river w.r.t. the SAR resolution does not allow to recognize easily the normal river course in pre-flood images, and no land cover types such as rice paddies or wetlands, which could be flooded for significant periods of time, are present in the area, the utility of such approach would be negligible.
Figure 4. Scheme of the RGB SAR image composition, obtained from the two intensities and the coherence images of the InSAR pair. In the composite image at the bottom-right, areas flooded on 2 December and not on 3 December appear greenish (low red and blue components), areas flooded on 3 December and not on 2 December appear reddish (low green and blue components), while brown-dark areas represent areas affected by the flood event on both days (low R, G and B components).
To map inundated areas on 5 December, the normalized differential vegetation index (NDVI) image, together with the pan-sharpened RGB spectral bands of the Plèiades image, has been considered. The NDVI was computed as defined in CitationRouse, Haas, Schell, and Deering (1973):where
and
are the terrain reflectivities in the infrared and red spectral bands, respectively. Reflectivities were derived from digital numbers, proportional to radiances, through a standard atmospheric correction procedure.
The NDVI image allows to distinguish water-covered areas (in conditions of clean or slightly turbid water) from other land cover classes, thanks to their different response in the red and near-infrared bands. Other indices can be computed from the multispectral bands of the Plèiades image, such as the normalized difference water index (NDWI) (CitationMcFeeters, 1996). NDWI is used to identify water thanks to the difference between the water reflectance in the green band and the one in the NIR band. NDVI is usually exploited to detect vegetation, but it can be useful in water detection (CitationJawak, Kulkarni, & Luis, 2015). In our case, no significant difference could be seen in a map obtained from NDWI than that obtained from the standard NDVI.
To facilitate visual interpretation, a so-called pan-sharpening operation was performed as well, consisting in fusing together the panchromatic high-resolution and the multispectral images from the Plèiades sensor, through the Gram–Schmidt spectral sharpening algorithm (CitationLaben & Brower, 2000), obtaining a pan-sharpened, true-color image at an effective resolution close to that of the panchromatic image, i.e. 0.5 m.
To create the thematic flood maps, all the satellite images were georeferenced and projected in the UTM 33N, WGS84 reference system, and then loaded into the QGIS open source software.
To map the flood using the above-mentioned satellite images, we prepared a grading (classification) map of the apparent ground effects, and a multi-temporal inundation map, using as reference the high-resolution optical image and the RGB image composition of SAR intensities and coherence. Both maps were drawn through visual interpretation of the satellite data. Flood maps at 1:20,000 scale were prepared, digitizing the inundation limits of the coastal sectors of the Bradano and Basento rivers, and their effects. The latter were determined on the Plèiades image with different confidence levels expressing the uncertainties related to potential error sources. The observations and surveys have been conducted at a more detailed scale.
We also made a field campaign after the event, to compare selected mapping details with the terrain reality, in order to infer information about uncertainties. The observations were important to assess flooded areas, especially where the vegetation altered the expected SAR signal response (e.g. vegetated levees), or in case of relatively elevated terraces, which were not inundated, although located in the floodplain areas. The observations and surveys have been reported on the map, at a more detailed scale (up to 1:5000).
3.3. SAR-derived flood layers
To map the evolution of the flood, we analysed intensity and coherence of the COSMO-SkyMed images acquired on the 2 and 3 December 2013, pre-processed using the techniques proposed in CitationRefice et al. (2014). In the RGB composite image, areas flooded on 2 December appear greenish (low red and blue components), while areas flooded only on 3 December appear reddish (low green and blue components). Brown-dark areas represent fields affected by the flood event on both days (low R, G and B components). Using this RGB image as a guide, we digitized flooded areas for each of the two days, creating two flood classes (SAR 2/12/2013 and SAR 3/12/2013).
3.4. Optical-derived flood and ground effects layers
Photo interpretation and detection of the ground effects were made observing flood evidences like traces of water erosion or stagnation on the pan-sharpened Plèiades image and the derived NDVI, described above. We compared the state in which the same areas were before (using as ancillary data a pre-event Worldview image, available through GoogleEarth, and a GeoEye image available through Bing) and after the flood (from the Plèiades image). We mapped the areas affected by inundation evidences, mostly characterized by low values of the NDVI, and geomorphic features like sediment erosion and deposition along the river banks, the riverbed and the floodplain, for the Bradano and Basento rivers. We classified the areas mapped on the optical image into three confidence classes: the first one, named ‘very high confidence’, includes the areas where water was directly observed in the Plèiades image on 5 December. The second confidence class, ‘high confidence’, includes areas in which water was not directly observed, but erosion traces of its passage or stagnation on the ground could be found. Finally, the last class, ‘Medium confidence’, concerns areas where evidences due to the flow or stagnation of water, even if very inconspicuous, are visible only at very large map scales (e.g. 1:5000 or higher).
The ‘very high confidence’ areas are reported in the map layer named ‘Water evidences on 5 Dec 2013’, the other two are in the ‘Ground effects’ map layer.
3.5. Updated base map layers
We included in the maps base vector data, such as administrative limits, archaeological sites and other infrastructures (). We also used the OSM database and amended it with updated observations, involving features such as country lanes and field boundaries, which have been mostly affected by inundations during the flood event.
Table 2. Vector data availability.
In field features in OSM are represented by using ‘tags’, that are pairs of ‘keys’ and ‘values’ (also named KV attributes). The keys describe broad classes of land use features (e.g. aerial way, amenity, barrier, etc.). Each of those keys can be set to one of many possible values, following common-sense or community-driven ontologies (e.g. for the highway key: motorway, trunk, primary, secondary, tertiary, etc.). A full list of features is available at http://wiki.openstreetmap.org/wiki/Map_Features.
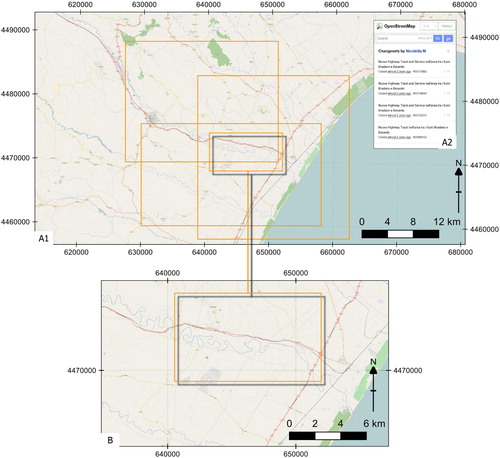
We updated the OSM existing dataset by using a 2012 orthophoto, available as open data at the Italian national geoportal website (http://www.pcn.minambiente.it/GN/), Worldview imagery acquired in 2013 and GeoEye imagery acquired in 2011 (). This update affected mainly the features tagged with the ‘highway’ key, and particularly the ‘track’ and ‘service road’ values. The first feature sub-group (‘track’) includes roads for mostly agricultural or forestry uses, while the second one includes access roads to or within industrial estates, camp sites, business parks, car parks, etc.
Figure 5. (A1) screenshot of the new Track and Service Highway data as visualized in the OSM database, with some of the changes in the database highlighted in the detail inset (A2). (B) Enlargement of the map in (A1) around an area close to the Bradano River (yellow-shaded rectangle in A1). Brown dotted lines represent the track roads, while grey lines represent service roads, mostly hit by flood effects.
4. Results
The multi-layer, multi-temporal flood map shows the spread and evolution of the flood event throughout the river plain, in the period from 2–5 December 2013.
We created an interactive map in the form of a multi-layer pdf file, in order to allow observing simultaneously the various flood evidences and effects. Each layer contains a single feature and can be turned on and off by the user.
The base layer shows the base map as background and contains the map layout and the topography. The other layers can be activated as overlays.
In particular, from the ‘Layer Map’ label (on the left side of the map), the other five levels can be activated, which are, from top to bottom: the ‘OpenStreetMap Data’ level, the ‘Flood effects 5 Dec.’ level, and the three different Water evidence levels, respectively, for 5, 3 and 2 December 2013.
The first level contains mostly OSM vector data (e.g. roads, river, buildings, leisure and archaeological sites, etc.), with other few vector data taken from the Italian ‘Geoportale Nazionale’ site (see par 3.6).
The ‘Flood effects 5 Dec. 2013’ level shows ground effects, at different confidence levels (as reported in the legend below the map) detected after the flood on 5 December 2013.
The last three levels show water evidence on the ground, respectively, for 5, 3 and 2 December.
‘Water evidence 5 Dec’ level shows only the areas with water visually identifiable on the Plèiades image.
‘Water evidence 3 Dec’ and ‘water evidence 2 Dec’ levels show the inundated areas mapped on the RGB combination of the COSMO-SkyMed SAR images.
The possibility of visualizing the layers as transparent overlays makes it possible to follow the evolution of the flood event (activating each layer in sequence), and also the ground effects related to each inundation level. The OSM Data level allows observing the most vulnerable and damaged areas.
5. Discussion
The two SAR acquisitions, together with the optical one, offer a useful observation data set to follow the temporal evolution of the flood wave phenomenon, which was in the peak phase on 2 December and in a decreasing one on the following day, while residual flooded areas and ground effects were still visible on the ground on 5 December. Looking at the maps, a few areas can be noticed which result inundated on 5 December, but are not labelled as flooded on 2 or 3 December. SAR datasets. In our opinion, as these areas presented high coherence (which means that no change occurred during these two days), water traces could be attributed to the peak event beginning on 1 December, as shown by rainfall/runoff basin data (see ).
Our updates to OSM data have been necessary because most of the areas affected by inundation appeared to be agricultural fields or their annexed infrastructures (e.g. paths, tracks and footways). The overlays of the inundated area map and the elements at risk map show how flood has intensely hit the rural countryside.
6. Conclusions
An experimental map is presented, whose aim is to convey to the reader multi-temporal information on flood dynamics and induced ground effects for an extreme event in a semiarid area of Southern Italy.
We created an interactive map in the form of a multi-layer pdf file, in order to observe simultaneously the various layers, as well as flood evidence and effects, for the available dates.
The use of high-resolution remote sensing images and advanced image processing techniques allowed to map three very important kinds of information during the flood event, such as the event dynamics, the elements at risk on the area and the flood effects occurred on the ground. Thanks to an RGB SAR/InSAR composition, NDVI and a pan-sharpened optical image, a precise spatial delineation of the extents of flood effects was possible, differentiating areas which have been flooded in each of the three days, 2, 3, and 5 December 2013.
We believe that such kind of ‘dynamic’ map can convey useful information for flood management, with respect to more traditional products, which are often limited to ground effects mapping or spot eye-witness reports, giving only a partial view of the phenomena.
Disclaimer
This map has been produced only for research purposes and to match only those finalities. It cannot be used with any other aims or in other contexts.
Software
Quantum GIS (QGIS) was used for the digitization of all the features recognized from the satellite data, satellite photointerpretation and cartographic work. The Java OpenStreetMap Editor (JOSM) was used to edit some new OSM base vectors. The latter software is an extensible editor for OSM written in Java, through which users may load GPX tracks, background imagery and OSM data from local sources as well as from online sources, and edit the OSM data (nodes, ways and relations) and their metadata tags. Both tools are distributed as open source and licensed under GPL.
Main Map.pdf
Download PDF (4.5 MB)Acknowledgements
COSMO-SkyMed images are courtesy of the Italian Space Agency (ASI). The authors would like to thank Ing. L. Candela, ASI, for the support of the data acquisition. Interferometric synthetic aperture radar processing was performed by Dr. D. O. Nitti of GAP s.r.l. We thank the editor and P. Matgen, F. Yulianto and B. Cattoor for the useful comments which greatly helped in improving the manuscript and the map.
Disclosure statement
No potential conflict of interest was reported by the authors.
ORCID
Domenico Capolongo http://orcid.org/0000-0002-6685-0177
Alberto Refice http://orcid.org/0000-0003-1895-5166
Francesco Paolo Lovergine http://orcid.org/0000-0002-8084-2122
Annarita D’Addabbo http://orcid.org/0000-0002-3058-5340
Luigi Pennetta http://orcid.org/0000-0002-5043-7222
Related Research Data
References
- Bates, P. D. (2004). Remote sensing and flood inundation modelling. Hydrological Processes, 18(13), 2593–2597. doi: 10.1002/hyp.5649
- Bellifemine, V., Bovenga, F., Candela, L., Nutricato, R., Pasquariello, G., & Refice, A. (2010). Identificazione di aree inondate da immagini SAR a media ed alta risoluzione. Proc. 14a Conferenza Nazionale ASITA (pp. 211–216), Brescia.
- Bentivenga, M., Capolongo, D., Palladino, G., & Piccarreta, M. (2015). Geomorphological map of the area between Craco and Pisticci (Basilicata, Italy). Journal of Maps, 11(2), 267–277. doi: 10.1080/17445647.2014.935501
- Boenzi, F., Caldara, M., Capolongo, D., Dellino, P., Piccarreta, M., & Simone, O. (2008). Late Pleistocene–Holocene landscape evolution in Fossa Bradanica, Basilicata (Southern Italy). Geomorphology, 102(3), 297–306. doi: 10.1016/j.geomorph.2008.03.013
- Boni, G., Candela, L., Castelli, F., Dellepiane, S., Palandri, M., Persi, D., … Versace, C. (2009). The OPERA project: EO- based flood risk management in Italy. Proc. IEEE International Geoscience and Remote Sensing Symposium 2009 (IEEE) (929–932). doi:10.1109/IGARSS.2009.5418250
- Bürgmann, R., Rosen, P. A., & Fielding, E. J. (2000). Synthetic aperture radar interferometry to measure earth’s surface topography and its deformation. Annual Review of Earth and Planetary Sciences, 28(1), 169–209. doi: 10.1146/annurev.earth.28.1.169
- Capolongo, D., Pennetta, L., Piccarreta, M., Fallacara, G., & Boenzi, F. (2008). Spatial and temporal variations in soil erosion and deposition due to land-levelling in a semi-arid area of Basilicata (Southern Italy). Earth Surface Processes and Landforms, 33(3), 364–379. doi: 10.1002/esp.1560
- Ciaranfi, N., Marino, M., Sabato, L., D’Alessandro, A., & De Rosa, R. (1996). Studio geologico stratigrafico di una successione infra e mesopleistocenica nella parte sudoccidentale della Fossa Bradanica (Montalbano Jonico, Basilicata) (in Italian). Bollettino della Società Geologica Italiana, 15, 379–391.
- Cilumbriello, A., Sabato, L., Tropeano, M., Gallicchio, S., Grippa, A., Maiorano, P., … Quarta, G. (2010). Sedimentology, stratigraphic architecture and preliminary hydrostratigraphy of the metaponto coastal-plain subsurface (Southern Italy). Mem. Descr. Carta Geol. d’It. XC, 1, 75–92.
- Cilumbriello, A., Tropeano, M., & Sabato, L. (2008). The Quaternary terraced marine deposits of the Metaponto area (Southern Italy) in a sequence stratigraphic perspective. Advances in Application of Sequence Stratigraphy in Italy, GeoActa Sp. Publ, 1, 29–54.
- Cova, T. J. (1999). GIS in emergency management. In P. A. Longley, M. F. Goodchild, D. J. Maguire, & D. W. Rhind (Eds.), Geographical information systems: Principles, techniques, applications, and management (pp. 845–858). New York, NY: John Wiley & Sons.
- D’addabbo, A., Refice, A., Pasquariello, G., Lovergine, F. P., Capolongo, D., & Manfreda, S. (2016). A Bayesian network for flood detection combining SAR imagery and ancillary data. IEEE Transactions on Geosciences and Remote Sensing, 54(6), 3612–3625. doi: 10.1109/TGRS.2016.2520487
- European Community. (2007). Directive 2007/60/EC of the European Parliament and of the Council of 23 October 2007, on the assessment and management of flood risks (Official Journal of the European Union, L288/27).
- Gaume, E., & Borga, M. (2008). Post-flood field investigations in upland catchments after major flash floods: Proposal of a methodology and illustrations. Journal of Flood Risk Management, 1(4), 175–189. doi: 10.1111/j.1753-318X.2008.00023.x
- Geudtner, D., Winter, R., & Vachon, P. W. (1996). Flood monitoring using ERS-1 SAR interferometry coherence maps. IGARSS ‘96. Proc. of 1996 International Geoscience and Remote Sensing Symposium, 2 (pp. 966–968). IEEE. doi:10.1109/IGARSS.1996.516536
- Gioia, D., Bavusi, M., Di Leo, P., Giammatteo, T., & Schiattarella, M. (2016). A geoarchaeological study of the metaponto coastal belt, Southern Italy, based on geomorphological mapping and GIS-supported classification of landforms. Geografia fisica e dinamica quaternaria, 39, 137–148.
- Gitas, I. Z., Polychronaki, A., Katagis, T., & Mallinis, G. (2008). Contribution of remote sensing to disaster management activities: A case study of the large fires in the Peloponnese, Greece. International Journal of Remote Sensing, 29(6), 1847–1853. doi: 10.1080/01431160701874553
- Horritt, M. S., Mason, D., Cobby, D., Davenport, I., & Bates, P. D. (2003). Waterline mapping in flooded vegetation from airborne SAR imagery. Remote Sensing of Environment, 85(3), 271–281. doi: 10.1016/S0034-4257(03)00006-3
- Jawak, S. D., Kulkarni, K., & Luis, A. J. (2015). A review on extraction of lakes from remotely sensed optical satellite data with a special focus on cryospheric lakes. Advances in Remote Sensing, 4, 196–213. doi: 10.4236/ars.2015.43016
- Khan, S. D. (2005). Urban development and flooding in Houston Texas, inferences from remote sensing data using neural network technique. Environmental Geology, 47(8), 1120–1127. doi: 10.1007/s00254-005-1246-x
- Kravchenko, A. N., Kussul, N. N., Lupian, E. A., Savorsky, V. P., Hluchy, L., & Shelestov, A. Y. (2008). Water resource quality monitoring using heterogeneous data and high-performance computations. Cybernetics and Systems Analysis, 44(4), 616–624. doi: 10.1007/s10559-008-9032-x
- Kussul, N. N., Lupian, E. A., Shelestov, A. Y., Skakun, S. V., Tishchenko, Y. G., & Hluchy, L. (2007). Determination of inundated territories on the basis of integration of heterogeneous data. Journal of Automation and Information Sciences, 39(12), 42–51. doi: 10.1615/JAutomatInfScien.v39.i12.40
- Laben, C. A., & Brower, B. V. (2000). Processing for enhancing the spatial resolution of multispectral imagery using pan-sharpening. US pat. 6011875 A. Retrieved from https://www.google.com/patents/US6011875
- Llasat, M. C., Llasat-Botija, M., Prat, M. A., Porcú, F., Price, C., Mugnai, A., … Nicolaides, K. (2010). High-impact floods and flash floods in Mediterranean countries: The FLASH preliminary database. Advances in Geosciences, 23, 47–55. doi: 10.5194/adgeo-23-47-2010
- Mason, D. C., Speck, R., Devereux, B., Schumann, G. J. P., Neal, J. C., & Bates, P. D. (2010). Flood detection in urban areas using TerraSAR-X. IEEE Transactions on Geoscience and Remote Sensing, 48(2), 882–894. doi: 10.1109/TGRS.2009.2029236
- McFeeters, S. K. (1996). The use of the normalized difference water index (NDWI) in the delineation of open water features. International Journal of Remote Sensing, 17(7), 1425–1432. doi: 10.1080/01431169608948714
- Nirupama, & Simonovic, S. P. (2002). Role of remote sensing in disaster management. ICLR Research Paper Series N. 21. Institute for Catastrophic Loss Reduction, The University of Western Ontarion, Toronto. Retrieved from https://www.eng.uwo.ca/research/iclr/fids/publications/products/remote_sensing2.pdf
- Pescatore, T., Pieri, P., Sabato, L., Senatore, M. R., Gallicchio, S., Boscaino, M., … Capretto, G. (2009). Stratigrafia dei depositi pleistocenico-olocenici dell’area costiera di Metaponto compresa fra Marina di Ginosa ed il Torrente Cavone (Italia meridionale): Carta Geologica in scala 1:25.000 (in Italian). Il Quaternario, 22, 307–323.
- Piccarreta, M., Caldara, M., Capolongo, D., & Boenzi, F. (2011). Holocene geomorphic activity related to climatic change and human impact in Basilicata, Southern Italy. Geomorphology, 128(3), 137–147. doi: 10.1016/j.geomorph.2010.12.029
- Piccarreta, M., Capolongo, D., Boenzi, F., & Bentivenga, M. (2006). Implications of decadal changes in precipitation and land use policy to soil erosion in Basilicata, Italy. CATENA, 65(2), 138–151. doi: 10.1016/j.catena.2005.11.005
- Piccarreta, M., Capolongo, D., Miccoli, M. N., & Bentivenga, M. (2012). Global change and long-term gully sediment production dynamics in Basilicata, Southern Italy. Environmental Earth Sciences, 67(6), 1619–1630. doi: 10.1007/s12665-012-1603-5
- Piccarreta, M., Pasini, A., Capolongo, D., & Lazzari, M. (2013). Changes in daily precipitation extremes in the Mediterranean from 1951 to 2010: The Basilicata region, Southern Italy. International Journal of Climatology, 33(15), 3229–3248. doi: 10.1002/joc.3670
- Pierdicca, N., Pulvirenti, L., Chini, M., Guerriero, L., & Candela, L. (2013). Observing floods from space: Experience gained from COSMO-SkyMed observations. Acta Astronautica, 84, 122–133. doi: 10.1016/j.actaastro.2012.10.034
- Pieri, P., Sabato, L., & Tropeano, M. (1996). Significato geodinamico dei caratteri deposizionali e strutturali della Fossa bradanica nel Pleistocene (in Italian). Mem. Soc. Geol. It., 51, 501–515.
- Pulvirenti, L., Chini, M., Pierdicca, N., Guerriero, L., & Ferrazzoli, P. (2011). Flood monitoring using multi-temporal COSMO-SkyMed data: Image segmentation and signature interpretation. Remote Sensing of Environment, 115(4), 990–1002. doi: 10.1016/j.rse.2010.12.002
- Refice, A., Capolongo, D., Pasquariello, G., D’Addabbo, A., Bovenga, F., Nutricato, R., … Pietranera, L. (2014). SAR and InSAR for flood monitoring: Examples with COSMO-SkyMed data. IEEE Journal of Selected Topics in Applied Earth Observations and Remote Sensing, 7(7), 2711–2722. doi: 10.1109/JSTARS.2014.2305165
- Refice, A., Pasquariello, G., D’Addabbo, A., Bovenga, F., Nutricato, R., Capolongo, D., … Sole, A. (2013). Inundation monitoring through high-resolution SAR/InSAR data and 2D hydraulic simulations. In R. Lasaponara, N. Masini, & M. Biscione (Eds.), Proceedings of the 33rd EARSel Symposium: Towards Horizon 2020 (pp. 15–22).
- Ricchetti, G. (1980). Contributo alla conoscenza strutturale della Fossa bradanica e delle Murge (in Italian). Bollettino della Società Geologica Italiana, 99, 44–430.
- Rouse, W., Haas, R. H., Schell, J. A., & Deering, D. W. (1973). “Monitoring Vegetation Systems in the Great Plains with ERTS.” Proceedings of the 3rd ERTS Symposium (pp. 309–317). NASA SP-351 I.
- Santo, A., Santangelo, N., Forte, G., & De Falco, M. (2017). Post flash flood survey: The 14th and 15th October 2015 event in the Paupisi-Solopaca area (Southern Italy). Journal of Maps, 13(2), 19–25. doi: 10.1080/17445647.2016.1249034
- Sanyal, J., & Lu, X. X. (2004). Application of remote sensing in flood management with special reference to Monsoon Asia: A review. Natural Hazards, 33(2), 283–301. doi: 10.1023/B:NHAZ.0000037035.65105.95
- Schumann, G., Di Baldassarre, G., & Bates, P. D. (2009). The utility of spaceborne radar to render flood inundation maps based on multialgorithm ensembles. IEEE Transactions on Geoscience and Remote Sensing, 47(8), 2801–2807. doi: 10.1109/TGRS.2009.2017937
- Serpico, S. B., Dellepiane, S., Boni, G., Moser, G., Angiati, E., & Rudari, R. (2012). Information extraction from remote sensing images for flood monitoring and damage evaluation. Proceedings of the IEEE, 100(10), 2946–2970. doi: 10.1109/JPROC.2012.2198030
- Skakun, S., Kussul, N., Shelestov, A., & Kussul, O. (2014). Flood hazard and flood risk assessment using a time series of satellite images: A case study in Namibia. Risk Analysis, 34(8), 1521–1537. doi: 10.1111/risa.12156
- Skakun, S. V. (2010). A neural network approach to flood mapping using satellite imagery. Computing and Informatics, 29, 1013–1024.
- Sole, A., Giosa, L., & Copertino, V. (2007). Risk flood areas, a study case: Basilicata Region. in River Basin Management IV. Southampton, UK: WIT Press (WIT Transactions on Ecology and the Environment, Vol. 104) (pp. 213–228). doi: 10.2495/RM070211.
- Surian, N., Righini, M., Lucía, A., Nardi, L., Amponsah, W., Benvenuti, M., … Viero, A. (2016). Channel response to extreme floods: Insights on controlling factors from six mountain rivers in northern Apennines, Italy. Geomorphology, 272, 78–91. doi: 10.1016/j.geomorph.2016.02.002
- Surian, N., & Rinaldi, M. (2003). Morphological response to river engineering and management in alluvial channels in Italy. Geomorphology, 50(4), 307–326. doi: 10.1016/S0169-555X(02)00219-2
- Townsend, P. A. (2001). Mapping seasonal flooding in forested wetlands using multi-temporal radarsat SAR. Photogrammetric Engineering & Remote Sensing, 67(7), 857–864.
- Tropeano, M., Sabato, L., & Pieri, P. (2002). The Quaternary “post-turbidite” sedimentation in the south-Apennines foredeep (Bradanic trough – Southern Italy). Bollettino della Società Geologica Italiana, 121(1), 449–454.
- Zhang, F., Zhu, X., & Liu, D. (2014). Blending MODIS and landsat images for urban flood mapping. International Journal of Remote Sensing, 35(9), 3237–3253. doi: 10.1080/01431161.2014.903351