
ABSTRACT
A detailed snow avalanche susceptibility map of the eastern hillside in the Aramo Range (Cantabrian Mountains) is presented at a scale of 1:25,000. The Aramo Range is one of the major middle-altitude mountains of the Asturian Central Massif. Although it has of moderate height (maximum altitude of 1791 m a.s.l.), its eastern slope presents unusual snow avalanche activity. Specifically, a hundred of snow avalanche tracks have been mapped based on meticulous fieldwork and supported by interviews with local people, searches in newspaper archives, photointerpretation, and calculations based on the digital terrain model and geographic information system. As a result, a susceptibility map has been elaborated, which shows the suitability of combining fieldwork and geographic information technology. The composition consists of two maps that detail how the susceptibility mapping is obtained. The section analysed is limited to the eastern slope of the Aramo Range, whose total surface area is 1555.62 ha.
1. Introduction
Snow avalanches are one of the main processes involved in the dynamics and evolution of mountain environments (CitationButler, 1985; CitationSchweizer, Jamieson, & Schneebeli, 2003). In particular, they have a decisive influence on the landscape of mountain environments, since not only increase the geomorphic processes, but also affect the forest and supra-forest zones of the geoecological belts subjected to their disturbances (CitationBebi, Kulakowski, & Rixen, 2009; CitationBuisson & Charlier, 1989; CitationRixen, Haag, Kulakowski, & Bebi, 2007; CitationSchaerer, 1972). They are also a significant natural risk that endanger the safety of people and the integrity of infrastructures (CitationFuchs & Bründl, 2005; CitationKeiler, 2004; CitationStethem et al., 2003) even in the European middle-altitude mountains, provided there are heavy snowfall and adequate slopes (CitationPoblete Piedrabuena, Beato Bergua, & Marino Alfonso, 2016b).
However, these areas are not well studied and have not received the interest that has been shown for the higher Spanish mountains, especially the Pyrenees (CitationChueca & Julián, 2010; CitationChueca, Julián, & Montañés, 2014; CitationFurdada et al., 1995; CitationJulián & Chueca, 2012; CitationMases & Vilaplana, 1991).
In the Cantabrian Range, there is a regional scale susceptibility map for avalanches in Asturias based on the study of geomorphological features, vegetation cover, and numerical models (CitationMarquínez et al., 2003). Likewise, mention should be made of the work which reveals the need for more detailed analysis such as that carried out in the Alto Sil (CitationSantos, Redondo, Gómez, & González, 2010), the Central Massif of the Picos de Europa (CitationVada, 2011; CitationVada, Frochoso, & Vilaplana, 2012), the Alto Carrión (CitationSerrano, Gómez, & Pisabarro, 2016) and, finally, in the San Isidro Massif (CitationPoblete Piedrabuena et al., 2016b). Also of note is the historical analysis of snow avalanches in the Asturian Massif based on newspaper sources (CitationGarcía-Hernández et al., 2017). Nevertheless, all environmental studies should be based on fieldwork and geomorphological photointerpretation, since they provide essential information that numerical models and historical sources can obviate, especially in the small-area studies (CitationPoblete Piedrabuena, Beato Bergua, & Marino Alfonso, 2016a). This has been shown in CitationBeato Bergua, Poblete Piedrabuena, and Marino Alfonso (2017) that reveal the importance of snow avalanches in the Cantabrian middle-altitude mountains, which participate in the configuration of the landscape, changes in forest structure, and constitute a constant hazard.
In this work, the main aim is the analysis of the susceptibility of snow avalanches on the eastern slope of the Aramo Range, whose results are represented in a detailed mapping made from an exhaustive fieldwork and geographic information technology.
2. Study area
The Aramo Range is situated at the intersection of the 43°16′N parallel and the 5°53′W meridian, and is part of the Cantabrian Mountains (NW Spain). It is a middle-altitude mountain unit located within of the Asturian Central Massif just 20 km southwest of Oviedo (). On the eastern hillside of the Aramo Range (the municipal districts of Morcin and Riosa, Asturias), we have selected an area of 1555.62 ha, between 1600–1500 (slope crest level) and 700 m a.s.l., where the effects of snow avalanche disturbances occur.
Figure 1. Location of the study area. (a) Hypsometric map. (b) Hillshade map on the ortophotography of the east hillside of the Aramo Range.
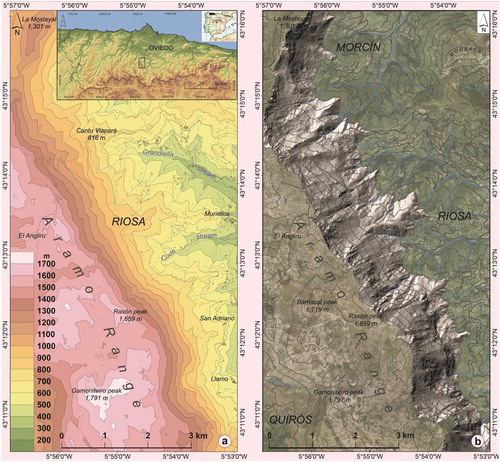
The Aramo Range is a limestone mountain that rises above valleys carved out of erodible siliceous materials, almost all of which are from the Carboniferous period. More precisely, it is a massive wall over 1700 m a.s.l. in altitude (the maximum altitude is the Gamoniterio Peak with 1791 m a.s.l.) that extends as a ridge about 12 km long with a north–south orientation, with two dominant and wide slopes: the western and the eastern. The latter is where snow avalanche disturbances that have been mapped in this paper predominate. Finally, the Aramo Range is crowned by a platform more than 1300 m a.s.l. that has many karst areas and is dominated by grasslands with the occasional shrubs, where livestock grazes in summer. We can observe grazing lands with sheepfold ruins and a large catalog of samples of karstic activity like dry valleys, dolines, pipes, or chimneys, caves, lakes, ponors, and karst springs. The morphogenetic action of the snow has increased the efficiency of the karst processes (nival dolines and nivation niches).
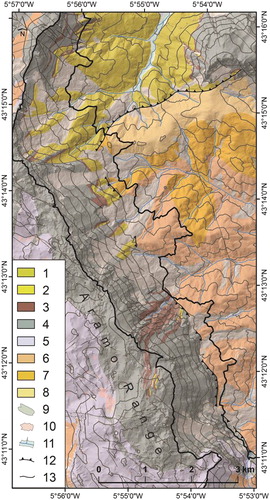
From the geological point of view, the Aramo Range belongs to the Pliegues y Mantos Region, one of the western units of the Cantabrian Zone (CitationLotze, 1945). This sector corresponds to Paleozoic materials with different resistance to erosion, structurally organized by folds and overthrust mantles. The Sobia-Bodón Unit thrust on the Aramo Unit constituting its eastern and southern boundary. On the other hand, the Aramo Unit, composed of overlaying verticalized sheets of Namurian limestones, sometimes folded and later fractured, is thrusting over the Central Coal Basin. Thus, the Aramo Range is hugely elevated over the pre-Stephanian Carboniferous materials (slates and sandstones with limestone and coal strata) by the Aramo Overthrust, which largely justifies the topographical and ecological idiosyncrasy of the eastern slope, and its recent geological and geomorphological history, forms, and processes ().
Figure 2. Geological map. (1) Rañeces-La Vid Group: dolomites, limestones, sandstones, shales and marlstones (Lower Devonian). (2) Ermita Formation: quartzite sandstones, microconglomerates and siltstones (Upper Devonian). (3) Cándamo-Baleas and Alba Formation: limestones (Upper Devonian - Carboniferous). (4) Barcaliente Formation: micritic limestones (Namurian Carboniferous). (5) Valdeteja Formation: bioclastic limestones (Namurian Carboniferous). (6) Lena Group: shales, sandstones, marlstones, limestones and coal (Moscovian Carboniferous). (7) Canales Formation: shales, sandstones and limestones (Moscovian Carboniferous). (8) Mieres Formation: quartzite conglomerates, sandstones, shales and coal. (Moscovian Carboniferous). (9) Mass movements. (10) Debris deposit. (11) Fluvial deposits. (12) Overthrusts. (13) Faults.
In addition, the hillsides are steep, often regularized slopes between rocky escarpments, debris deposits, and mass movements of enormous dimensions that connect with valleys below 400 m a.s.l. The intense snow avalanche activity is partially explained by the hillside slope. More than half of the eastern hillside presents slopes prone to the formation of avalanches that is to say, between 30° and 50°.
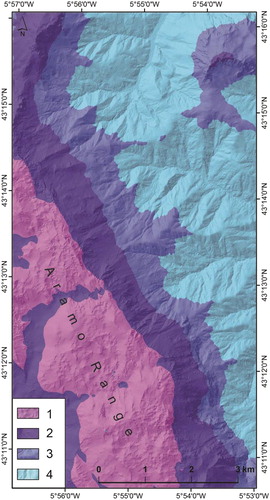
As for the climate, we find typical Atlantic conditions with abundant rainfall (oscillating between 1100 and 1500 mm and well-distributed throughout the year) and mild temperatures (between 6°C and 13°C). However, we can broadly consider three types of climate according to the CitationLópez and López (1959) classification: a climate of transition to fresh (Cfsb3) between 700 and 1000 m a.s.l.; a properly fresh climate (Cfsc) between 1000 and 1500 m a.s.l.; and a cold mountain climate (Dfsc) above 1500 m a.s.l., where there are sub-zero temperatures 3–6 months a year, and half the precipitation is snowfall (CitationMuñoz Jiménez, 1982). In this respect, there are several intense storms during the winter that come mainly from the northwest. Thus, on the eastern slope of Aramo Range, leeward to the snow storms, snow avalanches are trigged annually and there is a permanent snow avalanche risk ().
Figure 3. Climate map. (1) Dfsc: cold mountain. (2) Cfsc: fresh climate. (3) Cfsb3: transition to fresh. (4) Cfb2: temperate.
Asturian mountains are affected annually by four very intense snowstorms, which produce snow cover in the order of 1 m from 980 m a.s.l. upwards. In 2016, for example, 478.3 mm w.e. of snow fell and 7 episodes of snowfall above 30 mm in 72 h occurred (own follow-up of data obtained from the Spanish Meteorological Agency).
3. Materials and methods
The materials used in the making of the map were obtained through of the Spanish National Geographic Institute and consisted of: (i) National Topographic Base at a 1:25,000 scale, vectorial format SHAPEFILE (.shp); (ii) Digital Terrain Model with 5-meter grid spacing, raster format ASCII (.asc) ESRI array; and (iii) 0.5 m pixel, colour digital orthophotography from the Aerial Orthophoto National Program (PNOA) taken from 2011 onwards, ECW format.
We have also used the 1:25,000 Topographic Map (MTN25) printed edition, and black and white aerial photographs at a 1:30,000 scale processed in 1980–1986, all also from the Spanish National Geographic Institute.
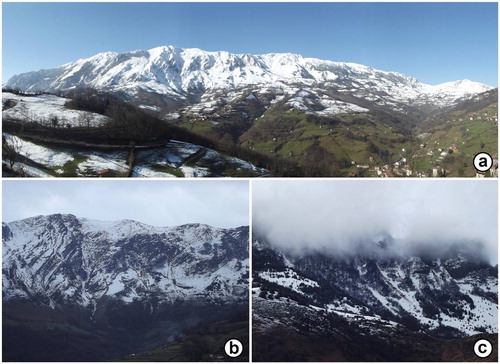
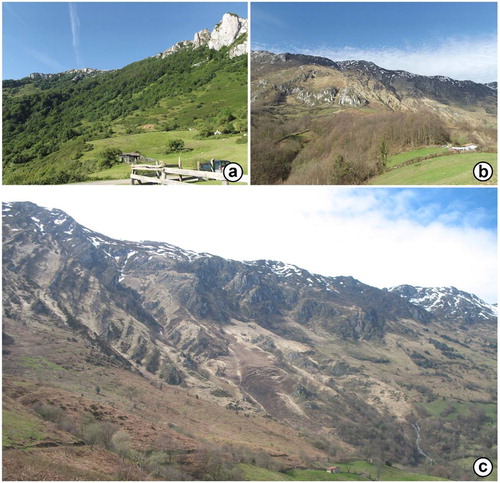
The method employed involved the combination of interviews, field observations, a review of landscape photographs and newspaper sources, together with remote sensing of aerial photos and digital orthophotographs. The fieldwork consisted of using GPS to mark trajectories, and to delineate the forms and locations of avalanche paths, remnants of snow, accumulations of debris, torn or decapitated trees, fragments of scattered trees, and any other evidence of the action of snow ().
Figure 4. (a) The east hillside of the Aramo on February 10, 2015. (b) Snow avalanches in the central sector of the hillside (Riosa) on 22 February 2016 and (c) in the forests of the north zone (Morcín) on 28 January 2015.
The initial scale of the maps was 1:25,000, but the use of GIS and digital cartographic materials of high spatial resolution allowed us to work at scales greater than 1:5000. The digital base was carried out by means of ESRI ArcMap10.1, combining the vectorial topographic base, digital terrain model, digital orthophotomaps, and the GPS information. The resulting cartographical base was then exported to ADOBE Illustrator CS6 to design the composition of the maps in this paper.
4. Cartographic representation
The snow avalanche susceptibility cartography of the eastern hillside of the Aramo Range is made up of two Main Maps and one inset map (the location of the mapped area). The Main Maps are: vegetal formations and documented snow avalanches and snow avalanche susceptibility. In addition, previous maps of aspects and slopes have been made to show the steps in the analysis of this phenomenon, and in drawing up a map of these characteristics from the treatment of the most relevant factors. These maps provide essential information for territorial planning and risk prevention. Of course, the graphical criteria of CitationKrygier and Wood (2011) and CitationOtto, Gustavsson, and Geilhaussen (2011) have been taken into account in order to create order, harmony, and readability.
The formation of snow avalanches largely depends on the steep slopes of this hillside and its leeward situation to the snow storms coming from the northwest. The two most frequent types of avalanche are wet snow avalanches, which channelled along paths as they descend, and loose snow avalanches (sluffs), which occur with high frequency in the section with the highest slope (>50°) as it purges. The interactions between snow avalanches and vegetation are completely clear, and consequently are shown on the vegetation map, which also explains, to a large extent, the current land uses and landscape (CitationBeato Bergua et al., 2017).
On the other hand, with the representation of the documented snow avalanches we wanted to show the meticulous fieldwork and the importance of these snow phenomena in a middle-altitude mountain from the Cantabrian Range, which had not previously been mapped or studied scientifically. Finally, the map of snow avalanche susceptibility generated from the digital terrain model corroborates and completes the information obtained with the fieldwork ().
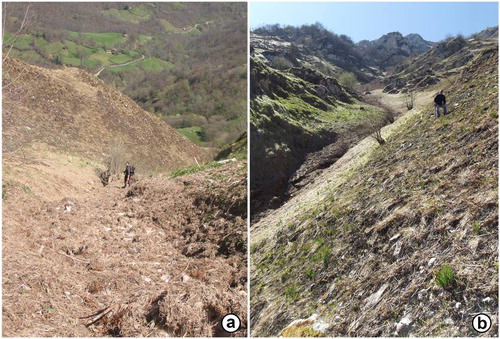
Figure 5. Snow avalanche paths were studied in the field in detail. Avalanche paths (a and b) are geomorphologically active sites. Inside of paths can be appreciated remains of wet snow avalanches.
The aspects map was made by GIS with the Aspect tool from ESRI ArcMap10.1 and the Digital Terrain Model with 5-meter grid spacing from the Spanish National Geographic Institute. With the resolution of this raster, the accuracy for a 1:25,000 scale map is highly satisfactory.
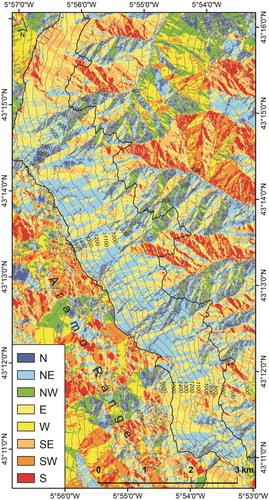
After that, we reclassified the raster in eight categories: North, Northeast, Northwest, East, West, Southeast, Southwest, and South. Warm colours have been used for the southern orientations, cold colours for the northern ones, and two different shades of yellow for the slopes to the West and East. For the altimetry, we used contours with a 100 m interval and contour lines in black; toponymy and spot heights are also included ().
Figure 6. Aspects map.
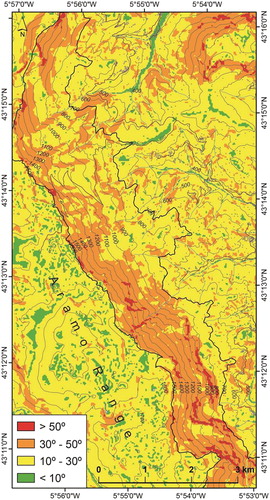
As is well-known, slopes that favour the triggering of snow avalanches range between 30° and 50° (CitationSchweizer et al., 2003). Four types of slopes are represented in this section: green represents the slopes less than 10°; slopes between 10° and 30° are in yellow; the areas with the highest probability of snow avalanches are between 30° and 50° (CitationMarquínez et al., 2003; CitationPoblete et al., 2016b) and are represented in orange; red is used for scarps above 50° where snow can barely accumulate. In this way, numerous purges often occur that trigger snow avalanches below. Almost 60% of the hillside, more exactly 915 ha, has slopes higher than 30°.
The slopes map base was also made by GIS, in this case, from the reclassification of the raster resulting from applying the Slope tool to the Digital Terrain Model. Altimetry, toponymy, and spot heights are represented (). We also include the current hydrographic network, buildings, and roads. A neutral ink (grey) contour line was used for buildings (with a sand colour for filling), brown for roads and blue for rivers, so that they could be represented discreetly, thus facilitating map reading (CitationPoblete et al., 2016a).
Figure 7. Slopes map.
4.1. Vegetal formations map
Forest (viridian green), young forest (glade green), scrubland (lemon curry), grassland with scrubs (moderate apple green), and meadows (khaki) are the five vegetation items mapped. For each of them, we have used the colours mentioned above but have attenuated them to allow the underlying orthophotographic textures to be seen better. In this way, the different plant formations can be appreciated, which grants much more realism to the image. For the delimitation of surfaces, we have used criteria based on percentage of cover (CitationBeato, Marino, & Poblete, 2017; CitationMarino, Beato, & Poblete, 2017) because the vegetal mosaic is so fragmented that the map would be very difficult to read if all the small polygons had been drawn ().
Figure 8. (a) The great fragmentation of the non-arboreous plant formations makes its mapping very difficult. (b) The activity of the snow avalanches also favours this fragmentation, preventing the evolution of the areas of scrubland and forest. (c) In spring, the effects of snow avalanches disturbances are easily distinguished by the brightness of the crushed and burned grass by the snow.
This map includes the snow avalanches documented from our own observations, the landscape photographs collected, and the avalanches mentioned made by the people interviewed, all within the period 2010–2017. Likewise, the geomorphological evidence and the destructive traces of snow action have been used. The representation of the snow avalanches in this map is due to the fact that they constitute one of the main disturbances, the effects of which are seen in the distribution of the vegetal formations. Altogether there are almost 100 avalanche tracks, sometimes solitary, in other cases organized in dendritic and hierarchical networks, located in both forests and pastures. We have represented them with the usual colour for nivo-periglacial phenomena according to the French cartographic system (CitationJoly, 1997), that is to say, violet.
4.2. Snow avalanche susceptibility map
Once the potential areas for the formation of snow avalanches have been identified by GIS, this information has been contrasted with (i) geomorphological evidence and signs of destruction and transport by the snow observed in the fieldwork, (ii) snow avalanches occurred between 2010 and 2017, and (iii) interviews with local people and enquiries in newspaper archives used to elaborate the snow avalanche susceptibility map. We distinguish three types of susceptibility: high, medium, and low. High susceptibility corresponds to areas higher than 1000 m a.s.l., with slopes above 30°, devoid of forest, and where snow avalanches have been observed many times in recent years, even in the forests. We have chosen red for this type, as it is appropriate to all methods of natural risk analysis. More than 20% of the slope examined, more exactly an area of 345.25 ha, is of high susceptibility. Medium susceptibility, coloured orange in accordance with the criteria mentioned earlier, applies to zones over 1000 m a.s.l., with slopes above 30°, scattered trees, and snow avalanches detected by photointerpretation. This covers an area of 12.43 ha. The low susceptibility zones on the hillside are above 900 m a.s.l. and have more than 30° slope, without taken into account the vegetation. They are shown in yellow and are spread over 343.16 ha. In total, more than 45% of the study area has some type of susceptibility (high, medium or low), i.e. can be affected by snow avalanches.
The three types of susceptibility are attenuated to reveal the textures of the hillshade map made from the digital terrain model. We also show the anthropic elements that can be affected by snow avalanches. In particular, buildings are represented in reddish brown, and roads with a brown line. The most important of these is the road that ascends to El Angliru mountain pass, where two people were injured in the 2007 avalanche.
5. Conclusions
This article presents the snow avalanche susceptibility mapping for the eastern hillside of the Aramo Range, where until now this phenomenon had not been studied scientifically. In fact, with few exceptions, the middle-altitude mountains of the Cantabrian Mountain have hardly been analysed from the perspective of snow avalanches and related hazards. This contribution demonstrates that this is a very interesting line of research, and one which should be put into practice in these mountainous environments.
The large number of documented snow avalanches discussed in this paper evidence the potential hazards in the study area, and is explained by the location and the steep slopes, as well as by the maintenance of areas of pastures where tree colonization is practically impossible due to the destructive power of snow avalanches. Because of this, maps of geology, climate, aspects, slopes, vegetation, and documented snow avalanches have been selected for publication to show the importance of these factors and their interaction. Likewise, with each of the maps we wanted to present the different steps undertaken to develop a calculation of susceptibility based on the most relevant factors, giving the present paper a pedagogical value, in addition.
This paper also focuses on the convenience of combining classical fieldwork with the latest technologies such as GIS tools, given that both provide us with essential information for research, mapping, and management. The susceptibility map is a useful tool for effective planning and can serve as a basis for derived maps such as natural risks or landscape protection maps.
Software
The digital cartographic base, the digitalization of documented snow avalanches, and the calculations over the digital terrain model used in the preparation of this map were performed with ESRI ArcMap10.1, while the final design was carried out with the graphic program ADOBE Illustrator CS6.
Snow avalanche susceptibility in the eastern hillside of the Aramo Range (Asturian Central Massif, Cantabrian Mountains, NW Spain).pdf
Download PDF (10.5 MB)Disclosure statement
No potential conflict of interest was reported by the authors.
ORCID
Salvador Beato Bergua http://orcid.org/0000-0001-5538-7685
Miguel Ángel Poblete Piedrabuena http://orcid.org/0000-0003-1030-5310
José Luis Marino Alfonso http://orcid.org/0000-0001-6213-407X
Additional information
Funding
Related Research Data
References
- Beato Bergua, S., Marino Alfonso, J. L., & Poblete Piedrabuena, MÁ. (2017). El paisaje vegetal y los hábitats forestales de interés comunitario en la Montaña Central Asturiana. Cuadernos Geográficos, 56(1), 26–52.
- Beato Bergua, S., Poblete Piedrabuena, MÁ, & Marino Alfonso, J. L. (2017). El efecto de los aludes de nieve en las formaciones vegetales de la vertiente oriental de la Sierra del Aramo (Macizo Central Asturiano). In Naturaleza, Territorio y Ciudad en un mundo global (pp. 70–79). Madrid: Asociación de Geógrafos Españoles. doi: 10.15366/ntc.2017
- Bebi, P., Kulakowski, D., & Rixen, C. (2009). Snow avalanche disturbances in forest ecosystems-state of research and implications for management. Forest Ecology and Management, 257(9), 1883–1892. doi: 10.1016/j.foreco.2009.01.050
- Buisson, L., & Charlier, C. (1989). Avalanche starting-zone analysis by use of a knowledge-based system. Annals of Glaciology, 13, 27–30. doi: 10.1017/S0260305500007588
- Butler, D. R. (1985). Vegetational and geomorphic change on snow avalanche paths, Glacier National Park, Montana, USA. The Great Basin Naturalist, 45(2), 313–317.
- Chueca, J., & Julián, A. (2010). Cartografía de zonas probables de salida de aludes en el Alto Gállego (Pirineo central aragonés) mediante el empleo de Sistemas de Información Geográfica. Cuadernos de Investigación Geográfica, 36(1), 27–41. doi: 10.18172/cig.1225
- Chueca, J., Julián, A., & Montañés, A. (2014). A proposal for avalanche susceptibility mapping in the Pyrenees using GIS: The Formigal-Peyreget area (sheet 145–I; scale 1:25.000). Journal of Maps, 10(2), 203–210. doi: 10.1080/17445647.2013.870501
- Fuchs, S., & Bründl, M. (2005). Damage potential and losses resulting from snow avalanches in settlements of the Canton of Grisons, Switzerland. Natural Hazards, 34, 53–69. doi: 10.1007/s11069-004-0784-y
- Furdada, G., Martí, G., Oller, P., García, C., Mases, M., & Vilaplana, J. M. (1995). Avalanche mapping and related G.I.S. Applications in the Catalan Pyrenees. Surveys in Geophysics, 16, 681–693. doi: 10.1007/BF00665748
- García-Hernández, C., Ruiz-Fernández, J., Sánchez-Posada, C., Pereira, S., Oliva, M., & Vieira, G. (2017). Reforestation and land use change as drivers for a decrease of avalanche damage in mid-latitude mountains (NW Spain). Global and Planetary Change, 153, 35–50. doi: 10.1016/j.gloplacha.2017.05.001
- Joly, F. (1997). Glossaire de géomorphologie. Base de données sémiologiques pour la cartographie. Paris: Armand Colin, 325 pp.
- Julián, A., & Chueca, J. (2012). Mapping of avalanche start zones susceptibility: Arazas basin, Ordesa and Monte Perdido National Park (Spanish Pyrenees). Journal of Maps, 8(1), 14–21. doi: 10.1080/17445647.2012.668414
- Keiler, M. (2004). Development of the damage potential resulting from avalanche risk in the period 1950–2000, case study Galtür. Natural Hazards and Earth System Science, 4, 249–256. doi: 10.5194/nhess-4-249-2004
- Krygier, J., & Wood, D. (2011). Making maps: A visual guide to map design for GIS. New York, NY: The Guilford Press, 256 pp.
- López, J., & López, A. (1959). El clima de España según la clasificación de Köppen. Estudios Geográficos, 75, 167–188.
- Lotze, F. (1945). Zur Gliderung der Varisziden der Iberischen Meseta. Geotekt. Forsch, 6, 78–92.
- Marino Alfonso, J. L., Beato Bergua, S., & Poblete Piedrabuena, MÁ. (2017). El patrimonio vegetal en los Arribes del Duero zamoranos: las formaciones de enebral Juniperus oxycedrus L. subsp. badia (H. Gay) Debeaux. Cuadernos Geográficos, 56(3), 90–115.
- Marquínez, J., Menéndez, R., Lastra, J., Fernández, E., Jiménez-Alfaro, B., Wozniak, E., … Adrados, L. (2003). Riesgos naturales en Asturias. Oviedo: Indurot, Universidad de Oviedo & KRK Ediciones.
- Mases, M., & Vilaplana, J. M. (1991). Zona de aludes en la Vallferrera: Clasificación y riesgo geomorfológico. Pirineos, 138, 39–52. doi: 10.3989/pirineos.1991.v138.188
- Muñoz Jiménez, J. (1982). Geografía de Asturias. Tomo I. Geografía Física. El relieve, el clima y las aguas. Oviedo: Ayalga.
- Otto, J.-C., Gustavsson, M., & Geilhaussen, M. (2011). Cartography: Design, symbolisation and visualisation of geomorphological maps. In M. J. Smith, P. Paron, & J. S. Griffiths (Eds.), Geomorphological mapping: Methods and applications (pp. 253–295). London: Elsevier. doi: 10.1016/B978-0-444-53446-0.00009-4
- Poblete Piedrabuena, M. Á., Beato Bergua, S., & Marino Alfonso, J. L. (2016a). Landforms in the Campo de Calatrava Volcanic field (Ciudad Real, Central Spain). Journal of Maps, 12(S1), 271–279. doi: 10.1080/17445647.2016.1195302
- Poblete Piedrabuena, M. Á., Beato Bergua, S., & Marino Alfonso, J. L. (2016b). Los aludes de nieve en el Alto Aller: su incidencia en la carretera AS-253 del Puerto de San Isidro (Macizo Central Asturiano). In J. J. Durán, M. Montes, A. Robador, & Á Salazar (Eds.), Comprendiendo el relieve: del pasado al futuro (pp. 751–758). Madrid: Instituto Geológico y Minero de España.
- Rixen, C., Haag, S., Kulakowski, D., & Bebi, P. (2007). Natural avalanche disturbance shapes plant diversity and species composition in subalpine forest belt. Journal of Vegetation Science, 18, 735–742. doi: 10.1111/j.1654-1103.2007.tb02588.x
- Santos, J., Redondo, J. M., Gómez, A., & González, R. B. (2010). Los aludes de nieve en el Alto Sil (Oeste de la Cordillera Cantábrica, España). Cuadernos de Investigación Geográfica, 36(1), 7–26. doi: 10.18172/cig.1224
- Schaerer, P. A. (1972). Terrain and vegetation of snow avalanche sites at Roger Pass, British Columbia. In O. Slaymaker & H. J. McPherson (Eds.), Mountain geomorphology: Geomorphological processes in the Canadian Cordillera (pp. 215–222). Vancouver, BC: Tantalus Research Ltd. Edition.
- Schweizer, J., Jamieson, J., & Schneebeli, M. (2003). Snow avalanche formation. Reviews of Geophysics, 41(4), 2–25. doi: 10.1029/2002RG000123
- Serrano, E., Gómez, M., & Pisabarro, A. (2016). Nieve y riesgo de aludes en la montaña cantábrica: el alud de Cardaño de Arriba, Alto Carrión (Palencia). Polígonos. Revista de Geografía, 28, 239–264. doi: 10.18002/pol.v0i28.4295
- Stethem, C., Jamieson, B., Schaerer, P., Liverman, D., Germain, D., & Walker, S. (2003). Snow avalanche hazard in Canada – a review. Natural Hazards, 28, 487–515. doi: 10.1023/A:1022998512227
- Vada, J. A. (2011). Estimación del riesgo de aludes en el PR-PNPE 21: Vega de Urriellu, macizo Central de los Picos de Europa. In P. Martínez (Ed.), Actas de las IV Jornadas Técnicas de Nieve y Aludes - Homenaje a Xavier Bosch i Martí (pp. 61–64). Vielha.
- Vada, J. A., Frochoso, M., & Vilaplana, J. M. (2012). Evaluación y cartografía del riesgo de aludes en el camino PR-PNPE 21 de acceso a la Vega de Urriellu, Picos de Europa (noroeste de España). Cuaternario y Geomorfología, 26(1–2), 29–47.