
ABSTRACT
This paper and accompanying maps focus on a land suitability assessment of the Olomouc region in the Czech Republic. All results were calculated in Urban Planner, a model designed by the authors of this paper. The method of calculation is based on a multi-criteria analysis (weighted overlay method), respects the principles of sustainable development, and allows for execution of several scenarios. The main result of this work is a set of maps. The first map sheet shows the land suitability for housing, recreation, public services, heavy industry, light industry, and transportation. The second map sheet consists of four maps showing different scenarios of land suitability for housing: one map showing the evaluation of existing proposals for housing from urban plans, and one map showing optimal areas for housing calculated by the Urban Planner model. The maps can be used as a significant source of information about the suitability of development in the Olomouc region in geographic or urban studies, both for experts and the general public. All thematic maps are on the scale of 1:125,000; supplementary maps are smaller.
1. Introduction
Land suitability is mostly defined as the appropriateness of land for certain uses (CitationGong, Liu, & Chen, 2012). Some authors spread this concept by a land suitability assessment (CitationHopkins, 1977). Most of the published works (e.g. CitationYang et al., 2008; or CitationQuinn, Schiel, & Caruso, 2014) address this multi-criteria analysis through an analytic hierarchy process (AHP). Many papers focus on improvements in the AHP method (e.g. CitationDiao & Xiang, 2007; CitationJoerin, Thériault, & Musy, 2001) or on the application of AHP to new research fields (e.g. CitationGong et al., 2012).
Czechia and Slovakia have a long tradition of land suitability assessment, especially in landscape planning. Several authors have published their contributions to land suitability assessments (e.g. CitationKolejka, 1992; CitationMiklós, 1991; or CitationŠpulerová et al., 2013). The research published by CitationMiklós (1991) even became the most used methodology for land suitability assessment (methodology LANDEP – LANDscape-Ecological Planning). However, no similar methodology focusing on urban planning was developed and published in Czechia.
The majority of urban planners still use geospatial technologies to a very limited extent, often as tools for visualization or simple analysis. Only a limited number of scientific papers include the description of the specific tool (add-in or extension) that can be applied at a practical level for urban planning (e.g. CitationMalczewski, 2004, Citation2006; CitationMendoza, 2000). None of the published approaches to land suitability assessment were applied to the complete datasets that are used in the actual planning process. Almost all authors suggest their own defined factors for land suitability assessment, and their connection with the real planning processes, as guided by law (Ministry of Regional Development of Czech Republic, Citation2006a), is very poor. For these reasons, the main improvements put forth in this paper are the use of the Urban Planner model presented with a case study using a complete and real database for urban planning in the Olomouc region (all thematic layers guided by the CitationMinistry of Regional Development of Czech Republic, 2006b). An additional benefit of this paper is the visualization aspect; only a limited number of published papers have focused on the visualization of land suitability (e.g. CitationQuinn et al., 2014; CitationRellini, Pavarino, Scopesi, & Zotti, 2011; CitationStanchi et al., 2013). Well-designed maps can provide a more detailed and accurate background for decision making.
The Olomouc region has been analysed many times before. An analysis of the historical development of this area was described by CitationBurian, Brus, and Vozenilek (2013); methods of visualization of input data were elaborated upon by CitationBurian and Šťávová (2009), CitationBurian, Brychtová, Vávra, and Hladišová (2016), and CitationBurian, Brychtová, and Vávra (2015). However, none of these studies focused on land suitability and scenario modelling for future planning purposes, which are described in this paper. The results presented in this paper can improve the quality of planning processes in the Olomouc region and could become an inspiration for the performance of similar analyses.
2. Methods
All results presented in this paper were calculated in the Urban Planner model. Urban Planner is an analytic extension for Esri ArcGIS for Desktop designed to evaluate land suitability and to detect the most suitable areas for spatial development. The extension uses a multi-criteria analysis, respects the principles of sustainable development, and allows for the creation of several land use and land suitability scenarios. Urban Planner was developed by the authors of this paper, and its technical and methodological core was described in previous publications (CitationBurian, Brus, & Šťastný, 2015; CitationBurian & Šťastný, 2015; CitationBurian, Šťastný, Brus, Pechanec, & Voženílek, 2015).
2.1. Land suitability calculation
The first map, ‘Land suitability of the Olomouc region for urban development in 2016,’ shows the results of the land suitability assessment for six categories of land use (housing, recreation, public services, heavy industry, light industry, and transportation). These categories correspond to the most important categories of land use in Czech urban planning. These categories also represent the default categories for land use in the Urban Planner model. The land suitability calculation was based on the multi-criteria analysis (weighted overlay method) visualized in . An example of the calculation is shown in the supplementary material (Example of modelling – Public services). The spatial resolution for the raster layers was set to 10 m per pixel. The total land suitability (multiple raster layer) was calculated according to the weights set between three classes (the three pillars): ecological, social, and economic. Weights can have values from 0 to 100, and the sum of the weights of all three pillars must be equal to 100. A different set value of the weights allows the creation of different scenarios in land suitability. For all maps presented on the first map sheet, the setting for a sustainable scenario was used. Four other weight settings () used for different scenarios (sustainable, ecological, social, and economic scenario) of the suitability for housing are presented on the second map sheet, ‘Land suitability of the Olomouc region for housing in 2016’. For the map ‘Optimal allocation of areas for housing,’ the sustainable scenario was used.
Figure 1. Scheme of land suitability calculation.
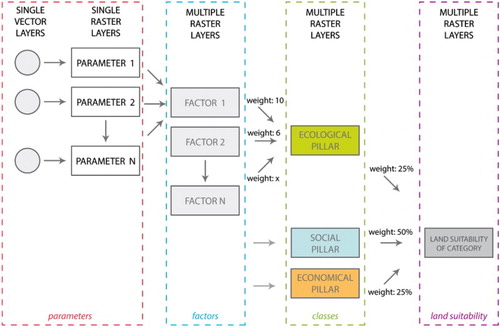
Table 1. Pillar weights for different scenario calculation.
Each of the three pillars (classes) consists of defined factors (). Factors were divided into three groups – positive, negative, and limiting. Positive factors increase the value of land suitability; negative factors decrease this value, and limiting factors eliminate the value of land suitability. The factors were designed after several discussions with urban planners to cover important categories that influence urban development in the Czech Republic. The selection was focused on large-scale spatial data that can be used in the multi-criteria analysis (e.g. economic and demographic data were not included because of their inaccessibility in large detail). Czech regulations (law and methodologies) that delimitate allowed official data sources were considered too. All selected factors follow the standard layer used in a master plan creation.
Table 2. List of input factors and its weights.
As in the case of pillars, the combination of factors is based on a weighted overlay method. For the calculation of land suitability for all categories, the weights of individual factors were set according to . The weights were calculated with the commonly used Saaty’s method (CitationSaaty, 1983), which makes it possible to define the weights for several criteria objectively. This provides a means of breaking down the general method into a hierarchy of sub-problems which are easier to evaluate (CitationAlonso & Lamata, 2006). The criteria are compared in pairs using a predefined scale. The scale is mostly composed of values 1 (equal importance to the compared criteria) to 9 (the first element extremely more important than the second) and their reciprocals (CitationCaha & Burian, 2018). Based on these values pairwise, a comparison matrix is created, and the weights of the individual criteria are calculated.
A total of eight experts (geographers and urban planners from Palacký University Olomouc, Municipality of Olomouc and the Regional Authority of the Olomouc region were asked to use this method to evaluate the weights of all factors. Their results were averaged, and final weights were tested and calibrated in several regions in the Czech Republic (Olomouc region, Ostrava region, Vysocina region, and Prague region). For the final weights (also used in this study), see . Detailed descriptions of the weight calibrations of different regions were published in CitationBurian, Šťastný, et al. (2015), CitationAdamec (2011), CitationDrazna (2014), and CitationDrazna (2016).
The most detailed level of the calculation was setting parameters that can be described as the properties of factors. They are represented by specific layers (shapefiles or feature classes) and their attributes. Parameter values were set up in a range on scales from 0 to 10 (). For ordinal data, a particular value was assigned to the whole phenomenon (e.g. a value of 0 for forest areas, a value of 5 for areas with average radon risk, and a value of 10 for areas with very poor soil quality). For interval data, the values were divided in all value ranges (e.g. gradients, distances). The final results of the land suitability calculations are raster layers for six selected categories of land use (housing, recreation, public services, heavy industry, light industry, and transportation). These results are visualized on the first map sheet and can be used for planning purposes in the Olomouc region. The values of land suitability range from 0 (the lowest suitability) to 100 (the highest suitability). Areas with no values represent places disqualified for suitability due to limits (e.g. flooded areas or protected zones).
Table 3. Parameter setting.
2.2. Optimal land use calculation
The second map sheet (‘Land suitability of the Olomouc region for housing in 2016’) shows different aspects of land suitability for housing in the Olomouc region. Housing was selected as the main issue to be solved in most planning materials in this region. Four different scenarios (sustainable, ecological, social, and economic scenario) of land suitability for housing were calculated by the method described in the previous section. These maps show how the land suitability values can vary according to the changes in weight settings between the three pillars of suitability (economic, ecological, and social). The map ‘Suitability of proposed housing areas’ shows the housing proposal on a background of the sustainable scenario. Urban planners can use this map to evaluate existing plans and to confirm or change their decisions. The resulting decision can also be supported by the values found in the table on the related map sheet. For the last map, ‘Optimal allocation of areas for housing,’ the sustainable scenario of land suitability was also used. The optimal areas for development allocation were also reached using the Urban Planner model through the following procedure ().
Figure 2. Scheme of optimal land use calculation.
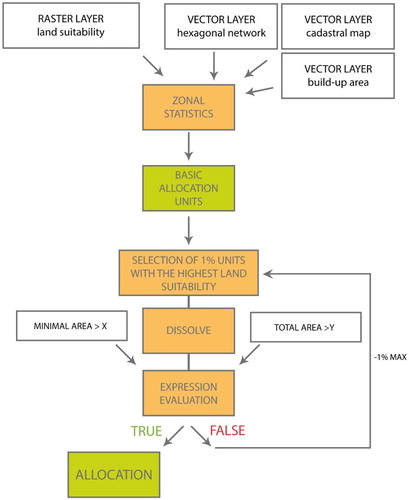
The whole area of interest, represented by a raster layer of land suitability for housing, was covered with a hexagonal vector network. Hexagons were used as they were identified as the optimal shape for delimiting urban areas in the previous research (CitationBirch, Oom, & Beecham, 2007; CitationBurian, Paszto, & Langrova, 2014; CitationPánek, 2018). Built-up areas were eliminated from calculations to ensure that the allocation will be focused only on undeveloped areas. By using zonal statistics, the average value of land suitability was calculated for each hexagonal unit. According to the actual proposal from a master plan, the total area of allocation (equal to amount of land required for housing for each municipality) and the minimum area of allocation (5000 m2) was set up. One percent of units with the highest value of land suitability were selected and combined (dissolve method) into contiguous areas. If the conditions of the minimal and maximal areas of allocation were not fulfilled, the process of unit dissolving was repeated (1% of units with the highest value of land suitability are selected) until the requested values were reached. All polygons calculated by the Urban Planner model are located outside built-up areas, where actual category of land use is ‘bare land.’
The results from optimal land use calculations (allocation) and proposals for a new housing development from all master plans were statistically elaborated (). Basic statistical parameters of land suitability and area were calculated for polygons and for municipalities too (polygons’ values were aggregated to the municipality level). The values of land suitability (average, mean, and maximal) are higher for polygons calculated by Urban Planner (average value of 73.6%) in comparison with proposals from master plans (average value of 67.9%). This also applies to polygons aggregated to the municipality level. Significant differences can be observed for minimal values of land suitability. The lowest value of land suitability for polygons calculated by Urban Planner is 67.4% instead of null value for proposals from the master plans. The reason is that some polygons of proposals (8 of 428) are located in areas with no land suitability caused by hard limits (e.g. flooding areas, high quality of soils, protected areas around power lines). The Urban Planner model does not allow the calculation of optimal areas here, but the master plans’ proposals can be located here (in cases of reasonable exceptions, or negative private or political influence).
Table 4. Statistics of optimal areas (allocation from Urban Planner model) and proposed areas for a new housing development (proposals from master plans).
The area of polygons calculated by Urban Planner differs from the master plans’ proposals. Urban Planner polygons tend to be larger (average value of 22,023 sqm), because continuous and larger polygons are preferred. The average area of polygons aggregated to the municipality level is almost the same for proposals from the master plans and for the results from the Urban Planner calculations. The reason is that the value of the area for each polygon is used as the total value for allocation in the Urban Planner calculation. There are small differences in these values, which are caused by the method of merging hexagonal units to obtain a final polygon of allocation. The difference in area between polygons is also reflected in the total number of polygons (only 374 polygons calculated by Urban Planner in comparison with 428 polygons proposed by the master plans) – see .
Table 5. Comparison between overlapping and non-overlapping polygons proposed for a new housing development.
compares overlaps of polygons calculated by the Urban Planner model and polygons from master plans (proposals for new development). The average value of land suitability of overlapping polygons is very similar (74.4% for the Urban Planner result, 72.4% for proposal from the master plans) but it is different for non-overlapping ones (73.1% for Urban Planner result, 62.9% for proposal from the master plans). It means that some proposals from the master plans for new housing development (203 of 428) are located in the areas with a lower value of land suitability, and only those which overlap with the Urban Planner results have higher land suitability values. The reason is as mentioned above, that the proposals in the master plans are influenced by private and political influences and by some reasonable exceptions. Most of the polygons from the master plan proposal that do not overlap with the Urban Planner results are located in areas with higher soil quality and longer distances from amenities. This causes the lower value of land suitability and eliminates these areas from optimal land use calculation.
3. Conclusion and discussion
This paper describes the application of the Urban Planner model in a land suitability assessment of the Olomouc region. Two map sheets (Main map) show several categories of land suitability and various scenarios of suitability for housing. All results were obtained by the Urban Planner model using a multi-criteria analysis as the main computational method. In this paper, only the final selections and final weights of factors are presented. More detailed discussion of model testing and weight calibration in several regions was previously published (e.g. CitationBurian, Šťastný, et al., 2015; or CitationBurian, Brus, et al., 2015).
The results of the land suitability assessment, as visualized on the maps, have a high potential for use in planning processes. Maps of land suitability can be used for the identification of places with the highest potential for urban development. These were also calculated by Urban Planner and compared with proposals from the master plans. The suitability of polygons calculated by Urban Planner is higher than the suitability of proposal from the master plans. In cases where the proposal from the master plan overlaps with polygons from Urban Planner (52% of all proposals), the suitability is very similar. Non-overlapping proposals have their value of suitability significantly lower (in some case even no value). The reason is that the Urban Planner calculation takes into account all input factors uniformly over the whole region and in some cases land suitability is eliminated (e.g. because of the high quality of soils, flooded areas). On the other hand, the Urban Planner calculations do not consider private ownership and political influences, and that is reflected in the master plan proposal. For these reasons, especially the result can be considered as more objective than the master plan proposals.
Czechia has a long tradition of land suitability assessment and urban planning. However, no computer model that would support real planning processes is currently used. For these reasons, the Urban Planner model was developed, tested, and applied in two cities (Olomouc, Jihlava) and four regions (Olomouc region, Ostrava region, Vysocina region, and Prague region). The results from the Urban Planner model were used in these regions and cities as additional material for decision making in urban planning processes. In most cases, the land suitability of the proposals from the master plan was calculated and compared with the results of the allocation analysis from the Urban Planner model.
Because the model supports the automatic import of all data models used by all Czech urban planning offices (according to the regulations of Act No. 183/2006 Coll., the Construction Act), its practical implementation in any other region is simple and fast. Special aspects of different regions (such as ‘urban region’, ‘rural region’, etc.) can be reflected by slightly different weights of input factors.
Existing proposals from the master plans can be compared with the areas allocated by the Urban Planner model. Several scenarios of land suitability can be used as a basis for discussions about the future development of any region.
All the results presented in this paper were created in close cooperation with the Municipality of Olomouc. Experts from this institution can use the presented results for urban planning purposes, while the same results are also essential for further development of the Urban Planner model. The results presented in this paper can improve the quality of planning processes in the Olomouc region and could become an inspiration for the performance of similar analyses.
Software
All analytical results presented in this paper were calculated in an add-on for ArcGIS for Desktop version 3.1 called Urban Planner. The Urban Planner add-on uses the methods described in this paper.
Spatial data and maps were maintained and created in ArcMap, ArcGIS 10 for Desktop. Final desktop publishing and map sheet design were processed in Adobe Illustrator CS6 and Adobe InDesign CS6.
Data
All data used in this project were provided by the Municipality of Olomouc with an agreement to use them for scientific and publication purposes. Data represent standard data sets used in Czech urban planning. Data are maintained and updated within a two-year period by employees of the Department of Conception and Development of the Municipality of Olomouc. Data were collected according to the regulations of Act No. 183/2006 Coll., the Construction Act, by more than 20 state organizations (Czech Hydrometeorological Institute, Czech Geological Survey, Czech Statistical Office, Czech Office for Surveying, Mapping, and Cadastre, etc.). The spatial accuracy of the data corresponds to the Cadastral Map on the scale of 1:2000. A total of 120 vector layers covering the model factors () were used as the input for land suitability calculations. Data are up-to-date as of 1 January 2016.
EXAMPLE_MAP.pdf
Download PDF (4.8 MB)Land suitability of the Olomouc region for housing in 2016
Download PDF (12.4 MB)Land suitability of the Olomouc region for urban development in 2016
Download PDF (16.8 MB)Disclosure statement
No potential conflict of interest was reported by the authors.
ORCID
Jaroslav Burian http://orcid.org/0000-0003-0729-9757
Alena Vondrakova http://orcid.org/0000-0002-7450-467X
Additional information
Funding
Related Research Data
References
- Adamec, M. (2011). Testování robustnosti extenze UrbanPlanner pro tvorbu scénářů vývoje olomouckého regionu [Testing of Urban Planner extension robustness for creating progression scenarios of Olomouc region]. Olomouc: Palacky University.
- Alonso, J. A., & Lamata, M. T. (2006). Consistency in the analytic hierarchy process: A new approach. International Journal of Uncertainty, Fuzziness and Knowledge-Based Systems, 14(4), 445–459. http://doi.org/10.1142/S0218488506004114
- Birch, C. P. D., Oom, S. P., & Beecham, J. A. (2007). Rectangular and hexagonal grids used for observation, experiment and simulation in ecology. Ecological Modelling, 206(3–4), 347–359. http://doi.org/10.1016/j.ecolmodel.2007.03.041
- Burian, J., Brus, J., & Šťastný, S. (2015). Urban planner-model for land use suitability assessment. In New developments in environmental science and geoscience; proceedings of the international conference on environmental science and geoscience (ESG 2015) (pp. 19–26). Vienna: INASE.
- Burian, J., Brus, J., & Vozenilek, V. (2013). Development of Olomouc city in 1930–2009: Based on analysis of functional areas. Journal of Maps, 9(1), 64–67. http://doi.org/10.1080/17445647.2013.778800
- Burian, J., Brychtová, A., & Vávra, A. (2015). Proposal of urban plan symbology standardization: Olomouc Region case study. In International multidisciplinary scientific GeoConference surveying geology and mining ecology management, SGEM (Vol. 2, pp. 1051–1062). International Multidisciplinary Scientific Geoconference. Retrieved from http://www.scopus.com/inward/record.url?eid=2-s2.0-84946411719&partnerID=tZOtx3y1
- Burian, J., Brychtová, A., Vávra, A., & Hladišová, B. (2016). Analytical material for planning in Olomouc, Czech Republic. Journal of Maps, 12(4), 649–654. doi: 10.1080/17445647.2015.1060177
- Burian, J., Paszto, V., & Langrova, B. (2014). Possibilities of the definition of city boundaries in GIS - The case study of a medium-sized city. In SGEM2014 conference proceedings (Vol. 3, pp. 777–784). http://doi.org/10.5593/SGEM2014/B23/S11.099
- Burian, J., & Šťastný, S. (2015). Urban Planner-ArcGIS extension for land use modelling. In AGILE 2015 -- Lisbon (pp. 1–3). Lisbon: AGILE.
- Burian, J., Šťastný, S., Brus, J., Pechanec, V., & Voženílek, V. (2015). Urban Planner: Model for optimal land use scenario modelling. Geografie, 120(3), 330–353.
- Burian, J., & Šťávová, Z. (2009). The difficulties of using urban plans for cartographers and geoinformatists [Kartografické a geoinformatické chyby v územních plánech]. Geografie, 114(3), 179–191. http://apps.webofknowledge.com/full_record.do?product=WOS&search_mode=CitationReport&qid=3&SID=C2DvU2ACSh4F94std8L&page=1&doc=8
- Caha, J., & Burian, J. (2018). Comparison of fuzzy AHP algorithms for land suitability assessment. In I. Ivan, J. Horák, & T. Inspektor (Eds.), Dynamics in GIscience (pp. 31–46). Cham: Springer. http://doi.org/10.1007/978-3-319-61297-3_3
- Diao, Y., & Xiang, W. N. (2007). How complex can a land suitability map be? International Journal of Geographical Information Science, 21(7), 747–755. http://doi.org/10.1080/13658810600911846
- Drazna, A. (2014). Stanovení vah a parametrů extenze ArcUrban Planner [Determination of the weights and parameters of Arc Urban Planner extension]. Olomouc: Palacky University.
- Drazna, A. (2016). Aplikace fuzzy aritmetiky v multikriteriálním hodnocení krajinného potenciálu [Fuzzy Arithmetics Application in Multicriterial Evaluation of Landscape Potential]. Olomouc: Palacky University.
- Gong, J., Liu, Y., & Chen, W. (2012). Land suitability evaluation for development using a matter-element model: A case study in Zengcheng, Guangzhou, China. Land Use Policy, 29(2), 464–472. http://doi.org/10.1016/j.landusepol.2011.09.005
- Hopkins, L. D. (1977). Methods for generating land suitability maps: A comparative evaluation. Journal of the American Institute of Planners, 43(4), 386–400. http://doi.org/10.1080/01944367708977903
- Joerin, F., Thériault, M., & Musy, A. (2001). Using GIS and outranking multicriteria analysis for land-use suitability assessment. International Journal of Geographical Information Science, 15(2), 153–174. http://doi.org/10.1080/13658810051030487
- Kolejka, J. (1992). Local GIS application in the planning of ecological landscape stability systems. Computers, Environment and Urban Systems, 16(4), 329–335. http://doi.org/10.1016/0198-9715(92)90014-I
- Malczewski, J. (2004). GIS-based land-use suitability analysis: A critical overview. Progress in Planning, 62(1), 3–65. http://doi.org/10.1016/j.progress.2003.09.002
- Malczewski, J. (2006). Ordered weighted averaging with fuzzy quantifiers: GIS-based multicriteria evaluation for land-use suitability analysis. International Journal of Applied Earth Observation and Geoinformation, 8(4), 270–277. http://doi.org/10.1016/j.jag.2006.01.003
- Mendoza, G. (2000). A GIS-based multicriteria approache to land use suitability assessment and allocation. United States Department Of Agriculture Forest Service General Technical Report NC, 89–94.
- Miklós, L. (1991). Morphometric indices of the relief in the LANDEP methods and their interpretation. Ekológia, ČSSR, 10(2), 159–186.
- Ministry of Regional Development of Czech Republic. (2006a). Act No. 183/2006 Coll., Construction Act.
- Ministry of Regional Development of Czech Republic. (2006b). Ministry Decree No. 500/2006 Coll.
- Pánek, J. (2018). Emotional maps: Participatory crowdsourcing of citizenś perceptions of their urban environment. Cartographic Perspectives, 0(90). http://doi.org/10.14714/CP90.1419
- Quinn, B., Schiel, K., & Caruso, G. (2014). Mapping uncertainty from multi-criteria analysis of land development suitability, the case of Howth, Dublin. Journal of Maps, 11(3), 487–495. http://doi.org/10.1080/17445647.2014.978907
- Rellini, I., Pavarino, M., Scopesi, C., & Zotti, M. (2011). Physical land suitability map for Tuber magnatum Pico in Piana Crixia municipality territory (Liguria-Italy). Journal of Maps, 353–362. http://doi.org/Doi10.4113/Jom.2011.1180
- Saaty, T. (1983). Priority setting in complex problems. IEEE Transactions on Enigneering Management, 3, 140–155. doi: 10.1109/TEM.1983.6448606
- Špulerová, J., Dobrovodská, M., Izakovičová, Z., Kenderessy, P., Štefunková, D., & Petrovič, F. (2013). Developing a strategy for the protection of traditional agricultural landscapes based on a complex landscape-ecological evaluation (the case of a mountain landscape in Slovakia). Moravian Geographical Reports, 21(4), 15–26. http://doi.org/10.2478/mgr-2013-0017
- Stanchi, S., Godone, D., Belmonte, S., Freppaz, M., Galliani, C., & Zanini, E. (2013). Land suitability map for mountain viticulture: A case study in Aosta Valley (NW Italy). Journal of Maps, 9(3), 367–372. http://doi.org/10.1080/17445647.2013.785986
- Yang, F., Zeng, G., Du, C., Tang, L., Zhou, J., & Li, Z. (2008). Spatial analyzing system for urban land-use management based on GIS and multi-criteria assessment modeling. Progress in Natural Science, 18(10), 1279–1284. http://doi.org/10.1016/j.pnsc.2008.05.007