
ABSTRACT
In Italy geo-hydrological phenomena are the most common hazards: every year landslides and floods cause damage and fatalities; Genova city is one of the most affected areas. Since 2000 scientific studies have demonstrated an increase in events, due to the rainfall regime variation and to the urbanization. Thematic maps are an essential tool for evaluating the interaction between geomorphological processes and the elements at risk. In the present work, we have prepared an original geo-hydrological phenomena inventory map of Genova at 1:45,000 scale (the ‘A1’ size). The map shows the floodable areas, landslides and deep-seated gravitational slope deformation, the urban fabric and the cultural heritage sites. The map gives an overview of the geo-hydrological phenomena through the integration of the different hazard sources, of the exposed elements and of their spatial distribution, allowing for a first analysis of the risk: in a 240 km2 area, more than 3600 residential buildings are located on the 4 km2 high hazard floodable areas and more than 360 on the about 500 active landslides.
1. Introduction
Geo-hydrological hazards derive from natural earth processes, related to the interaction between meteorological phenomena and the geological environment, which can potentially cause loss of the exposed elements at risk (CitationCanuti, Casagli, Pellegrini, & Tosatti, 2001). Two main categories may be distinguished: landslide and flood hazards. In hilly-mountainous areas, the main phenomena are landslides, often triggered by heavy rainfall events. Floodplains are subjected to inundations and to land subsidence, the latter often associated with aquifer overpumping (CitationCanuti et al., 2001).
In Mediterranean countries, geo-hydrological phenomena presents an influencing factor for economy and, more in general, for the development, both directly and indirectly; besides, it is one of the main causes of causalities and social malaise, similar in numbers to the one related to a continuous and low-intensity war or to road traffic (CitationDe Roo, Barredo, Lavalle, Bodis, & Bonk, 2007; CitationLugeri, Kundzewicz, Genovese, Hochrainer, & Radziejewski, 2010; CitationJaedicke et al., 2014; CitationPrenger-Berninghoff & Greiving, 2015). Geo-hydrological hazards may also represent a risk factor for the landscape and cultural heritage sites (CitationBrandolini, Canepa, Faccini, Robbiano, & Terranova, 2007; CitationFaccini, Piccazzo, Robbiano, & Roccati, 2008; CitationMargottini et al., 2015a; CitationMargottini, Fidolini, Iadanza, Trigila, & Ubelmann, 2015b; CitationNicu, 2017a, Citation2017b).
In Italy, during the last 50 years, landslides caused about 1300 fatalities and flood events more than 700 fatalities (CitationSalvati et al., 2016; CitationGuzzetti & Tonelli, 2004). Basing on data from the Basin Master Plan collected by the Local Authorities, the high or very high-risk flood and landslide areas occupy about 10% of the Italian territory. About 23 million people are exposed to the geo-hydrological hazard (CitationSalvati, Bianchi, Rossi, & Guzzetti, 2010; CitationSalvati et al., 2014).
Liguria is among the most affected regions in the Mediterranean area; starting from the year 2000 an increase of the frequency of geo-hydrological events have been recognized, both for the rainfall regime modification and for the intense urbanization in high-risk areas (CitationFaccini, Robbiano, & Sacchini, 2012; CitationFaccini, Luino, Sacchini, & Turconi, 2015b). From the first registered event in 1646 up to 2016, about 300 fatalities in 245 places in about 100 municipalities have been caused by geo-hydrological events in Liguria; in the last 50 years, landslides caused 37 fatalities and floods more than 80 (CitationSalvati et al., 2016). Some of the more intense events have hit Genova Municipality (CitationFaccini, Luino, Sacchini, Turconi, & De Graff, 2015). In the last 50 years, we can mention: the via Digione landslide, with 19 casualties, the 1970 flood with 44 casualties, the ones in 1992 and 1993 and the more recent in 2010 with one casualty, 2011with 6 casualties and 2014 with 1 casualty (CitationFaccini, Luino, Paliaga, Sacchini, & Turconi, 2015; CitationFaccini, Luino, Sacchini, & Turconi, 2015a; CitationFaccini, Paliaga, Piana, Sacchini, & Watkins, 2016; CitationFaccini et al., 2018; CitationRoccati, Faccini, Luino, Turconi, & Guzzetti, 2018).
Landslides and inundations are widespread in Liguria, cause strong damage and are a serious threat for the population but, surprisingly, the geo-hydrological risk perception is rather low (CitationSalvati et al., 2010, Citation2014).
The right risk perception is crucial in adaptation and risk reduction strategies; trying to fill this gap, the inventory of geo-hydrological phenomena map of Genova Municipality at 1:45,000 scale (the ‘A1’ size) has been prepared. The main purpose is to give a tool of direct perception of the interaction between the geomorphological hazard processes and the elements at risk. This map, therefore, may become a useful tool for local authorities, decision-making institutions, local stakeholder, environmental educators, etc.
The map shows: (1) the floodable areas, selected by the Flood Directive 2007/60European Union; (2) landslides, distinguished in active, inactive (dormant or relict), and mountain slope deformation, selected by the inventory of the landslides in Italy (IFFI, Italian Landslides Phenomena Inventory); (3) the urban fabric, distinguished in districts, infrastructures and cultural heritage sites, selected from the database of the regional territorial plan (Region Liguria) and of the Municipality cultural heritage sites list.
The map gives a detailed and complete view of the geo-hydrological phenomena in Genova Municipality through the integration of the different hazard sources, of the exposed elements and of their spatial distribution, allowing a first analysis of the subsequent risk.
2. Study area
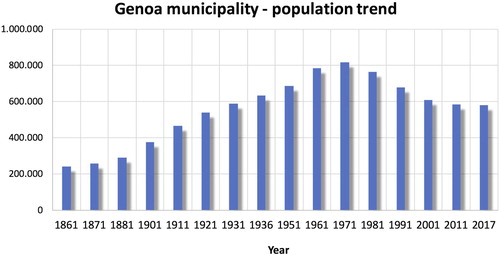
Genova is a coastal city settled in Liguria region, in the North-western part of Italy (). The Municipality extends on a surface area of about 240 km2, mainly stretched for 30 km along the coast and, secondly, along the two main valleys of Bisagno and Polcevera rivers (ref. to the Elevation Scheme on the map, rivers 2 and 3). The present population is about 580,000 but in the early 70s, when industrial activity was at its highest, it was more than 800,000 and planners were imagining a 1 million citizens city (). The first settlements and even the actual main industrial and transport activities are based on the port that is one of the main harbors in the Mediterranean Sea. The large extension of the port areas obtained by embankment (‘techno-coast’) shows the anthropic transformations occurred in the last 150 years for socio-economic reasons ().
Figure 1. Geological scheme of Genoa Municipality and location maps.
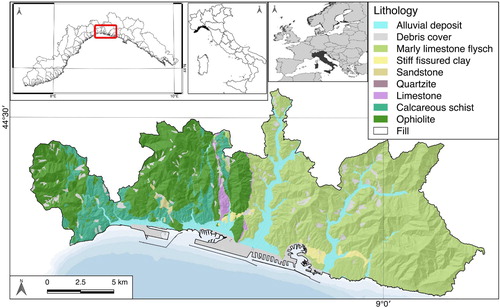
Figure 2. The population trend in Genoa municipality from 1861 (data from Genoa Municipality).
Population density (ref. to the relative scheme on the map) reaches high values in the central part of the Municipality, in the final stretch of the Bisagno river (ref. to the map: the administrative subdivision in districts n° 43, 44, 46 and 47), in the old town center around the port(districts n° 34, 35 and 37) and near the mouth of Polcevera river (districts n° 25). The highest values overcome 25,000 inhabitants/km2 in district n° 47 in a high flood hazard area and in district n° 25.
The steep Apennines hills border the Municipality that reaches a maximum altitude of 1183 m asl in the western part (Mt. Reixa) and 989maslin the eastern one (Mt. Alpesisa). The Municipality includes many small valleys orthogonally oriented to the coastline (CitationBrancucci & Paliaga, 2005) (); the main ones have been numbered 1–5 in the Elevation scheme of the map and correspond to Sturla, Bisagno, Polcevera, Varenna and Cerusa rivers. Not all the catchments are entirely comprised in the Municipality.
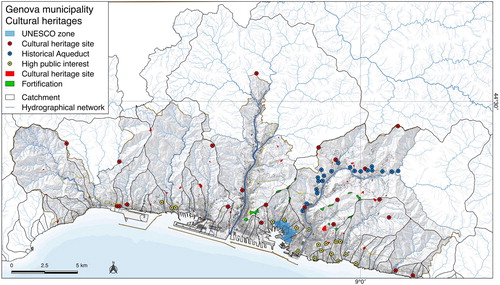
Figure 3. The spatial distribution of the cultural heritages in Genoa Municipality, selected by the regional and municipal data. Municipality does not include all the hydrographical networks and catchments.
Slope gradient is high (ref. to the Slope Scheme on the map) particularly in the eastern part of the Municipality and in the western one, where values above 50% are widely spread. Such a morphometric feature is the main predisposing factor of the high geo-hydrological hazard in the area: in case of heavy rainfall the reduced time of concentration of the small catchments causes the run-off to reach quickly the small floodplain, where the concentrated flow impacts an intensely urbanized territory (CitationFaccini, Luino, Sacchini, et al., 2015; CitationFaccini, Luino, Sacchini, Turconi, 2015b; CitationFaccini et al., 2016). shows the main geo-hydrological events that struck the Municipality starting from 1950. During flood events, many shallow landslides are often triggered and, in some cases, even debris/mudflows that concur in saturating the transport capacity of a culvert that usually are present in the final stretch of the rivers, in the urban area. The events that affect the territory produce casualties and large damage.
Table 1. Main flood and landslide events in Genoa Municipality in the period after the WWII (Faccini et al., 2015).
The geological features of the area are another factor contributing to instability and then to geo-hydrological hazard: in the geological sketch map shows the presence of sedimentary bedrock in the eastern part of the Municipality and by ophiolite in the western one, with a transition zone in the middle (CitationISPRA, 2008). A pervasive structural deformation, both fragile and ductile of the rock mass, together with a frequent alternation of different lithology, are often an important predisposing factor to instability processes (CitationHungr, Leroueil, & Picarelli, 2014).
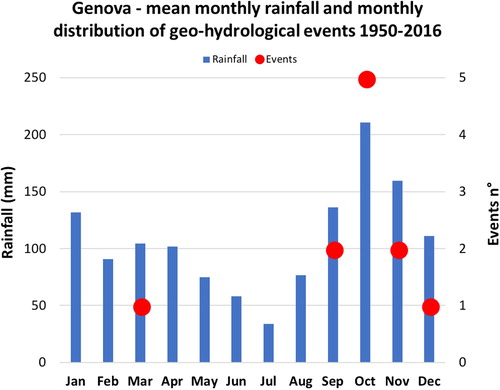
The climate of the area is characterized by mild winter and hot summer with a wet autumn and spring (CitationARPAL, 2013). The medium annual rainfall is about 1300 mm/y (CitationSacchini, Ferraris, Faccini, & Firpo, 2012) but mostly concentrated in the humid seasons. The diagram in highlights the medium-high rainfall values in October and November when floods and shallow landslides often occur. Evidences are rising about the intensification of rainfall intensity (CitationAcquaotta, Faccini, Fratianni, Paliaga, & Sacchini, 2018a; CitationAcquaotta, Faccini, Fratianni, Paliaga, Sacchini, & Vilìmek, 2018b) in the Genova Metropolitan area, with the consequence of a major occurrence of flash floods and shallow landslides (CitationGaume et al., 2009; CitationBarthlott & Kirshbaum, 2013).
Figure 4. The dark blue bars show monthly average rainfall in the period 1961–2010 (data of the meteorological station Genoa – University from ARPAL, 2013); red dots show the monthly distribution of geo-hydrological events in the period 1950–2016.
3. Material and methods
The analysis and the successive realizing of the map of the geo-hydrological inventory phenomena and the annexes schemes have been conducted using several data collected by the local authorities. The different layers used, mainly from Liguria administrative Region and Municipality of Genova, are listed in .
Table 2. Data used for the analysis and for the drawing of the map. The DTM is the more recent available, like all the other layers.
The flood hazard areas have been originally acquired from the Regional Basin Authority (CitationAutorità di Bacino Regionale, 2017a, Citation2017b, Citation2017c) and then included in the regional Directive 2007/60EU database. Additionally, the Natural Earth raster data has been used for the framework in the Main Map.
DTM has been used to realize the shaded relief deployed in the Main Map and the elevation and slope maps while all the vector data have been considered to prepare the Main Map after the opportune analyses. Data have been collected in Quantum GIS software and the spatial relationships between buildings, roads, cultural heritage sites and landslides and flood hazard areas have been investigated.
Buildings data comprise the type of use: residential, public services, industrial and agricultural. In order to conduct the analysis, the following data have been taken into account: landslides activity, classified in active, inactive (dormant, relict sensu CitationUNESCO Working Party On World Landslide Inventory, 1993), and mountain slope deformation (CitationHungr et al., 2014). Flood hazard zones have been classified with three degrees according to the peak river flow return period: they are the flooded areas at the flood occurrence with peak flow corresponding to return period of 50 (very high), 200 (medium) and 500 (low) years.
Cultural heritage sites data have been collected using two different sources, coming from the two local authorities, Region Liguria and Municipality of Genova. Each of them comprises different kinds of heritages, aside the punctual or areal geometry (): elements of the historical aqueduct, archeological sites, historical sites that comprise medieval bridges, historical villas, ancient churches and buildings, the system of forts that have been built on the summit of the hills around the old city center and sites of high public interest and subject to landscape planning restrictions. Besides the 1.1 km2 UNESCO zone, the old town has been considered (CitationLanza, 2003); the zone is partially comprised in very high and medium flood hazard zones.
Table 3. Cultural heritages in Genoa Municipality.
Districts are administrative entities in the Municipality that have been considered as they are the smaller administrative-territorial units associated to the population datum and give a first evaluation of the exposure to landslides and to possible flood phenomena.
4. Results: geo-hydrological phenomena inventory map
The spatial relationships between the factors of geo-hydrological phenomena (floods and landslides) and the elements exposed have been performed considering the intersection between the respective geometries: buildings and roads compared to landslides and floodable areas.
The results are shown in the diagrams included in the map.
4.1. Floodable areas
Floodable areas represent the source of high hazard in the final stretch of all the rivers and particularly along the Bisagno one and its tributaries near the city. The intense urbanization of the small floodplain, which saturated all the available space and the culvert in the last 1 km stretch, cause the high hazard and the high risk highlighted by the numerous flood events occurred from 1950 (CitationFaccini et al., 2016). The total inadequacy of the culvert in draining even the 50 years return period flood events is documented (CitationFaccini et al., 2016)and structural works are ongoing to improve the draining capacity, reducing the hazard in the highly populated area. A total number of about 70,000 citizens live in the highest hazard area (districts n° 41, 42, 43, 44, 46 and 47), but many more moves daily along it because of the presence of one of the two Genova main railway stations (‘Brignole’ and ‘Principe’); besides, the area is the compulsory passage for people moving from the Bisagno valley to the city and back. Unfortunately, the ‘flash floods’ that hit Genova in 2011 and 2014 ((A,B)) caused respectively 6 and 1 fatalities in the districts n. 46 and 43. Particularly the 2014 event occurred at 9:30 pm, but if it had occurred in the morning, probably the victims’ number would have been higher, as it happened in 2011.
Figure 5. Damage after 2014 flood in the Bisagno catchment; A, B near the train station; C, D solid transport and riverbank collapse along Geirato stream, a Bisagno river tributary (refer to the scheme in the Main Map).
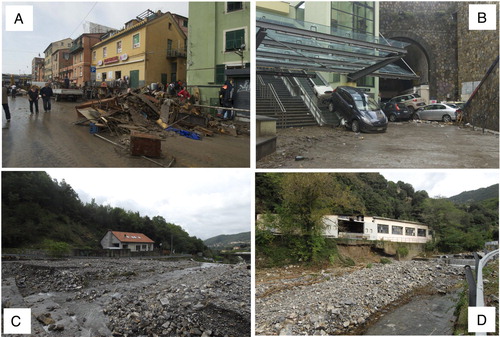
Other high flood hazard areas are located at the mouth of Polcevera river, where many commercial and industrial activities are located and, in west direction, in the district n°9 where more than 18,000 people live (population density between 10,000–15,000 inhab. /km2) and large shipyard and chemical/petroleum port installations are present.
In recent years (), many flood events occurred with large damage and even casualties; due to the small extension of the river catchments and to the high medium slope, often higher than 40%, the time of concentrations is small and flash floods represent a critical phenomenon, difficult to manage in such a highly urbanized area (CitationBrandolini, Cevasco, Firpo, Robbiano, & Sacchini, 2012; CitationFaccini, Luino, Sacchini, et al., 2015).
The number of buildings that are located in floodable areas in the whole Municipality, as it arises from the performed analysis, highlights the critical situation: more than 3600 residential buildings and almost 500 industrial buildings are in the highest hazard area, corresponding to flood events that may occur with a return period of 50 years(refer to the diagram on the map). More than100 services buildings, that comprise schools, universities, post offices, roads and train facility edifices are in the same dangerous area. Besides, in the same hazard area, are comprised of 80 public buildings that include churches and administrative centers, 51 commercial sites and 34 cultural and leisure sites. Most of these structures are daily visited by thousands of people, causing the increase of the exposure to the hazard.
In this framework even more than 54 km of roads are in the same high flood hazard area, increasing again the threat in case of flood or flash flood. Besides, due to the lack of spaces and of the orography, many road stretches are in tunnel or underpass that are often subject to sudden flooding.
4.2. Landslides
Many landslides are present in the Municipality: 486 are active and 586 are inactive dormant (sensu CitationUNESCO Working Party On World Landslide Inventory, 1993). The typology is various but dominant in number are the shallow landslides that usually are triggered during the heavy rains that cause even flash floods (CitationBrandolini et al., 2012).
The presence of landslides on the territory is widespread with some areas where, due to the peculiar geological and geomorphological features, mountain slope deformations interest large areas: it is the case of Sturla and Bisagno catchments in the eastern part of the Municipality and in Cerusa catchment in the western one. The triggering of shallow landslides in some cases produce debris- and mudflows that may superimpose their effects to the ordinary flooding, as it happened in the recent 2010 and 2014 flash floods (). In the first one, water and the debris flow saturated the capacity of the final culvert in the District n° 9, causing large damage, while in the latter a debris flow caused by the partial re-activation of a large landslide dam (Paliaga et al., Citation2018), the Prato Casarile in district 53 at the head of the valley, caused the collapse of embankments and weirs in the urban area ((D)).
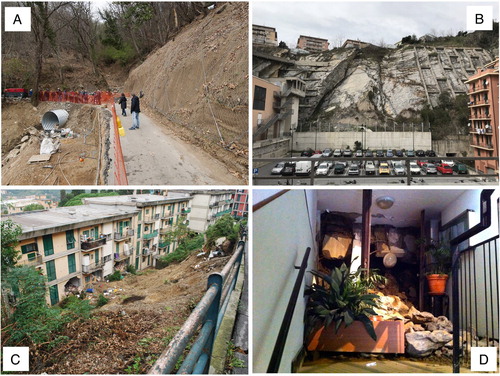
People exposed to landslide hazard, in contrast to flood hazard, are less in terms of pure numbers and damage is, anyway, high. Landslides occur in areas where less people live and then with a lower population density, but direct or indirect difficulties are often high: in some cases, landslides interrupt roads whose recovering requests long time, leaving small residential areas isolated and in others they produce structural damage to buildings and roads ((A)).
Figure 6. Landslides in the Municipality: A, road interruption in the upper Urban unit 12; B the actual status of the via Digione collapse landslide (u.u. 27); Clandslide affecting a residential building and a road; D of a landslide strongly affected apartment in 2014 (district 15).
The performed analysis evidences that, on the whole Municipality, more than 360 residential buildings are located on active landslides, but more than 2200 are on inactive- dormant ones. The hazard level then is high even for landslides, in particular considering the climate that is characterized by high-intensity rainfall that appears increasing in frequency and intensity (CitationAcquaotta et al., 2018a, Citation2018b). The presence of buildings with different destination use on active landslides is firmly lower than the residential ones, but anyway it comprises 19 industrial buildings and 9 public use buildings.
Roads are quite exposed to landslides hazard, due to the spread of residential buildings on the hills and in the hinterland: in total 18 km of roads are on active landslides and 65 km on dormant ones. In many cases, due to the orography, the activation of a landslide involves buildings and roads, as it happened in 2014 with heavy damage to a large residential building and the road in district n° 15 ((C,D)): in that case 32 families that lived in the building where evacuated for a long time and about 1.2 mln € was the cost for the emergency structural works.
The most dramatic landslide which interested the Municipality happened in 1968 when a landslide destroyed a residential building causing 19 casualties ((B)). The building was realized in an old quarry, ignoring the high landslide susceptibility (CitationPeretti, 1969).
4.3. Cultural heritage sites
Since the Middle Age Genova, as one of the Maritime Republics, was a well-developed city with a strong economy. Cultural and historical heritage sites are nowadays present in the Municipality, comprised one of the largest historical centers in Europe. In 2006, part of the ancient city center became part of the UNESCO World Heritage List, but many are the historical, cultural and even archeological sites present in the Municipality. At the summit of the steep hills around the old city center a system of walls and fortification was realized starting from XVII century: nowadays most of them are conserved and are commonly used by people for leisure. In the Municipality, and especially along the sea but even in the hinterland, many ancient villas and churches, from the Romanic and Renaissance period, are present.
All these cultural heritage sites are potentially subject to the same geo-hydrological hazards (CitationLanza, 2003) that threaten contemporary buildings and infrastructures; the potential damage in case of the event would be high due to the possible loss of no replicable heritages.
The UNESCO zone is partially comprised in areas with flood occurrence with peak flow corresponding to return period of50 and 200 years, exposing it to a high hazard, even if spatially well localized. By extending the analysis to the other heritage sites, it highlights that only 2 elements, among the selected ones, are located in floodable areas, in districts 7 and 67. Probably the hazard, in those cases, could be determined by the subsequent urbanization with the restriction of riverbeds.
Considering the landslide hazard, only an ancient settlement in district n° 55 is located on a slope deformation (CitationSacchini, Faccini, Ferraris, Firpo, & Angelini, 2015), probably for the more favorable gradient determined by the accumulation process.
5. Conclusion and research perspective
The detailed and complete view of the geo-hydrological hazard in a critical area like Genova Municipality is an important tool for decision makers to plan and for adopting the more adequate activities for risk mitigation and reduction (CitationDi Salvo, Ciotoli, Pennica, & Cavinato, 2017; CitationBorrelli & Muto, 2017; CitationConforti, Muto, Rago, & Critelli, 2014; CitationNicu, 2017a; Citation2017b).
Many sources of geo-hydrological hazard are present: landslides and slope deformations are spread in the whole Municipality, while floodable areas are present along every river and in some cases, they extend on large surfaces.
An integrated map of landslide and flood hazard for a territory with a complex morphology and a strong urbanization allows to assess the relationships between the different sources of hazard and between them and the exposed population, buildings and infrastructures (CitationTerranova et al., 2018). The performed spatial analysis allowed to evaluate the high consistency of the exposed elements, by highlighting the exigence of interventions. Structural works are ongoing or in designing stage for the more critical flood hazard situations (Bisagno river), but a general prevention plan lacks and should be adopted, following the basic principle of prevention: the necessary continuous actions on the territory, highlighted by the Sendai Framework for Disaster Risk Reduction 2015–2030 (CitationUN-ISDR, 2015).
Risk mitigation strategies include even the essential role played by the communication and dissemination to people exposed to the hazard (CitationSilvestro et al., 2012; CitationMerz et al., 2014; CitationRago et al., 2017): a dedicated map is an important tool of diffusion of the actual knowledge of geo-hydrological hazard in a critical situation as in Genova Municipality. Such a tool should be part of a wider activity of communication aimed to reduce the inappropriate behavior that people often have particularly during flood events and consequently exposing themselves to a high risk.
The future subsequent analysis could be performed assessing more in detail the economic activities facing the hazard and then better evaluating the potential damages, but even the possibility of relocating activities in less hazard-prone areas. Besides, the hazard sources will need to be updated in order to adapt the map to the constantly changing conditions.
Software
The map and the analysis were realized in Quantum GIS 2.18 while, for the final draw, Adobe Illustrator has been used. Data analysis and diagrams were performed with Microsoft Excel.
Bozza_rev_B10_LAVORAZIONE.pdf
Download PDF (27.8 MB)Graphical_abstract_H_Genoa.jpg
Download JPEG Image (113.3 KB)
Disclosure statement
No potential conflict of interest was reported by the authors.
Related Research Data
References
- Acquaotta, F., Faccini, F., Fratianni, S., Paliaga, G., & Sacchini, A. (2018a). Rainfall intensity in the Genoa metropolitan area (northern Mediterranean): Secular variations and consequences. Weather, doi:10.1002/wea.3208
- Acquaotta, F., Faccini, F., Fratianni, S., Paliaga, G., Sacchini, A., & Vilìmek, V. (2018b). Increased flash flooding in Genoa metropolitan area: A combination of climate changes and soil consumption? Meteorology and Atmospheric Physics, 130(4). doi:10.1007/s00703-018-0623-4
- Agenzia Regionale per la Protezione dell’Ambiente Liguria ARPAL. (2013). Atlante climatico della Liguria [Liguria Climate Atlas]. Retrieved from http://www.arpal.gov.it/homepage/meteo/analisi-climatologiche/atlante-climatico-della-liguria.html
- Autorità di Bacino Regionale. (2017a). Piano di Bacino Stralcio per l’assetto Idrogeologico del Torrente Polcevera [Basin master plan for the geo-hydrological arrangement]. Retrieved from http://www.pianidibacino.ambienteinliguria.it/GE/polcevera/polcevera.html
- Autorità di Bacino Regionale. (2017b). Piano di Bacino Stralcio per l’assetto Idrogeologico del Torrente Bisagno [Basin master plan for the geo-hydrological arrangement]. Retrieved from http://www.pianidibacino.ambienteinliguria.it/GE/bisagno/bisagno.html
- Autorità di Bacino Regionale. (2017c). Piano di Bacino Stralcio per l’assetto Idrogeologico, Ambito 14, [Basin master plan for the geo-hydrological arrangement]. Retrieved from http://www.pianidibacino.ambienteinliguria.it/GE/ambito14/ambito14.html
- Barthlott, C., & Kirshbaum, D. J. (2013). Sensitivity of deep convection to terrain forcing over Mediterranean islands. Quarterly Journal of the Royal Meteorological Society, 139, 1762–1779. doi:10.1002/qj.2089
- Borrelli, L., & Muto, F. (2017). Geology and mass movements of the licetto river catchment (Calabrian coastal range. Southern Italy). Journal of Maps, 13(2), 588–599. doi:10.1080/17445647.2017.1342283
- Brancucci, G., & Paliaga, G. (2005). Geomorphic characterization of the main drainage basins of maritime Liguria (Italy) – preliminary results. Geografia Fisica e Dinamica Quaternaria, (suppl. VII), 59–67.
- Brandolini, P., Canepa, G., Faccini, F., Robbiano, A., & Terranova, R. (2007). Geomorphological and geo-environmental features of the Graveglia valley (Ligurian Apennines). Geografia Fisica e Dinamica Quaternaria, 30, 99–116.
- Brandolini, P., Cevasco, A., Firpo, M., Robbiano, A., & Sacchini, A. (2012). Geo-hydrological risk management for civil protection purposes in the urban area of Genoa (liguria, NW Italy). Natural Hazards and Earth System Sciences, 12, 943–959. doi:10.5194/nhess-12-943-2012
- Canuti, P., Casagli, N., Pellegrini, M., & Tosatti, G. (2001). Geo-hydrologicalhazards. In G. B. Vai and I. P. Martini (Eds.), Anatomy of an Orogen, the Apennines and adjacent Mediterranean basins (pp. 513–532, Chapter 28). Dordrecht: Springer.
- Cati, L. (1971). L’evento alluvionale del 7–8 ottobre 1970 sui bacini dei torrenti Leiro, Polcevera e Bisagno [The 7-8 October 1970 flood event in the Leiro, Polcevera and Bisagno catchments]. Annali Idrologici, parte 2. Roma: Istituto Poligrafico dello Stato.
- Conforti, M., Muto, F., Rago, V., & Critelli, S. (2014). Landslide inventory map of north-eastern Calabria (south Italy). Journal of Maps, 10(1), 90–102. doi:10.1080/17445647.2013.852142
- De Roo, A., Barredo, J., Lavalle, C., Bodis, K., & Bonk, R. (2007). Potential flood hazard and risk mapping at Pan-European cale. In R. J. Peckham, G. Jordan (Eds.), Digital terrain modelling. Lecture notes in geoinformation and cartography. Berlin: Springer. doi:10.1007/978-3-540-36731-4_8
- Di Salvo, C., Ciotoli, G., Pennica, F., & Cavinato, G. P. (2017). Pluvial flood hazard in the city of Rome (Italy). Journal of Maps, 13(2), 545–553. doi:10.1080/17445647.2017.1333968
- Faccini, F., Luino, F., Paliaga, G., Sacchini, A., & Turconi, L. (2015). Yet another disaster flood of the Bisagno stream in Genoa (Liguria, Italy): October the 9th-10th 2014 event. Rendiconti Online Della Società Geologica Italiana, 35, 128–131. doi:10.3301/ROL.2015.81
- Faccini, F., Luino, F., Paliaga, G., Sacchini, A., Turconi, L., & de Jong, C. (2018). Role of rainfall intensity and urban sprawl in the 2014 flash flood in Genoa City, Bisagno catchment (Liguria, Italy). Applied Geography. doi:10.1016/j.apgeog.2018.07.022
- Faccini, F., Luino, F., Sacchini, A., Turconi, L., & De Graff, J. V. (2015). Geo-hydrological hazard and urban development in the Mediterranean area: An example from Genoa city (Italy). Natural Hazards and Earth System Sciences, 15, 2451–2492. doi:10.5194/nhess-15-2631-2015
- Faccini, F., Luino, F., Sacchini, A., & Turconi, L. (2015a). The 4th October 2010 flash flood event in Genoa SestriPonente (liguria, Italy). Disaster Advanced, 8(8), 1–14.
- Faccini, F., Luino, F., Sacchini, A., Turconi, L. (2015b). Flash flood events and urban development in Genoa (Italy): lost in translation. In G. Lollino (Ed.), Engineering geology for society and territory, volume 5 (pp. 797–801). Springer International Publishing.
- Faccini, F., Paliaga, G., Piana, P., Sacchini, A., & Watkins, C. (2016). The bisagno stream catchment (genoa, Italy) and its major floods (1822, 1970 and 2014): geomorphic and land use variations in the last three centuries. Geomorphology, 273, 14–27. doi:10.1016/j.geomorph.2016.07.037
- Faccini, F., Piccazzo, M., Robbiano, A., & Roccati, A. (2008). Applied geomorphological Map of the Portofino municipal territory (Italy). Journal of Maps, 4(1), 451–462. doi:10.4113/jom.2008.1023
- Faccini, F., Robbiano, A., & Sacchini, A. (2012). Geomorphic hazard and intense rainfall: The case study of the Recco stream catchment (eastern Liguria, Italy). Natural Hazards and Earth System Sciences, 12, 893–903. doi: 10.5194/nhess-12-893-2012
- Gaume, E., Bain, V., Bernardara, P., Newinger, O., Barbuc, M., Bateman, A., … , & Viglione, A. (2009). A compilation of data on European flash floods. Journal of Hydrology, 367, 70–78. doi:10.1016/j.jhydrol.2008.12.028
- Guzzetti, F., & Tonelli, G. (2004). Information system on hydrological and geomorphological catastrophes in Italy (SICI): a tool for managing landslide and flood hazards. Natural Hazards and Earth System Science, 4(2), 213–232. doi:10.5194/nhess-4-213-2004
- Hungr, O., Leroueil, S., & Picarelli, L. (2014). The Varnes classification of landslide types, an update. Landslides, 11(2), 167–194. doi:10.1007/s10346-013-0436-y
- ISPRA, Italy Geological Survey (2008). Geological map of Italy at 1:50.000 scale. Foglio, 459, Sassari. CARG project. Retrieved from http://www.isprambiente.gov.it/Media/carg/213_GENOVA/Foglio.html
- Jaedicke, C., Van Den Eeckhaut, M., Nadim, F., Hervás, J., Kalsnes, B., Vidar Vangelsten, B., Smith, J. T., Tofani, V., Ciurean, R., Winter, M. G., Sverdrup-Thygeson, K., Syre, E., & Smebye, H. (2014). Identification of landslide hazard and risk ‘hotspots’ in Europe. The Bulletin of Engineering Geology and the Environment, 73, 325–339. doi:10.1007/s10064-013-0541-0
- Lanza, S. G. (2003). Flood hazard threat on cultural heritage in the town of Genoa (Italy). Journal of Cultural Heritage, 4(3), 159–167. doi:10.1016/S1296-2074(03)00042-6
- Lugeri, N., Kundzewicz, Z. W., Genovese, E., Hochrainer, S., & Radziejewski, M. (2010). River flood risk and adaptation in Europe – assessment of the present status. Mitigation and Adaptation Strategies for Global Change, 15(7), 621–639. doi:10.1007/s11027-009-9211-8
- Luino, F., Nigrelli, G., Turconi, L., Faccini, F., Agnese, C., & Casillo, F. (2016). A proper land-use planning through the use of historical research. Disaster Advances, 9(1), 8–19.
- Margottini, C., Antidze, N., Corominas, J., Crosta, G. B., Frattini, P., Gigli, G., … ,& Vacheishvili, N. (2015a). Landslide hazard, monitoring and conservation strategy for the safeguard of Vardzia Byzantine monastery complex. Landslides, 12(1), 193–204. doi:10.1007/s10346-014-0548-z
- Margottini, C., Fidolini, F., Iadanza, C., Trigila, A., & Ubelmann, Y. (2015b). The conservation of the Shahr-e-Zohak archaeological site (central Afghanistan): geomorphological processes and ecosystem-based mitigation. Geomorphology, 239, 73–90. doi:10.1016/j.geomorph.2014.12.047
- Merz, B., Aerts, J., Arnbjerg-Nielsen, K., Baldi, M., Becker, A., Bichet, A., … , & Nied, M. (2014). Floods and climate: Emerging perspectives for flood risk assessment and management. Natural Hazards and Earth System Sciences., 14(7), 1921–1942. doi:10.5194/nhess-14-1921-2014
- Nicu, I. C. (2017a). Frequency ratio and GIS-based evaluation of landslide susceptibility applied to cultural heritage assessment. Journal of Cultural Heritage, 28, 172–176. doi:10.1016/j.culher.2017.06.002
- Nicu, I. C. (2017b). Tracking natural and anthropic risks from historical maps as a tool for cultural heritage assessment: A case study. Environmental Earth Sciences, 76, 330. doi:10.1007/s12665-017-6656-z
- Paliaga, G., Faccini, F., Luino, F., Turconi, L., & Bobrowsky, P. (2018). Geomorphic processes and risk related to a large landslide dam in a highly urbanized Mediterranean catchment (Genova, Italy). Geomorphology. doi: 10.1016/j.geomorph.2018.10.0203
- Peretti, L. (1969). Appunti di geologia tecnica sulla frana del 21 marzo 1968 in Genova – Collina degli Angeli. [Engineering geology notes on the 21 March 1968 landslides in Genoa – Collina degli Angeli]. Atti Ist. Geology University of Genova, 6, 189–209.
- Prenger-Berninghoff, K., & Greiving, S. (2015). The Use of risk information in spatial planning in Europe: Examples from case study sites in Italy and Romania with a focus on flood and landslide hazards. In G. Lollino, A. Manconi, F. Guzzetti, M. Culshaw, P. Bobrowsky, & F. Luino (Eds.), Engineering geology for society and territory – (Volume 5). Cham: Springer.
- Rago, V., Chiaravalloti, F., Chiodo, G., Gabriele, S., Lupiano, V., Nicastro, R., … Iovine, G. (2017). Geomorphic effects caused by heavy rainfall in southern Calabria (Italy) on 30 October–1 November 2015. Journal of Maps, 13(2), 836–843. doi:10.1080/17445647.2017.1390499
- Roccati, A., Faccini, F., Luino, F., Turconi, L., & Guzzetti, F. (2018). Rainfall events with shallow landslides in the Entella catchment (Liguria, northern Italy). Natural Hazards and Earth System Sciences., 18, 2367–2386. doi:10.5194/nhess-18-2367-2018
- Sacchini, A., Faccini, F., Ferraris, F., Firpo, M., & Angelini, S. (2015). Large-scale landslide and deep-seated gravitational slope deformation of the upper Scrivia Valley (Northern Apennine, Italy. Journal of Maps, 12(2), 344–358. doi:10.1080/17445647.2015.1021393
- Sacchini, A., Ferraris, F., Faccini, F., & Firpo, M. (2012). Environmental climatic maps of Liguria. Journal of Maps, 8(3), 199–207. doi:10.1080/17445647.2012.703901
- Salvati, P., Bianchi, C., Rossi, M., & Guzzetti, F. (2010). Societal landslide and flood risk in Italy. Natural Hazards and Earth System Science, 10(3), 465–483. doi:10.5194/nhess-10-465-2010
- Salvati, P., Bianchi, C., Fiorucci, F., Giostrella, P., Marchesini, I., & Guzzetti, F. (2014). Perception of flood and landslide risk in Italy: A preliminary analysis. Natural Hazards and Earth System Sciences, 14, 2589–2603. doi:10.5194/nhess-14-2589-2014
- Salvati, P., Pernice, U., Bianchi, C., Marchesini, I., Fiorucci, F., & Guzzetti, F. (2016). Communication strategies to address geohydrological risks: The POLARIS web initiative in Italy. Natural Hazards and Earth System Sciences, 16, 1487–1497. doi:10.5194/nhess-16-1487-2016
- Silvestro, F., Gabellani, S., Giannoni, F., Parodi, A., Rebora, N., Rudari, R., & Siccardi, F., (2012). A hydrological analysis of the 4 November 2011 event in Genoa. Natural Hazards and Earth System Sciences., 12(9), 2743–2752. doi:10.5194/nhess-12-2743-2012
- Terranova, O., Gariano, S., Iaquinta, P., Lupiano, V., Rago, V., & Iovine, G. (2018). Examples of application of GASAKe for predicting the occurrence of rainfall-induced landslides in southern Italy. Geosciences, 8(2), 78. doi:10.3390/geosciences8020078
- Tropeano, D., Govi, M., Mortara, G., Turitto, O., Sorzana, P., Negrini, G., & Arattano, M. (1999). Eventi alluvionali e frane nell'Italia settentrionale. Periodo 1975-1981. CNR-IRPI Bacino Padano. Torino: CNR-GNDCI.
- UNESCO Working Party On World Landslide Inventory. (1993). A suggested method for describing the activity of a landslide. Bulletin of the International Association of Engineering Geology, 47–53. doi:10.1007/BF02639593
- UN International Strategy for Disaster Reduction, UN-ISDR (2015). Sendai Framework for Disaster Risk Reduction 2015–2030. Retrieved from: https://www.unisdr.org/files/43291_sendaiframeworkfordrren.pdf