?Mathematical formulae have been encoded as MathML and are displayed in this HTML version using MathJax in order to improve their display. Uncheck the box to turn MathJax off. This feature requires Javascript. Click on a formula to zoom.
ABSTRACT
This paper presents an innovative multi-thematic map (1:2500) that integrates morpho-sedimentological data, hydrodynamic processes, seasonal morphodynamic transitions and the distribution of the benthic habitat of a Mediterranean microtidal, wave-dominated gravel beach system. It is part of a larger cartography of coastal areas, and is based on an interdisciplinary sea-land approach that is applicable worldwide and aims to facilitate coastal management practices and future scientific research. The applications to coastal management include: the facilitation of coastal vulnerability assessments; easy-to-access, up-to-date digital geospatial data; and baseline studies for the future assessment and monitoring of environmental changes.
The main environmental features that control the marine processes of this gravel beach appear to be linked to geological and morphological contexts such as the presence of the river mouth, the outcropping of a beach-rock along the coastline, the deposition of gravelly sediment in the beachface and the seagrass cover.
1. Introduction
Gravel beaches are typically found in high-latitude regions, but they are also common near coastlines backed by mountains and at the mouths of rivers (CitationPoate et al., 2013). These environments are characterized by an abundant supply of gravel sediment originating from material eroded from mountains or cliffs or transported by rivers and glaciers (CitationPontee, Pye, & Blott, 2004; CitationShulmeister & Kirk, 1997). According to CitationMasselink, Hughes, and Knight (2011), gravel beaches are morphodynamically different to sandy beaches; the higher permeability of gravel reduces the backwash volume, making these beaches more responsive to wave run-up than sandy shore. For this reason, gravel beaches tend to fall within the reflective domain of Short’s morphological beach classification (Citation1999). However, the features of this type of beach, such as their composition, size and form, vary widely in many different environmental settings. The classification of gravel beaches is still an open research area. In this regard, CitationJennings and Schulmeister (2002) proposed a tripartite classification of gravel beaches (pure gravel, mixed sand-gravel and composite sand-gravel) based on simple visual classifications and supported by morphodynamic differences between the beach types.
Nowadays, there is a growing interest in understanding the behavior of gravel beaches, because coarse sediment is widely used as a nourishment material to replenish sectors of eroded coasts (CitationGrottoli, Bertoni, & Ciavola, 2017; CitationRuiz de Alegria-Arzaburu & Masselink, 2010). Despite the growing interest in the morphodynamics and sedimentological characteristics of gravel beaches, there are a limited number of cartographic products with which to identify, understand and describe static and dynamic coastal processes deriving from the interaction between morphodynamics, eco-geomorphological settings (e.g. the distribution of Posidonia oceanica) and sedimentary facies in these environments. Understanding these interactions can be crucial for coastal managers to: reducing vulnerability; effectively protecting the coastal environment; and planning appropriate future interventions (CitationDe Muro, Ibba, Simeone, Buosi, & Brambilla, 2017; CitationTintoré, Medina, Gómez-Pujol, Orfila, & Vizoso, 2009).
The Main Map presented herein aims to provide integrated geomorphological, sedimentological and ecological information and morphodynamics on a microtidal, wave-dominated beach system characterized by gravelly sediment and coastal processes influenced by geological and morphological contexts. More specific goal is provide a multidisciplinary baseline product to support the management of gravel beaches, including in relation to sea-level rises and increasingly common extreme events linked to global warming.
This map is part of a more extensive study that aims to provide a major cartographic archive of coastal areas. This study is based on interdisciplinary sea-land approaches that are applicable worldwide for key Mediterranean (e.g. CitationBuosi et al., 2017; CitationDe Muro et al., 2018; CitationDe Muro, Pusceddu, Buosi, & Ibba, 2017), Australian (CitationDe Muro, Tecchiato, Buosi, et al., 2018; CitationTecchiato, Buosi, Ibba, Ryan, & De Muro, 2016) and Strait of Magellan sites (CitationDe Muro, Brambati, Tecchiato, Porta, & Ibba, 2017; CitationDe Muro, Tecchiato, Porta, Buosi, & Ibba, 2018), and with respect to a variety of environmental and managerial topics.
2. Study area
2.1. Regional setting
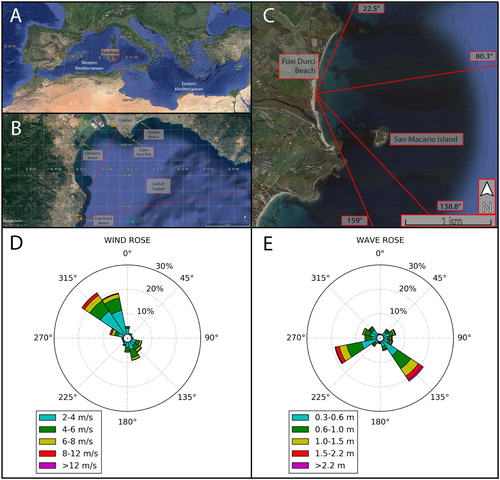
In this paper, we focus on the geomorphological processes of a coastal sector that extends approximately 35 km southwest of Cagliari, on the western side of the Cagliari Gulf (southern Sardinia, Italy, western Mediterranean; ). The investigated area, called Foxi Durci Beach, is a ∼2 km-long East-facing embayment characterized by a narrow siliciclastic gravelly-sandy beach. This beach system, which is classified as microtidal wave-dominated, mainly receives sedimentary input from the Rio Pula Stream that flows into the southern-most area of the coastal plain, where the river mouth is located. Currently, the river sediment load is capable of feeding the beach, providing mainly sand and, to a lesser extent, gravelly and muddy sediment. Additional sediment input comes from the scarp erosion in the northern sector of the beach. The small island of San Macario, located approximately 600 m from the coastline eastwards, affects nearshore hydrodynamics by sheltering the southern sector of the beach from incoming waves (see further details in Section 4.4). North of the river mouth, a 50 m-long artificial barrier extends from the shoreline to a depth of 2 m. In the southern area of the beach, a small sandy-gravelly spit extends from the coastline out into the sea (Map 1).
Figure 1. Study area. (A) Geographical setting of the study area, located in the western Mediterranean Sea, Gulf of Cagliari. (B,C) Wave exposure angles (referred to the N = 0°) and fetch (red lines). (D) Wind speed and direction from Cagliari station of the national tidal monitoring network (location: orange star in panel B). (E) Significant wave height and direction at the NOAA hindcast dataset point (location: green star in panel B).
Palaeozoic, metamorphic (meta-sandstone, meta-siltstone, shale, meta-limestone and dolostone, Cambrian-Ordovician) hills surround the alluvial-coastal plain. Hypo-abyssal lava bodies of the first Oligo-Miocene volcanic cycle outcrop on the plain North and South of the studied beach, forming gentle hills (CitationCarmignani, Oggiano, Funedda, Conti, & Pasci, 2016; Appendix A). The alluvial plain was deposited by the Rio Pula fluvial system during the Quaternary. Pleistocene continental deposits (alluvial deposits, travertine and eolianites) outcrop along the edge of the river, while marine to continental Holocene deposits fill the coastal plain.
2.2. Wave climate and hydrodynamics
The main geographical fetch is between 80.3° and 138.8°, with all possible directions for approaching storms ranging from 22.5° to 159° ((C)). The prevailing winds come from the NW (around 20% of occurrence; (D)).
We carried out a wave-climate assessment using the 30-year-long hindcast dataset elaborated by the National Oceanographic Atmospheric Administration (NOAA) (CitationChawla, Spindler, & Tolman, 2012). This dataset is based on simulations produced using the spectral wave model WaveWatch III (WWIII), covering the period from January 1979 to December 2009. The results have a time resolution of three hours and a spatial resolution of 0.167° in the Mediterranean Sea. We extracted the wave parameters from the NOAA grid node lying about 18 km offshore of Foxi Durci Beach (39°N and 9.167°E), where the water depth of 89 m induces only weak disturbances to wave propagation.
To focus our attention on dominant wave conditions, we retained only the wave data associated with the sectors that contribute more than 5% of the total offshore wave energy. The SE sector is the most energetic, representing the dominant wave direction with a contribution of 35% of the total energy ((E)). Moreover, a significant energy contribution (6%) comes from the ENE direction and is mainly related to waves generated in the Tyrrhenian Sea that are able to enter the Gulf of Cagliari. Finally, although the WSW sector contributes 30% of the total offshore energy ((E)), wave conditions with such a large angle of incidence (the angle between the offshore mean wave direction and the beach orientation is 147.5°) are unable to bring significant wave energy directly to Foxi Durci Beach. This fact is supported by simulations of nearshore wave propagation which show that, during the largest winter storms from WSW, the significant wave height that is in excess of 3 m offshore is reduced to an order of only 0.5 m at a water depth of 10 m in front of the beach. This insight led to the exclusion of the WSW sector from the present analysis. As a consequence, the only two sectors considered for further assessment were the ENE and the SE sectors. Wave height data from these sectors were separately fitted to a log-normal distribution (CitationCastillo, Baquerizo, & Losada, 2005; CitationInfantes, Terrados, Orfila, Canellas, & Alvarez-Ellacuria, 2009) to identify the wave height Hs12 that is exceeded for 12 h per year.
3. Methods
The results of integrated geomorphological, sedimentological and marine-coastal dynamic studies were used to produce a Main Map (1:2500 scale; Map 1) and four supplementary maps (1:7000 scale) that focus on: sedimentary facies (Map 2); routes and samples (Map 3); and wave models (Maps 4 and 5). The construction of the legend was the result of a morphodynamic approach starting from the implementation of the model produced by the Coastal and Marine Geomorphology Group (CMGG, University of Cagliari; CitationDe Muro, Batzella, Kalb, & Pusceddu, 2008; CitationDe Muro, Kalb, Ibba, Ferraro, & Ferrara, 2010). Data reported in the Main Map were collected and analysed following the methodological protocols developed by the CMGG (e.g. CitationBrambilla, van Rooijen, Simeone, Ibba, & De Muro, 2016; CitationPusceddu et al., 2011), which include: interpretations of satellite images and orthophotos; topographic and bathymetric surveys; sedimentological characterizations; benthic habitat mapping; numerical modeling; and assessments of the beach type.
3.1. Backshore
Seasonal topographical surveys were carried out along 28 transects (spaced 50 m apart) and extend from the backbeach-backshore up to a depth of 1 m (Map 3). The data were collected using the Differential Global Positioning System (DGPS) in a Global Navigation Satellite System (GNSS) and/or the StarFire (Navcom SF3040) system (frequency of 1 Hz).
In accordance with a sampling plan, 21 sediment samples (about 200 g each) were collected using a small corer along the transects (Map 3) from the backbeach to the shoreline, distributed along dune crests, backshores and intertidal beach zones.
3.2. Shoreface
The morphology of the seabed is based on single-beam bathymetry acquired using an Ecosounder/DGPS system interfaced with navigation software (sampling frequency of 5 Hz). The shoreface survey was carried out by extending the 28 backshore/shoreface transects from a depth of 1 m to the inner shelf at a depth of approximately 20 m (Map 3).
Forty-three sediment samples from the shoreface to the inner shelf were collected using a Van Veen grab (5 dm3 capacity) along the transects (Map 3) at specific depths (1, 3, 5, 7 and 10 m) and corresponding to relevant geomorphological features (beach step, upper limit of the seagrass meadow and intermattes).
The mapping of the benthic habitat was based on Side-Scan Sonar (SSS), satellite images, scuba diving and underwater video data. The SSS images were interpreted in a GIS environment. The interpretation was based on the intensity of the acoustic signal return and its topography (CitationMoura et al., 2013). Benthic habitats were ground-truthed using underwater video data and scuba diving. In the shallowest sectors, the satellite images showed sufficient clarity to facilitate habitat mapping and integration with the SSS data.
The surf-scaling index (CitationGuza & Inman, 1975) is used for the morphodynamical classification of beach stretches:Where: ab
is the breaker amplitude (
, where Hb
is the wave breaking height); ω is the wave radian frequency (
, where T is the wave period); g is the acceleration of gravity; and β is the swash-zone (foreshore) gradient.
The beaches, or beach transects, can be classified as dissipative (for 20 < ε < 200), reflective (for 0.1 < ε < 2.5) and intermediate between the two, according to the classification reported in CitationShort (1999).
3.3. Sediment analysis
The grain-size analyses were performed on the >63 μm fraction. Each sediment sample was dry sieved through a battery of sieves spaced at ¼ phi (ø) per unit (CitationWentworth, 1922). The pipette sedimentation method (CitationFolk, 1974) was used to analyze the <63 μm fractions. Textural parameters (median, mean diameter and sorting) were calculated following the CitationFolk and Ward (1957) protocols.
The percentages of quartz, feldspars, micas, other minerals, lithoclasts and skeletal grains were established under an optical microscope (CitationLewis & McConchie, 1994).
Sedimentary facies were identified based on the grain-size and mineralogical/petrographical composition of the sediment (CitationDe Muro, Batzella, De Falco, & Porta, 2010; CitationDe Muro, Pusceddu, & Kalb, 2010).
3.4. Numerical models
The offshore wave conditions from the ENE and SE sectors () were propagated in the nearshore zone in front of Foxi Durci Beach by means of a coupling of two wave models: spectral SWAN and wave-resolving XBeach. The latter was set up with the non-hydrostatic module, allowing the simulation of wave-by-wave flow variations that are of crucial importance on steep beaches. SWAN simulated the wave propagation on a coarse grid from the NOAA node up to a water depth of approximately 16 m. At that water depth, the wave conditions from the SWAN runs were imposed as boundary incoming conditions for the XBeach runs that simulated wave and wave-induced currents on a fine grid up to the foreshore. The main reason for the choice of the wave-resolving XBeach model for the shallow water area was the need to address the diffraction processes occurring in proximity to San Macario Island that cannot be reproduced by a spectral model like SWAN.
Table 1. Simulated wave cases. F1: less severe offshore storm; F2: more severe offshore storm.
4. Geomorphological Map
4.1. Sedimentary facies and benthic habitats
Four sedimentary facies (A-D) were recognized in the examined area (, Map 2). Facies A (beachface-shoreface) is composed of pebbles and boulders and extends between 0 and 5 m in depth. A siliciclastic-dominated facies, with mainly sandy-gravelly sediment (), lies on the shoreface close to the shoreline (Facies B; 0–9 m depth). A mixed bioclastic–siliciclastic facies (Facies C) was recognized between the shoreface and the upper limit of P. oceanica meadow (2–10 m depth). Facies D was sampled in the ‘intermattes’, with an uncolonized sandy substrate occurring within the meadow (5–10 m depth; Map 2).
Table 2. Sedimentological characteristics of sedimentary facies.
The following benthic habitats and substrate types were identified at Foxi Durci Beach (Map 1): (1) uncolonized sandy substrates dominating the seafloor between the shoreline and the upper limit of the seagrass meadow (0–10 m depth); (2) a continuous seagrass meadow, mainly P. oceanica, occurring in the depth range 5–35/40 m; (3) a rocky substrate situated near the coastline in the northern and southern sectors of the study area and around San Macario Island (Map 1); and (4) a beach-rock outcropping along the coastline in the northern sector of the area at a depth of 2 m.
4.2. Shoreface geomorphology
The Foxi Durci seabed is relatively smooth inshore and slopes towards the East, reaching 10 m in depth approximately 500/600 m from the shoreline (1.4–1.7% slope; Appendix B). However, the slope varies along the shore, with a lower percentage in the seabed adjacent to the mouth of Rio Pula (0.12% slope; Appendix B). A submerged cobble bar was recognized in this area at a depth of about 1 m (Map 2). The bathymetric profiles reveal an irregular morphology of the seabed between the shoreline and San Macario Island, due to the presence of rocky substrates, intermattes, small depressions and higher elevation areas (Appendix B).
4.3. Beach type
We calculated the surf-scaling index (Equation 1), including as a breaking wave height Hb, from the simulated cases F1 and F2 and as a foreshore slope β that we measured around the mean sea level. reveals that some of the beach profiles analysed always appear to be reflective, irrespective of seasonality (summer/winter beach configuration) and the severity of storm incidents (F1-F2): T3-T6; T8-T10; T12; T15-T17; and T27, as represented in (C) by grey bands. The other profiles alternate reflective and intermediate states, assuming, therefore, transitional behavior, which depends on the combination of hydrodynamic and morphological conditions.
Figure 2. Surf scaling index calculated for different combinations of beach profile seasonality and severity of storm impact. Horizontal dashed lines represent the threshold between reflective (ε < 2.5) and intermediate (2.5 < ε < 20) classification. Panels A (summer profiles) and B (winter profiles) represent surf scaling index at varying wave storms (F1 – blue; F2 – red); panels C (more severe offshore storm, F2) and D (less severe offshore storm, F1) represent surf scaling index for different seasons beach profiles (red summer, blue winter).
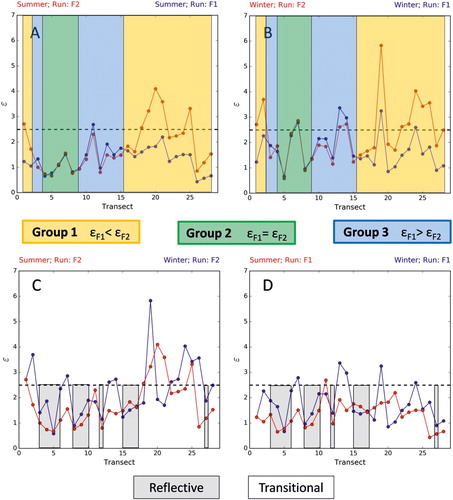
Some similarities arise from the comparison ((A,B)) of the surf-scaling index calculated for the same-season beach profiles (acquired during the same campaign) exposed to different wave events (F1 and F2). The profiles seem to be classified into three groups:
-
T1-T2 and T16-T28, for which
(Group 1)
-
T4-T9, for which
-
T3 and T10-T15
Where is the surf-scaling index associated with the less energetic offshore wave storm and
is associated with the most severe offshore storm (F2).
The beach profiles in Group 1 become less reflective (), passing from less intense offshore perpendicular incident waves (F1) to oblique and more intense offshore wave storms (F2). The beach profiles in Group 3 assume a slightly more reflective condition (
), while the profiles in Group 2 maintain the same configuration:
. When comparing the same wave run to the two seasons’ profiles ((C,D)), the results indicate that the winter profiles are more dissipative than the summer profiles (apart from certain anomalies). The anomalies are found in the following profiles: T11, T15, T16, T20 and T21 during the F1 storm; and T11, T16, T18, T20 and T21 for the F2 storm, for which the summer profiles are slightly more dissipative than the winter ones. Furthermore, upon comparing panels A and C (), it appears that the grouping of the profiles (in the three groups), and therefore their changes in morphodynamic behavior, does not depend on the class they belong to (reflective or transitional).
4.4. Hydrodynamics
(A,B) show a snapshot of the free surface elevation taken at the end of the F1 and F2 simulations.
Figure 3. Hydrodynamic model output. Panels A and B plot a snapshot of the free surface elevation at the end of the simulations. Panels C and D show the mean current distribution on the shoreface. Run 1 – wave from ENE; Run 2 – wave from SE.
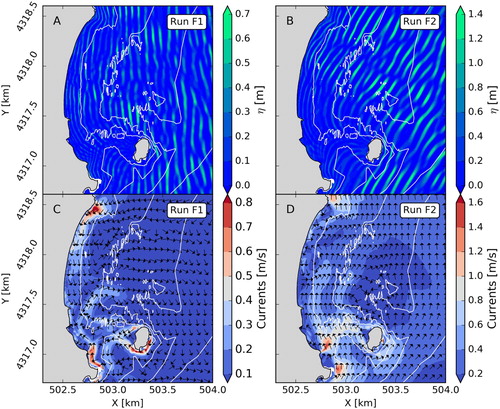
Waves approaching the beach from the ENE direction (Run F1; , Map 4) show an angle with respect to the cross-shore direction which is more pronounced on the northern part of the beach. As a result of the wave-breaking angle of incidence, a southern-oriented longshore current develops on the northern and central part of the beach. This current is in the order of 0.8 m/s on the most northern sector and progressively weakens towards the center of the beach. On the southern part of the beach, wave energy is damped by the influence of San Macario Island; at the same time, refraction and diffraction processes trigger a longshore northern–oriented current with a maximum intensity of 0.7 m/s on the southern-most sector. The two opposite longshore currents converge approximately in front of the river mouth, where a rip current with an intensity of 0.4 m/s develops.
Waves from the SE direction (Run F2; , Map 5) bring considerable energy, especially to the northern sector of the beach, where the wave height at breaking is between 2 and 2.5 m. The southern and central sectors are sheltered by San Macario Island, which reduces the breaking wave height to less than 1 m.
Waves that propagate on the southern side of San Macario break over the rocky shoals in front of the beach, with a large angle of incidence triggering a strong longshore current. This current, which flows towards the North, is particularly intense in the shallow water area, reaching a magnitude in excess of 1.4 m/s. The current reduces in magnitude as it flows towards the central part of the beach. At the northern-most sector, the northern-oriented longshore current is still present, but its magnitude is weak, since waves approach the shoreline almost perpendicularly. These simulations suggest that swells proceeding from the SE do not generate significant rip currents in front of the beach.
5. Discussion and conclusions
The proposed cartography (Main Map) reports the main structural, eco-geomorphological and sedimentological elements that control the main environmental processes of this gravel beach. These features are: the presence of the river mouth in the southern-most area of the beach; the outcropping of the beach-rock along the coastline in the northern sector at a 2 m depth; the Island of San Macario; the deposition of gravelly and coarse-sandy sediment in the beachface; and the seagrass cover. The hydrodynamic processes driven by the incident waves do not seem to produce beach rotation, with the shoreline mainly maintaining its shape in the northern sector, where just small accretion and erosion areas are observed. Meanwhile, changes occur in the southern part where winter storms in combination with river flows modify the beach shoreline near to the river mouth and contribute to the accretion of the spit situated in the southern-most sector. Sediment discharged from the Rio Pula Stream, especially after episodic flooding events, accumulates on the shoreface, forming a pebble bar (Map 1). The longshore and rip currents induced by energetic wave conditions (Run 2; (D)) appear to be able to reshape this bar and transport and redistribute the sediment within the shoreface. Although pebbles can be transported in short timespans and under very low wave conditions (CitationBertoni et al., 2013; CitationGrottoli, Bertoni, Ciavola, & Pozzebon, 2015), the displacement of the pebble component at Foxi Durci Beach towards the North-East sector appears to be limited by the artificial barrier located on the North of the stream mouth. Currently, the presence of pebble and boulder deposits in the northern-most sector can be regarded as the product of cliff weathering.
Moreover, Map 1 suggests that there is a spatial correlation between the distribution of currents and the P. oceanica meadow extension. In fact, P. oceanica is absent in shoreface areas characterized by intense currents (>0.6 m/s). Indeed, it is only in the southern-most sector of the beach that P. oceanica is able to tolerate significant hydrodynamic forcing (>0.6 m/s), possibly because of the presence of rocky outcrops that limit the burial/uprooting of the plants, thus providing a favorable growing environment (CitationMontefalcone et al., 2016; CitationRuju et al., 2018). This behavior highlights the role played by the P. oceanica meadow in the physical equilibrium of the Foxi Durci gravel beach, reducing offshore sediment dispersion and attenuating hydrodynamic forces. This confirms the importance of this benthic habitat globally when it comes to protecting the coastline from erosion (CitationChristianen et al., 2013; CitationDe Falco et al., 2008) and stabilizing the sediment (e.g. CitationDe Falco et al., 2014; CitationDe Muro, Ibba, & Kalb, 2016), further enhancing beach stability, including through the biogenic sediment supply (e.g. CitationDe Muro, Porta, Passarella, & Ibba, 2017; CitationSimeone, De Falco, Como, Olita, & De Muro, 2008).
The beach profiles of Foxi Durci reveal morphodynamic behavior that is mainly reflective, and in some cases intermediate, as expected for gravel and pebble beaches. The beach adapts to changing wave conditions, with profiles behaving differently in different zones. In particular, the groups of beach profiles identified ((A,B)) show similar behavior for both the summer and winter profiles (the two extremes in yearly cycle beach variability), suggesting that the profiles consistently respond to wave forcing, irrespective of the type of forcing condition. The beach profiles in Group 1 tend to dissipate the incident wave energy more, assuming a more intermediate beach profile. In contrast, the beach profiles in Group 3 assume slightly more reflective behavior, with an increasing severiness of offshore wave storms, which seem to be anomalous. However, this might be explained by the propagation of waves towards the coast and the effect of San Macario Island in sheltering the central-southern part of the beach from the intense ESE wave storm (). For the transects in Group 3, which are in fact located in the central-southern part of the beach (Map 3) at breaking, the waves of storm F2 could be less energetic than those of F1. Finally, the profiles in Group 2 maintain the same configuration, independently forming the incident wave conditions. Our results indicate anomalous behavior for some stretches of the Foxi Durci gravelly beach, because the summer profiles are slightly more dissipative than the winter profiles, for the given storm runs.
Several multi-thematic coastal maps have been developed over the last few years as reliable tools to support decision-makers in making better choices with respect to the development of sustainable beach management plans (e.g. CitationAlquini, Bertoni, Sarti, Vieira, & Melo Júnior, 2018; CitationSabato, Longhitano, Gioia, Cilumbriello, & Spalluto, 2012). These maps can support critical planning decisions like potential land use, the vulnerability to beach erosion and the identification of areas designated for protection/conservation. However, only a limited number of maps have the capacity to integrate coastal geomorphology information (onshore and offshore), sediment data, benthic habitats, hydrodynamic modeling (longshore and rip currents) and human impact (CitationBuosi et al., 2017). Compared to other multi-thematic cartographic products, the map of Foxi Durci Beach proposes a multidisciplinary approach that includes the morphodynamic classification of a gravel beach. The classification and its cartographic representation is based on a largely accepted index, which could be duplicated and applied on gravel beaches worldwide. This map is innovatively proposed in order to represent in a unique cartographic product, a synthesis of changes in the morphodynamic responses of different stretches of beaches in various seasons and hydrodynamic conditions. The applications of this cartography to coastal management include: (i) the facilitation of coastal vulnerability assessments of a gravel beach to sea-level rises and erosion; (ii) easy access to up-to-date digital geospatial data and mapping products; and (iii) a baseline study for the future assessment and monitoring of environmental changes. As an example, the concurrent mapping of a dynamic (rip and longshore currents) and a relatively static (P. oceanica meadow) feature on Map 1 allows the integration of these processes to be visualized, understood and maintained in the long term. Another important outcome of this mapping is that it enables the gravel beach response to storms to be understood (reported on Maps 4 and 5), especially when it comes to the increased use of coarse sediment as nourishment material, based on its higher stability in comparison to finer sediment (CitationBramato, Ortega-Sánchez, Mans, & Losada, 2012; CitationNordstrom, Pranzini, Jackson, & Coli, 2008). Although several papers on gravel-beach morphodynamics have been produced in the last decade (CitationBluck, 2011; CitationMcCall, Masselink, Poate, Roelvink, & Almeida, 2015), there are still significant gaps to fill in order to improve the understanding of this type of coastal system (CitationBertoni & Sarti, 2011; CitationDickson, Kench, & Kantor, 2011).
In this view, the comparison of Mediterranean and Australian beach systems could provide further insights into the behavior of these environments, based on the existing similarities between the coastal areas of SW Australia and SW Sardinia, as highlighted by previously published research (CitationDe Muro, Tecchiato, Buosi, et al., 2018; CitationTecchiato et al., 2016). Further studies are thus required to understand geomorphological processes more fully.
Software
Single-beam and DGPS data were acquired and elaborated using Reson PDS2000 and the GNSS Solutions software, respectively. Google Earth GIS was used to calculate distances and angles of wave exposure and fetch of the study area.
The textural data were obtained with the Gradistat software (CitationBlott & Pye, 2001).
The grain-size and the SSS data were processed using Autodesk Map 3D to obtain the grain-size distribution and to identify the main benthic habitat.
The QGIS software was used to organize the dataset and to create the digital cartography. A land–sea DTM was produced by Global Mapper 14. The final map was produced using the Adobe Illustrator CS5 software.
The numerical simulations were performed by the SWAN and XBeach open-source models.
Main Map.pdf
Download PDF (4.6 MB)Acknowledgements
The authors warmly thank the Consorzio di Bonifica Sardegna Meridionale (CBSM). MP gratefully acknowledges Sardinia Regional Government for the financial support of her PhD scholarship (P.O.R. Sardegna F.S.E. Operational Programme of the Autonomous Region of Sardinia, European Social Fund 2007–2013 – Axis IV Human Resources, Objective l.3, Line of Activity l.3.1.). The authors would like to thank the ‘Coastal and Marine Geomorphology Group’ of Cagliari University and the staff of ‘Osservatorio Coste E Ambiente Naturale Sottomarino OCEANS’.
Disclosure statement
No potential conflict of interest was reported by the authors.
ORCID
Carla Buosi http://orcid.org/0000-0003-0530-1825
Angelo Ibba http://orcid.org/0000-0002-4913-657X
Marinella Passarella http://orcid.org/0000-0003-4823-9881
Marco Porta http://orcid.org/0000-0002-2707-681X
Andrea Ruju http://orcid.org/0000-0003-1334-2168
Daniele Trogu http://orcid.org/0000-0002-4209-2498
Sandro De Muro http://orcid.org/0000-0002-3590-7441
Additional information
Funding
Related Research Data
References
- Alquini, F. , Bertoni, D. , Sarti, G. , Vieira, C. V. , & Melo Júnior, J. C. F. (2018). Morpho-sedimentological and vegetational characterization of Grande beach at São Francisco do Sul island (Santa Catarina, Brazil). Journal of Maps 14 , 105–113. doi: 10.1080/17445647.2018.1438317
- Bertoni, D. , Grottoli, E. , Ciavola, P. , Sarti, G. , Benelli, G. , & Pozzebon, A. (2013). On the displacement of marked pebbles on two coarse-clastic beaches during short fair-weather periods (Marina di Pisa and Portonovo, Italy). Geo-Marine Letters , 33 , 463–476. doi: 10.1007/s00367-013-0341-3
- Bertoni, D. , & Sarti, G. (2011). On the profile evolution of three artificial pebble beaches at Marina di Pisa, Italy. Geomorphology , 130 , 244–254. doi: 10.1016/j.geomorph.2011.04.002
- Blott, S. J. , & Pye, K. (2001). GRADISTAT: A grain size distribution and statistics package for the analysis of unconsolidated sediments. Earth Surface Processes and Landforms , 26 (11), 1237–1248. doi: 10.1002/esp.261
- Bluck, B. J. (2011). Structure of gravel beaches and their relationship to tidal range. Sedimentology , 58 (4), 994–1006. doi: 10.1111/j.1365-3091.2010.01192.x
- Bramato, S. , Ortega-Sánchez, M. , Mans, C. , & Losada, M. A. (2012). Natural recovery of a mixed sand and gravel beach after a sequence of a short duration storm and moderate sea states. Journal of Coastal Research , 28 , 89–101. doi: 10.2112/JCOASTRES-D-10-00019.1
- Brambilla, W. , van Rooijen, A. , Simeone, S. , Ibba, A. , & De Muro, S. (2016). Field observations, coastal video monitoring and numerical modeling at Poetto beach, Italy. Journal of Coastal Research , Special Issue, 75 (2), 825–829. doi: 10.2112/SI75-166.1
- Buosi, C. , Tecchiato, S. , Pusceddu, N. , Frongia, P. , Ibba, A. , & De Muro, S. (2017). Geomorphology and sedimentology of Porto Pino, SW Sardinia, western Mediterranean. Journal of Maps , 13 (2), 470–485. doi: 10.1080/17445647.2017.1328318
- Carmignani, L. , Oggiano, G. , Funedda, A. , Conti, P. , & Pasci, S. (2016). The geological map of Sardinia (Italy) at 1:250,000 scale. Journal of Maps , 12 , 826–835. doi: 10.1080/17445647.2015.1084544
- Castillo, M. C. , Baquerizo, A. , & Losada M. A. (2005). Temporal and spatial statistical variability of the wave height in the surf zone. 29th International Conference on Coastal Engineering, Lisbon, Portugal, 2004 (pp. 997–1008).
- Chawla, A. , Spindler, D. , & Tolman, H. (2012). 30 year wave Hindcasts using WAVEWATCH III with CFSR winds: Phase 1. Technical Note, College Park, MD.
- Christianen, M. J. A. , van Belzen, J. , Herman, P. M. J. , van Katwijk, M. M. , Lamers, L. P. M. , van Leent, P. J. M. , & Bouma, T. J. (2013). Low-canopy seagrass beds still provide important coastal protection services. PLoS One , 8 (5), 1–8. doi: 10.1371/journal.pone.0062413
- De Falco, G. , Budillon, F. , Conforti, A. , De Muro, S. , Di Martino, G. , Innangi, S. , … Simeone, S. (2014). Sandy beaches characterization and management of coastal erosion on western Sardinia island (Mediterranean Sea). Journal of Coastal Research , 70 , 395–400. doi: 1,10.2112/SI70-067.1
- De Falco, G. , Simeone, S. , Solinas, G. , Batzella, T. , Cancemi, G. , Cancemi, M. , & De Muro, S. (2008). Shoreline retreat and Posidonia oceanica banquette removal in the beach of Paragan (Southern Corse). Rendiconti Online Della Società Geologica Italiana , 3 (1), 296–297.
- De Muro, S. , Batzella, T. , De Falco, G. , & Porta, M. (2010). Sedimentological map of Bonifacio Strait inner shelf. Rendiconti Online Della Società Geologica Italiana , 11 (2), 752–753.
- De Muro, S. , Batzella, T. , Kalb, C. , & Pusceddu, N. (2008). Sedimentary processes, hydrodynamics and modeling of the beaches of Santa Margherita, Solanas, Cala di Trana and La Sciumara (Sardinia – Italy). Rendiconti Online Della Società Geologica Italiana , 3 (1), 308–309.
- De Muro, S. , Brambati, A. , Tecchiato, S. , Porta, M. , & Ibba, A. (2017). Geomorphology of marine and transitional terraces and raised shorelines between Punta Paulo and Porvenir, Tierra del Fuego, Straits of Magellan–Chile. Journal of Maps , 13 (2), 311–321. doi: 10.1080/17445647.2017.1295406
- De Muro, S. , Ibba, A. , & Kalb, C. (2016). Morpho-sedimentology of a Mediterranean microtidal embayed wave dominated beach system and related inner shelf with Posidonia oceanica meadows: The SE Sardinian coast. Journal of Maps , 12 (3), 558–572. doi: 10.1080/17445647.2015.1051599
- De Muro, S. , Ibba, A. , Simeone, S. , Buosi, C. , & Brambilla, W. (2017). An integrated sea-land approach for mapping geomorphological and sedimentological features in an urban microtidal wave-dominated beach: A case study from S Sardinia, western Mediterranean. Journal of Maps , 13 (2), 822–835. doi: 10.1080/17445647.2017.1389309
- De Muro, S. , Kalb, C. , Ibba, A. , Ferraro, F. , & Ferrara, C. (2010). Sedimentary processes, morphodynamics and sedimentological map of “porto Campana” SCI beaches (Domus De Maria - SW Sardinia). Rendiconti Online Della Società Geologica Italiana , 11 (2), 754–755.
- De Muro, S. , Porta, M. , Passarella, M. , & Ibba, A. (2017). Geomorphology of four wave-dominated microtidal Mediterranean beach systems with Posidonia oceanica meadow: A case study of the northern Sardinia coast. Journal of Maps , 13 (2), 74–85. doi: 10.1080/17445647.2016.1259593
- De Muro, S. , Porta, M. , Pusceddu, N. , Frongia, P. , Passarella, M. , Ruju, A. , … Ibba, A. (2018). Geomorphological processes of a Mediterranean urbanized beach (Sardinia, Gulf of Cagliari). Journal of Maps , 14 (2), 114–122. doi: 10.1080/17445647.2018.1438931
- De Muro, S. , Pusceddu, N. , Buosi, C. , & Ibba, A. (2017). Morphodinamics of a Mediterranean microtidal wave-dominated beach: Forms, processes and insights for coastal management. Journal of Maps , 13 (2), 26–36. doi: 10.1080/17445647.2016.1250681
- De Muro, S. , Pusceddu, N. , & Kalb, C. (2010). Sedimentological map of the seafloor between Porto Pozzo Bay and Capo Ferro - NE Sardinia. Rendiconti Online Della Società Geologica Italiana , 11 (2), 756–757.
- De Muro, S. , Tecchiato, S. , Buosi, C. , Porta, M. , Bachis, M. , & Ibba A. (2018). Geomorphology, sedimentology, benthic habitat as tool for supporting coastal management: Comparison between Australian and Mediterranean beach systems. Journal of Coastal Research , Special Issue, 85 , 1526–1530. doi: 10.2112/SI85-306.1
- De Muro, S. , Tecchiato, S. , Porta, M. , Buosi, C. , & Ibba, A. (2018). Geomorphology of marine and glacio-lacustrine terraces and raised shorelines in the northern sector of Península Brunswick, Patagonia, Straits of Magellan, Chile. Journal of Maps , 14 (2), 135–143. doi: 10.1080/17445647.2018.1441759
- Dickson, M. E. , Kench, P. S. , & Kantor, M. S. (2011). Longshore transport of cobbles on a mixed sand and gravel beach, southern Hawke Bay, New Zealand. Marine Geology , 287 (1-4), 31–42. doi: 10.1016/j.margeo.2011.06.009
- Folk, R. L. (1974). The petrology of sedimentary rocks . Austin, TX : Hemphill Publishing Co.
- Folk, R. L. , & Ward, W. (1957). Brazos river bar [Texas]; a study in the significance of grain size parameters. Journal of Sedimentary Petrology , 27 (1), 3–26. doi: 10.1306/74D70646-2B21-11D7-8648000102C1865D
- Grottoli, E. , Bertoni, D. , & Ciavola, P. (2017). Short- and medium-term response to storms on three Mediterranean coarse-grained beaches. Geomorphology , 295 , 738–748. doi: 10.1016/j.geomorph.2017.08.007
- Grottoli, E. , Bertoni, D. , Ciavola, P. , & Pozzebon, A. (2015). Short term displacements of marked pebbles in the swash zone: Focus on particle shape and size. Marine Geology , 367 , 143–158. doi: 10.1016/j.margeo.2015.06.006
- Guza, R. T. , & Inman, D. L. (1975). Edge waves and beach cusps. Journal of Geophysical Research , 80 (21), 2997–3012. doi: 10.1029/JC080i021p02997
- Infantes, E. , Terrados, G. , Orfila, A. , Canellas, B. , & Alvarez-Ellacuria, A. (2009). Wave energy and the upper depth limit distribution of Posidonia oceanica . Botanica Marina , 52 , 419–427. doi: 10.1515/BOT.2009.050
- Jennings, R. , & Schulmeister, J. (2002). A field based classification scheme for gravel beaches. Marine Geology , 186 , 211–228. doi: 10.1016/S0025-3227(02)00314-6
- Lewis, D. W. , & McConchie, D. (1994). Practical sedimentology . New York, NY : Chapman & Hall.
- Masselink, G. , Hughes, M. , & Knight, J. (2011). Introduction to coastal processes and geomorphology (2nd ed.). London : Routledge.
- McCall, R. T. , Masselink, G. , Poate, T. G. , Roelvink, J. A. , & Almeida, L. P. (2015). Modelling the morphodynamics of gravel beaches during storms with XBeach-G. Coastal Engineering , 103 , 52–66. doi: 10.1016/j.coastaleng.2015.06.002
- Montefalcone, M. , Vacchi, M. , Carbone, C. , Cabella, R. , Schiaffino, C. F. , Elter, F. M. , … Ferrari, M. (2016). Seagrass on the rocks: Posidonia oceanica settled on shallow-water hard substrata withstands wave stress beyond predictions. Estuarine, Coastal and Shelf Science , 180 , 114–122. doi: 10.1016/j.ecss.2016.06.024
- Moura, R. L. , Secchin, N. A. , Amado-Filho, G. M. , Francini-Filho, R. B. , Freitas, M. O. , Minte-Vera, C. V. , … Cardoso Bastos, A. (2013). Spatial patterns of benthic megahabitats and conservation planning in the Abrolhos Bank. Continental Shelf Research , 70 , 109–117. doi: 10.1016/j.csr.2013.04.036
- Nordstrom, K. F. , Pranzini, E. , Jackson, N. L. , & Coli, M. (2008). The marble beaches of Tuscany. Geographical Review , 98 , 280–300. doi: 10.1111/j.1931-0846.2008.tb00300.x
- Poate, T. G. , Masselink, G. , Davisdon, M. , McCall, R. , Russell, P. , & Turner, I. (2013). High frequency in-situ field measurements of morphological response on a fine gravel beach during energetic wave conditions. Marine Geology , 342 , 1–13. doi:10.1016/j.margo.2013.05.009 doi: 10.1016/j.margeo.2013.05.009
- Pontee, N. I. , Pye, K. , & Blott, S. (2004). Morphodynamic behaviour and sedimentary variation of mixed sand and gravel beaches, Suffolk, UK. Journal of Coastal Research , 20 , 256–276. doi: 10.2112/1551-5036(2004)20[256:MBASVO]2.0.CO;2
- Pusceddu, N. , Batzella, T. , Kalb, C. , Ferraro, F. , Ibba, A. , & De Muro, S. (2011). Short-term evolution of the Budoni beach on NE Sardinia (Italy). Rendiconti Online Della Società Geologica Italiana , 17 , 155–159. doi: 2,10.3301/ROL.2011.45
- Ruiz de Alegria-Arzaburu, A. , & Masselink, G. (2010). Storm response and beach rotation on a gravel beach, Slapton sands, U.K. Marine Geology , 278 (1–4), 77–99. doi: 10.1016/j.margeo.2010.09.004
- Ruju, A. , Ibba, A. , Porta, M. , Buosi, C. , Passarella, M. , & De Muro, S. (2018). The role of hydrodynamic forcing, sediment transport processes and bottom substratum in the shoreward development of Posidonia oceanica meadow. Estuarine, Coastal and Shelf Science , 212 , 63–72. doi: 10.1016/j.ecss.2018.06.025
- Sabato, L. , Longhitano, S. G. , Gioia, D. , Cilumbriello, A. , & Spalluto, L. (2012). Sedimentological and morpho-evolution maps of the ‘Bosco Pantano di Policoro’ coastal system (Gulf of Taranto, southern Italy). Journal of Maps 8 , 304–311. doi: 10.1080/17445647.2012.722791
- Short, A. D. (1999). Handbook of beach and shoreface morphodynamics . Great Britain : John Wiley. ISBN 0-471-96570-7.
- Shulmeister, J. , & Kirk, R. M. (1997). Holocene fluvial–coastal interactions on a mixed sand and sand and gravel beach system, North Canterbury, New Zealand. Catena , 30 , 337–355. doi: 10.1016/S0341-8162(97)00013-1
- Simeone, S. , De Falco, G. , Como, S. , Olita, A. , & De Muro, S. (2008). Deposition dynamics of banquettes of Posidonia oceanica in beaches. Rendiconti Online Della Società Geologica Italiana , 3 (2), 726–727.
- Tecchiato, S. , Buosi, C. , Ibba, A. , Ryan, D. A. , & De Muro, S. (2016). A comparison of geomorphic settings, sediment facies and benthic habitats of two carbonate systems of western Mediterranean Sea and south western Australia: Implications for coastal management. Journal of Coastal Research , Special Issue, 75 , 562–566. doi: 10.2112/SI75-113.1
- Tintoré, J. , Medina, R. , Gómez-Pujol, L. , Orfila, A. , & Vizoso, G. (2009). Integrated and interdisciplinary scientific approach to coastal management. Ocean & Coastal Management , 52 (10), 493–505. doi: 10.1016/j.ocecoaman.2009.08.002
- Wentworth, C. K. (1922). A scale of grade and class terms for clastic sediments. The Journal of Geology , 30 , 377–392. doi: 10.1086/622910
Appendixes
Appendix A. Geological map of the study area (from CitationCarmignani et al., 2016; adapted).
Appendix B. Cross-shore profiles showing geomorphological features, submerged bar and P. oceanica meadow at Foxi Durci beach.