
ABSTRACT
On 25 October 1954, a storm hit the area surrounding the villages of Vietri sul Mare and Maiori of the Amalfi Coast (southern Italy) causing more than 300 deaths and severe damage to infrastructures and agriculture. This event has been among the most catastrophic historically documented in Campania Region. On this basis, and considering the lack of an existing complete characterization of the event in terms of triggered slope processes, we used multiple sets of stereoscopic aerial photos and a LiDAR-derived high-resolution topography to produce an event landslide inventory map. Our map provides an overview of the landslide distribution and extent in the area that mainly suffered the effect of the storm and is the basis for a morphometric characterization of landslide source areas that we present in this paper as simplified statistical analysis. In addition, we compared the rainfall distribution with the spatial density of source areas.
1. Introduction
On October 25th, 1954, a storm hit the area surrounding Vietri sul Mare and Maiori villages of the Amalfi Coast (Campania Region, southern Italy, (a)) inducing floods and diffuse landslides that caused more than 300 deaths and severe damage to infrastructures, buildings and local agriculture (e.g. CitationEsposito, Porfido, & Violante, 2003; CitationLazzari, 1954; CitationPenta, Lupino, Camozza, & Esu, 1954; CitationTessitore, Di Martire, Martino, & Calcaterra, 2011; CitationViolante, 2009). This event is among the most catastrophic historically-documented in Campania Region, causing a total economic loss evaluated in about L45 billions (corresponding to an actual value of about €700 millions), and is among those of highest magnitude in Italy (i.e. rainfall intensity; CitationDe Luca, Furcolo, Rossi, Villani, & Vitolo, 2010). It was characterized by a total rainfall higher than 500 mm fallen in approximately 16 h (registered by the Salerno rain gage); the 95% of the total fell in about 7 h (between 19:00 and 2:00 of 25–26 October 1954; CitationS.I.M.N., 1954). It is interesting to note that the storm occurred after a long dry period; this condition possibly influenced its potential as landslide triggers (CitationFiorillo & Wilson, 2004). This event has a number of historical analogues in Campania Region triggering floods and landslides. CitationVennari, Santangelo, Parise, and Santo (2016) recognized approximately 500 rainstorms inducing floods between 1540 and the beginning of 2015. A further example is the storm that, in October 2015, hit the central sector of Benevento Province (southern Italy) that caused 2 deaths and diffuse damages (e.g. CitationGuerriero et al., 2018; CitationMagliulo & Cusano, 2016); this event triggered also a number of destructive landslides in association with floods (e.g. CitationSanto, Santangelo, Forte, & De Falco, 2017).
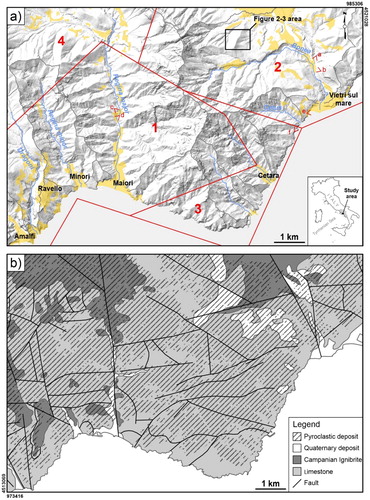
Figure 1. (a) Map showing the study area and its subdivision in landslide mapping perspective. Red labeled polygons indicate regions where specific data and processing/mapping methods were adopted for landslide identification. Light blue lines indicate major streams and grey lines indicate watersheds of the study area. Red symbols indicate position of historical ground based photo reported in and labeled yellow polygons indicate major villages of the study area. (b) Geologic map of the study area simplified from CitationVitale and Ciarcia (2018) showing rocks forming slopes pf the study area. Pyroclastic deposit extent covering reliefs, interpreted by NDVI map, is shown as superimposed symbols. UTM 32 N coordinates are shown at maps edges.
Of particular relevance are also landslides induced by storms in the central and western Campania Region like those occurred in the Sarno and Quindici area in May 1998 (e.g. CitationCascini, Cuomo, & Guida, 2008; CitationGuadagno, Forte, Revellino, Fiorillo, & Focareta, 2005) and at Cervinara in December 1999 (CitationFiorillo, Guadagno, Aquino, & De Blasi, 2001). In the Lattari Mountains, additional destructive landslides occurred in March 2005 at Nocera Inferiore (CitationRevellino et al., 2013), in January 1997 at Pozzano-Castellammare (CitationCalcaterra & Santo, 2004) and in January 1841 at Gragnano (CitationRanieri, 1841). Overall, these landslides have the general characteristics of those resulting from the mobilization of the pyroclastic soils covering steep slopes (e.g. CitationDe Vita, Fusco, Tufano, & Cusano, 2018; CitationFiorillo & Wilson, 2004; CitationGuadagno et al., 2005; CitationNapolitano, Fusco, Baum, Godt, & De Vita, 2016). Following the CitationHungr, Evans, Bovis, and Hutchinson (2001) classification, these landslides can be described as debris avalanches and debris flows, and have velocity up to 20 m/s (CitationRevellino, Hungr, Guadagno, & Evans, 2004). According to CitationHungr, Leroueil, and Picarelli (2014) debris avalanches originate as debris slides in the upper part of the slope and evolve to debris flows as they enter a channel (e.g. CitationFiorillo et al., 2001; CitationRevellino et al., 2004).
The occurrence of these landslides is controlled by the geologic characteristics and morphology of mountainous systems also influenced by human modifications (e.g. CitationGuadagno et al., 2005; CitationVitale & Ciarcia, 2018). These reliefs, consisting of complex associations of monoclines that forms high ridges developed in the Apennine (NW–SE) or anti-Apennine direction (NE–SW), are predominantly formed by limestone sequences ((b)). Such sequences are mantled by layered air-fall pyroclastic soils (CitationMatano, De Chiara, Ferlisi, & Cascini, 2016), derived by the volcanic activity of Vesuvius and Phlegraean Fields, piled up onto a karstified surface of bedrock ((b)). CitationLazzari (1954) considers bedrock surface asperities generated by karstic processes as fundamental for the keeping of pyroclastic cover on slopes. These pyroclastic covers are generally composed of ashy and pumiceous layers, often overlying buried soils, both with variable physical and mechanical properties (CitationEsposito & Guadagno, 1998). This stratigraphy (and its hydrologic/mechanic significance) as well as the high inclination of hillslopes make them prone toward landsliding. In this geological context, vocated to catastrophic events, the evaluation of landslide susceptibility and hazard is of basic importance for land planning and landslide risk mitigation measurement and strategy adoption (CitationGuadagno & Revellino, 2005; CitationRevellino, Guadagno, & Hungr, 2008). Since both susceptibility and hazard evaluation are based on the landslide history of the zone, it is crucial to have a complete knowledge of landslides occurred in the area in terms of location, extent, distribution, typology and possibly age. Most of these data are easily derivable from geomorphological (e.g. CitationConforti, Pascale, & Sdao, 2015; CitationConforti, Pascale, Pepe, Sdao, & Sole, 2013; CitationGuerrero et al., 2012; CitationLazzari & Gioia, 2016; CitationLazzari, Gioia, & Anzidei, 2018; CitationMurillo-García & Alcántara-Ayala, 2017) and event landslide inventories that assumes dramatic importance especially for deriving reliable information about landslide age and conditions of triggering (e.g. CitationArdizzone et al., 2012; CitationFiorillo, Diodato, Meo, & Pagnozzi, 2018).
On this basis and in order to fully document the effects of the October 25th, 1954, storm and, overall, to provide a contribution toward a better knowledge of landslide susceptibility and hazard in the eastern sector of the Amalfi Coast, we prepared an event inventory map of landslides triggered by the storm. In our knowledge, our map completely documents for the first time landslides induced by the storm within the area that mainly suffered its effects. This also as consequence of the short-living landslide trace signature along slopes (few years). Landslide mapping was completed through visual interpretation of historical aerial-photo into a GIS environment and was supported by recently available LiDAR data. On the basis of these data, we made a statistical analysis of morphometric parameters characterizing the identified landslide source areas. Results from this analysis can be considered as a basis of an improved regional landslide susceptibility evaluation. To supplement our analysis, we used available reconstructed rainfall spatial distribution characterizing the storm to make a comparison with spatial density of recognized landslide sources.
2. Data and mapping methods
The 1:10,000 inventory map of landslides triggered by the October 25th, 1954, storm in the Vietri sul Mare-Maiori area, was made using both 800 dpi negative-scans (∼0.4 m ground sample distance) and hard-copy of black and white stereoscopic aerial photos (scale 1:33,000) taken in June 1955 and April 1956 (8 and 18 months after landslides event, respectively). Additional data are recently acquired digital LiDAR topography (1 m single sided pixel dimension, 2012), which were used to derive a 4 m (single sided pixel dimension) shaded relief base for the map.
On the basis of data availability and its processing, the study area can be divided into four different zones where different mapping techniques were used for landslide identification ((a)). In zone 1 and 2, landslide mapping was completed into GIS environment through visual interpretation of digital ortho-rectified aerial images (e.g. CitationKeaton & Degraff, 1996). Images taken in 1955 were used to derive the ortophoto for zone 1 while those taken in 1956 were used for zone 2. In zone 3 and zone 4, it was not possible to complete image digital ortho-rectification due to the absence of a complete image coverage immediately outside from the study areas (i.e. polygon 3 and 4 of ), thus landslide mapping was manually completed through visual interpretation of stereoscopic images using a stereoscope (e.g. Santangelo et al., 2015). Manually mapped landslides were visually transferred to the base map into GIS environment. Landslide transfer was completed considering the topography of the area and the position of landslides mapped at the boundary of zone 1 and 2. It is important to notice that zone 1 and 4 cover most of the Regina Major river basin, which was the area mostly affected by landslides. Zone 2 includes the Bonea basin, which was highly affected as well. Landslide mapping was completed using post-event imagery in the area that mainly suffered the effect of the storm, as reported by historic documents. We assumed that, overall, the mapped landslides were caused by the event of October 1954. This assumption could be reasonable considering the magnitude of the event and typical short living signature of landslide involving the pyroclastic soils mantling slopes of this region.
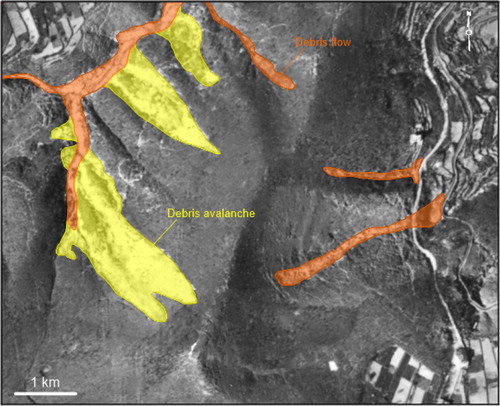
Landslide description was completed using terminology and classification derived from CitationHungr et al. (2001). Especially, in our study area landslides are debris avalanches and debris flows. In both cases, landslide initiation is connected with the occurrence of soil slides that materialize the source area (CitationHungr et al., 2014). In the map, landslides were depicted by polygons without a specific identification of source, transport and deposit areas (). This because of their highly variable size that makes not possible to depict these areas for many of them at the map scale. In addition, it was not possible to identify individual landslides where they tend to coalesce, or objectively distinguish debris avalanche deposit from debris flow deposit next channels. This drawback is mainly connected to the difficulty in interpreting the signature of individual landslides from historic aerial imagery and to its local absence due to successive landslides and/or avalanche to flow transition (i.e. cascade effect). This represents a limitation of our dataset (e.g. CitationMarc & Hovius, 2015). To partially overcome this issue, provides an example of possible interpretation of landslide processes within the area covered by . In this area, debris avalanches occurring along open slopes and soil-slide induced debris flow occurring along channels are marked with different colors. In this zone, as well as in the study area, landslide source areas have a triangular or trapezoidal shape and can be identified as the upper zone of each single landslide characterized by a length along the landslide axis (i.e. axial length) of few to several meters. This simplification is needed since it is not recognizable from aerial image interpretation.
Figure 2. Examples of landslides mapped through visual interpretation of digital ortho-rectified aerial imagery. Yellow lines indicate landsides boundaries and light blue dots indicate source area apexes. See for position of the sample area.
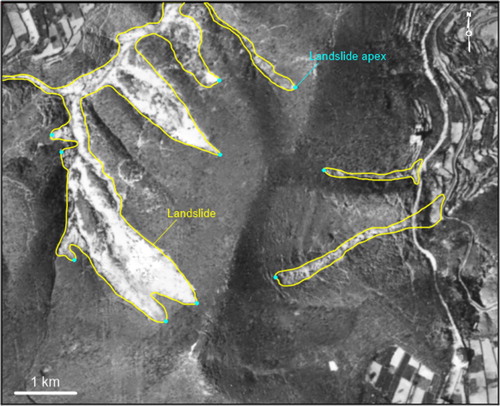
Figure 3. Landslides of classified as function of the process. Yellow areas indicate debris avalanche processes occurring along slopes and outside from channels. Orange areas indicate soil slide initiated debris flow processes occurring within drainage channels.
Once identified, we consistently selected a 6 m buffered circular area around source area apex (i.e. the upper point of the zone, ), which was used as reference for deriving, from the available LiDAR dem, elevation, acclivity, planar curvature and profile curvature of slopes. In this way, we associated with each apex (i.e. source area) the distribution mode of each parameter considered for the analysis (). These data were used as basis to make a simplified statistical analysis consisting in the computation of univariate distribution of morphometric parameters that, being indicative of topographic condition promoting landslide initiation, might guide regional landslide susceptibility estimation. These landslide properties were derived together with landscape properties, in order to allow a simplified comparison. It is clear that for basin or slope scale analysis a further evaluation of the morphometric and stratigraphic singularities (i.e. natural and man-made discontinuities) recognized as responsible for landslide initiation is needed (e.g. CitationGuadagno et al., 2005).
To supplement our analysis, we used the spatial distribution of rainfall reconstructed by the Italian Hydrographic Service (CitationS.I.M.N., 1954) after the event to make a visual-comparative analysis with the spatial density of landslides source areas. The rainfall map was prepared on the basis of data registered by the rain gauge network and local estimates in the Regina Major basin ( and inset map of the Main Map). Especially, quantitative data consisted in cumulative rainfall during the event. Landslide source-areas density was calculated as the number of source area per square kilometer. Such calculation was automatically completed into GIS environment.
3. The landslide inventory map
The Main Map reports the location, extent and distribution of landslides mapped in the study area through GIS-aided and manual visual-interpretation of processed and stereoscopic aerial photos. Inset graphs show major morphometric features of both landscape and landslide source areas in terms of elevation, acclivity, planar and profile curvatures of slopes. The inset map shows the spatial distribution of total rainfall and offers a comparative overview with the spatial density of landslide initiation zones. Overall, we identified more than 1500 landslides of variable dimension (few examples are reported in ). Most of them occur in the central sector of the Regina Major basin and within the Bonea basin. All of these landslides are typically soil slides evolving mainly into debris avalanches and subordinately into debris flows where they reach creeks. Debris avalanche axial length variates from few to hundreds of meters while debris flows travel for hundreds to thousands of meters before to create fan-shaped deposits. Of particular relevance is the debris flow deposit that reached the beach of Vietri sul Mare, which was responsible for its enlargement and created underflow deposit at the mouth of the Bonea stream (CitationLazzari, 1954; CitationViolante, 2009).
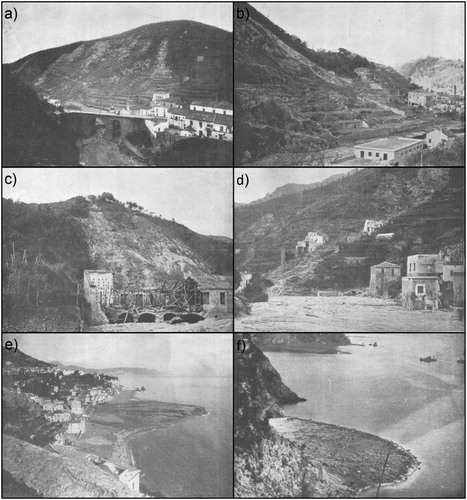
Figure 4. Historic images of the effects of the storm in the Vietri-Maiori area (CitationS.I.M.N., 1954): (a) landslides triggered along the right side of the lower Bonea stream, (b) effects of landslide triggered along the Bonea stream, (c) landslide triggered along the right slope of the Regina Major stream, (d) landslide and flood deposit along the course of the Regina Major stream, (e) debris fan formed at the mouth of the Bonea stream, (f) debris fan formed at the mouth of the Albori torrent. See red symbols of for interpreted positions.
The morphometric analysis of landslide source areas, represented in the inset graphs of the Main Map, indicates that such areas preferentially occurs along slopes characterized by very low planar and profile curvature and inclination around 40°, but variable between 20° and 60°. The mode of distribution of landslide slope angle is slightly higher than that of the landscape. These morphometric values are consistent with the recognized triggering mechanism characterized by an initial slide evolving mainly into avalanche and subordinately into flow. The elevation is highly variable but characterized by a mode of the fit around 500 m. Additionally, it is observable a secondary peak in the elevation bar diagram around 200 m. Our interpretation is that most of the landslides were triggered by the storm at high elevation (i.e. distribution fit mode) while a number of them occurred at lower elevations next the slope base (secondary peak in the bar graph) due to channel erosion induced by debris flowing.
The inset map of the Main Map shows the distribution of cumulated rainfall in the south-western sector of the Lattari Mountain range where the study area is located. The spatial distribution of rainfall of the Italian Hydrographic Service indicates a rainfall concentration on the Salerno-Vietri sul Mare-Maiori area with a peak higher than 500 mm, as registered by meteorological stations, and an east–west elongation. Within the study area, cumulative rainfall variates between 500 mm of the north-eastern sector to approximately 100 mm of the south-western edge. Most of the area is characterized by rainfall higher than 300 mm and more than 400 mm were registered across the Regina Major and the Bonea basins. This distribution seems to match the spatial distribution of landslide source areas but it does not fully match their spatial density which is maximum across the eastern sector of the central Regina Major basin. This mismatch might be related to the limited number and distribution of the meteorological stations that registered the event across the study area, consequently used for its reconstruction, in the assumption that morphometric parameter distribution is approximately steady across the area.
4. Conclusions
The Main Map provides an overview of the distribution of landslides triggered by the storm of October 25th, 1954, in the area surrounding the villages of Vietri sul Mare and Maiori of the Amalfi Coast. For what we know, our map represents the first inventory completely covering the area that mainly suffered the effects of the storm. Overall, we identified more than 1500 landslides that commonly triggered as top-soil slides and subsequently evolved into debris avalanches and flows. Our supplementary analysis indicates that most of them occurred along slopes characterized by extremely low planar and profile curvature (i.e. planar slope), which is a common condition for debris avalanche development. Landslide initiation occurs mainly for slope inclination around 40°. Such data identify the general morphometric characteristics that promote landslide initiation on natural slopes of these geological environments, characterized by steep limestone slopes mantled by pyroclastic deposits, and can be considered as a reference in regional landslide susceptibility evaluation perspective. In this way, the significance of our inventory and collateral analysis is also related to the recent rapid-growing of urban areas (last decades) that is increasing the overall risk connected with the occurrence of rainfall-induced landslides and floods in this area. Additionally, our comparison between density of source areas and rainfall distribution seems to underline a specific spatial cause–effect relation, even if the high intensity of the rainfall, conditioned by the local orographic effect, does not allow a more detailed match between rainfall distribution and landslide source areas.
Software
The map was made using Golden Software Map Viewer 8. Dem analysis and rainfall distribution reconstruction was completed using Quantum GIS, Open Source Geographic Information System, licensed under the GNU General Public License. Quantum GIS is an official project of the Open Source Geospatial Foundation (OSGeo, public domain software).
Map.pdf
Download PDF (53 MB)Disclosure statement
No potential conflict of interest was reported by the authors.
ORCID
Luigi Guerriero http://orcid.org/0000-0002-5837-5409
Paola Revellino http://orcid.org/0000-0001-8303-8407
Francesco M. Guadagno http://orcid.org/0000-0001-5195-3758
Related Research Data
References
- Ardizzone, F. , Basile, G. , Cardinali, M. , Casagli, N. , Del Conte, S. , Del Ventisette, C. , … Terranova, O. (2012). Landslide inventory map for the Briga and the Giampilieri catchments, NE Sicily, Italy. Journal of Maps , 8 , 176–180. doi: 10.1080/17445647.2012.694271
- Calcaterra, D. , & Santo, A. (2004). The January 10, 1997 Pozzano landslide, Sorrento Peninsula, Italy. Engineering Geology , 75 , 181–200. doi: 10.1016/j.enggeo.2004.05.009
- Cascini, L. , Cuomo, S. , & Guida, D. (2008). Typical source areas of May 1998 flow-like mass movements in the Campania region, Southern Italy. Engineering Geology , 96 , 107–125. doi: 10.1016/j.enggeo.2007.10.003
- Conforti, M. , Pascale, S. , Pepe, M. , Sdao, F. , & Sole, A. (2013). Denudation processes and landforms map of the Camastra River catchment (Basilicata – South Italy). Journal of Maps , 9 , 444–455. doi: 10.1080/17445647.2013.804797
- Conforti, M. , Pascale, S. , & Sdao, F. (2015). Mass movements inventory map of the Rubbio stream catchment (Basilicata – South Italy). Journal of Maps , 11 , 454–463. doi: 10.1080/17445647.2014.924038
- De Luca, C. , Furcolo, P. , Rossi, F. , Villani, P. , & Vitolo, C. (2010, May 23–25). Extreme rainfall in the Mediterranean. Proceedings of international workshop on “Advances in statistical hydrology”, STAHY 2010, Taormina, Italy.
- De Vita, P. , Fusco, F. , Tufano, R. , & Cusano, D. (2018). Seasonal and event-based hydrological and slope stability modeling of pyroclastic fall deposits covering slopes in Campania (Southern Italy). Water , 10 , 1140. doi: 10.3390/w10091140
- Esposito, E. , Porfido, S. , & Violante, C. (2003, May 11–13). Reconstruction and recurrence of flood-induced geological effects: The Vietri sul Mare case history (Amalfi Coast, southern Italy). Proceedings of international conference on fast slope movements: Prediction and prevention for risk mitigation, Naples, Italy, 2003, 169–172, Pàtron Editore, Padova, Italy.
- Esposito, L. , & Guadagno, F. M. (1998). Some special geotechnical properties of pumice deposits. Bulletin of Engineering Geology and the Environment , 57 , 41–50. doi: 10.1007/s100640050019
- Fiorillo, F. , Diodato, N. , Meo, M. , & Pagnozzi, M. (2018). Landslides and flash floods induced by the storm of 22nd November 2011 in northeastern Sicily. Environmental Earth Sciences , 77 , 602. doi: 10.1007/s12665-018-7788-5
- Fiorillo, F. , Guadagno, F. , Aquino, S. , & De Blasi, A. (2001). The December 1999 Cervinara landslides: Further debris flows in the pyroclastic deposits of Campania (southern Italy). Bulletin of Engineering Geology and the Environment , 60 , 171–184. doi: 10.1007/s100640000093
- Fiorillo, F. , & Wilson, R. C. (2004). Rainfall induced debris flows in pyroclastic deposits, Campania (southern Italy). Engineering Geology , 75 , 263–289. doi: 10.1016/j.enggeo.2004.06.014
- Guadagno, F. M. , Forte, R. , Revellino, P. , Fiorillo, F. , & Focareta, M. (2005). Some aspects of the initiation of debris avalanches in the Campania region: The role of morphological slope discontinuities and the development of failure. Geomorphology , 66 , 237–254. doi: 10.1016/j.geomorph.2004.09.024
- Guadagno, F. M. , & Revellino, P. (2005). Debris avalanches and debris flows of the Campania Region (Southern Italy). In: Debris-Flow Hazards and Related Phenomena Matthias Jakob and Oldrich Hungr (eds.), Springer and Praxis editorials. ISBN: 978-3-540-20726-9.
- Guerrero, J. , Gutiérrez, F. , Carbonel, D. , Bonachea, J. , Garcia-Ruiz, J. M. , Galve, J. P. , & Lucha, P. (2012). 1:5000 landslide map of the upper Gállego Valley (central Spanish Pyrenees). Journal of Maps , 8 , 484–491. doi: 10.1080/17445647.2012.751345
- Guerriero, L. , Focareta, M. , Fusco, G. , Rabuano, R. , Guadagno, F. M. , & Revellino, P. (2018). Flood hazard of major river segments, Benevento Province, Southern Italy. Journal of Maps , 14 , 597–606. doi: 10.1080/17445647.2018.1526718
- Hungr, O. , Evans, S. G. , Bovis, M. , & Hutchinson, J. N. (2001). Review of the classification of landslides of the flow type. Environmental and Engineering Geosciences , 7 , 1–18.
- Hungr, O. , Leroueil, S. , & Picarelli, L. (2014). The Varnes classification of landslide types, an update. Landslides , 11 , 167–194. doi: 10.1007/s10346-013-0436-y
- Keaton, J. R. , & Degraff, J. V. (1996). Surface observation and geologic mapping. In A. K. Turner , & R. L. Schuster (Eds.), Landslides Investigation and mitigation: Transportation research Board Special Report 247 (pp. 178–230). Washington, DC : National Academy Press.
- Lazzari, A. (1954). Aspetti geologici dei fenomeni verificatisi nel Salernitano in conseguenza del nubrifagio del 25–26 ottobre 1954. Bollettino Società dei Naturalisti in Napoli , 68 , 131–142.
- Lazzari, M. , & Gioia, D. (2016). Regional-scale landslide inventory, central-western sector of the Basilicata region (Southern Apennines, Italy). Journal of Maps , 12 , 852–859. doi: 10.1080/17445647.2015.1091749
- Lazzari, M. , Gioia, D. , & Anzidei, B. (2018). Landslide inventory of the Basilicata region (Southern Italy). Journal of Maps , 14 , 348–356. doi: 10.1080/17445647.2018.1475309
- Magliulo, P. , & Cusano, A. (2016). Geomorphology of the lower Calore river alluvial plain (southern Italy). Journal of Maps , 12 , 1119–1127. doi: 10.1080/17445647.2015.1132277
- Marc, O. , & Hovius, N. (2015). Amalgamation in landslide maps: Effects and automatic detection. Natural Hazards and Earth System Sciences , 15 , 723–733. doi: 10.5194/nhess-15-723-2015
- Matano, F. , De Chiara, G. , Ferlisi, S. , & Cascini, L. (2016). Thickness of pyroclastic cover beds: The case study of Mount Albino (Campania region, southern Italy). Journal of Maps , 12 , 79–87. doi: 10.1080/17445647.2016.1158668
- Murillo-García, F. G. , & Alcántara-Ayala, I. (2017). Landslide inventory, Teziutlán municipality, Puebla, México (1942–2015). Journal of Maps , 13 , 767–776. doi: 10.1080/17445647.2017.1381194
- Napolitano, E. , Fusco, F. , Baum, R. L. , Godt, J. W. , & De Vita, P. (2016). Effect of antecedent-hydrological conditions on rainfall triggering of debris flows in ash-fall pyroclastic mantled slopes of Campania (southern Italy). Landslides , 13 , 967–983. doi: 10.1007/s10346-015-0647-5
- Penta, F. , Lupino, R. , Camozza, F. , & Esu, F. (1954). Effetti dell’alluvione del 26 ottobre 1954 nel Salernitano. Rivista Italiana di Geotecnica , 6 , 245–257.
- Ranieri, C. (1841). Sul funesto avvenimento della notte dal 21 al 22 gennaio 1841 nel comune di Gragnano. Boerio, Napoli.
- Revellino, P. , Guadagno, F. M. , & Hungr, O. (2008). Morphological methods and dynamic modelling in landslide hazard assessment of the Campania Apennine carbonate slope. Landslides , 5 , 59–70. doi: 10.1007/s10346-007-0103-2
- Revellino, P. , Guerriero, L. , Grelle, G. , Hungr, O. , Fiorillo, F. , Esposito, L. , & Guadagno, F. M. (2013). Initiation and propagation of the 2005 debris avalanche at Nocera Inferiore (Southern Italy). Italian Journal of Geosciences , 132 , 366–379. doi: 10.3301/IJG.2013.02
- Revellino, P. , Hungr, O. , Guadagno, F. M. , & Evans, S. G. (2004). Velocity and runout simulation of destructive debris flows and debris avalanches in pyroclastic deposits, Campania region, Italy. Environmental Geology , 45 , 295–311. doi: 10.1007/s00254-003-0885-z
- S.I.M.N . (1954). Annali idrologici, 1954, Parte II – Servizio Idrografico e Mareografico Nazionale, Napoli (http://www.acq.isprambiente.it/annalipdf)
- Santo, A. , Santangelo, N. , Forte, G. , & De Falco, M. (2017). Post flash flood survey: The 14th and 15th October 2015 event in the Paupisi-Solopaca area (Southern Italy). Journal of Maps , 13 , 19–25. doi: 10.1080/17445647.2016.1249034
- Tessitore, S. , Di Martire, D. , Martino, R. , & Calcaterra, D. (2011). Comparison of 2d models for the simulation of the October 1954 debris flow and flood event at maiori (Campania region, Italy). International Conference on Debris-Flow Hazards Mitigation: Mechanics, Prediction, and Assessment, Proceedings , 513–522.
- Vennari, C. , Santangelo, N. , Parise, M. , & Santo, A. (2016). A database on flash flood events in Campania, southern Italy, with an evaluation of their spatial and temporal distribution. Natural Hazards and Earth System Sciences , 16 , 2485–2500. doi: 10.5194/nhess-16-2485-2016
- Violante, C. (2009). Rocky coast: Geological constraints for hazard assessment. In C. Violante (Ed.), Geohazard in Rocky Coastal area. The geological Society ( Vol. 322, pp. 1–31). London : Special Publication.
- Vitale, S. , & Ciarcia, S. (2018). Tectono-stratigraphic setting of the Campania region (southern Italy). Journal of Maps , 14 , 9–21. doi: 10.1080/17445647.2018.1424655