
ABSTRACT
The landscape of the surroundings of the Melka Kunture prehistoric site, Upper Awash Basin, Ethiopia, were studied intensively in the last decades. Nonetheless, the area was mainly characterized under a stratigraphic/geological and archaeological point of view. However, a detailed geomorphological map is still lacking. Hence, in this study, we identify, map and visualize geomorphological forms and processes. The morphology of the forms, as well as the related processes, were remotely sensed with available high-resolution airborne and satellite sources and calibrated and validated through extensive field work conducted in 2013 and 2014. Furthermore, we integrated multispectral satellite imagery to classify areas affected by intensive erosion processes and/or anthropic activities. The Main Map at 1:15,000 scale reveals structural landforms as well as intensive water-related degradation processes in the Upper Awash Basin. Moreover, the map is available as an interactive WebGIS application providing further information and detail (www.roceeh.net/ethiopia_geomorphological_map/).
1. Introduction
The prehistoric site of Melka Kunture, on the right banks of the upper Awash River, is a rich and complex archaeological and palaeontological area, extending over 90 km2, which was discovered in 1963 (CitationChavaillon & Berthelet, 2004). A French mission directed by Jean Chavaillon (1965–1982/1993–1995) investigated at first systematically the site. Since 1999, an Italian mission directed by Marcello Piperno (1999–2010), and currently by Margherita Mussi of ‘La Sapienza’ University, Rome, conducts in-depth research at Melka Kunture. The lithostratigraphy of the area was investigated from the beginning of the excavations, revealing at least 70 archaeological horizons (CitationAltamura et al., 2018). About 30 of them were extensively excavated or tested (CitationPiperno, 2001). Since the upper Miocene, volcanic activity interrupted frequently the erosion and sedimentation stages (CitationChavaillon & Taieb, 1986; CitationTaieb, 1974).
Volcanic products such as tuffs and lavas are generally interbedded with fluvial gravels, pebbles and sands (CitationRaynal & Kieffer, 2004; CitationTaieb, 1974). The tephra records allow for a stratigraphic correlation of archaeological horizons found in the gullies of the tributaries of the Upper Awash, or along the River itself (CitationGeraads, Gallotti, Raynal, Bonnefille, & Mussi, in press; CitationMendez-Quintas et al., 2019; CitationMorgan et al., 2012; CitationPiperno, 2001). Endogenic activities related to the development of the Rift Valley such as volcanism and tectonics (CitationKusák, Kropáček, Vilímek, & Schillaci, 2016) are undoubtedly the dominant driving factors in landscape evolution. Hence, lava deposits such as basalts and pyroclastics like ignimbrites characterize the region.
However, even though the area was studied under various aspects, up till now a detailed geomorphological map of the region is not available. Thus, the main aim of this study is to generate an inventory of the geomorphological processes and related forms and features of the Melka Kunture area. Moreover, the study contributes to the understanding of the process dynamics and genesis of the landscape. In this context, we conducted several geomorphological surveys to reveal the components of the landscape, subject to alteration, erosion, transport and deposition processes induced by endogenic and exogenous driving forces as well as human activities. With the increasing amount of high-resolution satellite information, landforms and processes, especially of remote areas, can be assessed (CitationDaba, Rieger, & Strauss, 2003; CitationTamene and Vlek 2008; CitationBouaziz, Matschullat, & Gloaguen, 2011). We mapped the dominant morphogenetic processes taking into account detailed geologic information (CitationPoppe et al., 2013; CitationSalvini, Riccucci, & Francioni, 2012; CitationSembroni, Molin, Dramis, & Abebe, 2017; CitationSt.-Onge, 1981; CitationVerstappen & Van Zuidam, 1968) as well as additional geomorphic, pedologic and remote sensing information (CitationKropáček, Schillaci, Salvini, & Maerker, 2016; CitationMaerker, Schillaci, & Kropáček, 2018). In order to comprehend and illustrate the complexity of the study area our integrated approach exploits (i) high-resolution topographic data for morphometric analyses, (ii) local information on geology and morpho-structural settings, (iii) multispectral information to characterize surface substrates and processes and (iv) analogue and digital visualization techniques to illustrate the final map content.
2. Study area
The study site is located 50 km southwest of Addis Ababa (). It is close to the Butajira Road and to the Awash village, located on the Ethiopian plateau at about 2000 m a. s. l. (8°46′13″N; 38°33′30″E, 8°46′13″N; 38°38′3″E, 8°41′27″N; 38°33′30″E, 8°41′27″N; 38°38′3″E) (). The Awash basin drains into the Rift Valley system, and represents one of the major tributaries covering large parts of the Oromia region. The tributaries of the Upper Awash River consist of ephemeral flows fed by a seasonal precipitation regime: Belg (June–October) and Keremt (February–April) (CitationBilli & Dramis, 2003). The tributaries are often falling dry during the late dry season (December–February). The main archaeological excavation area lies on the right bank of the Awash River but also extends to the left bank, and covers an area including some of its small and/or ephemeral tributaries such asAtebela and Tuka Meja (). Endogenic processes such as the extensive presence of uplift, jointing and faulting phenomena are related to the development of the main Ethiopian Rift, which is linked to Miocene and Plio-Pleistocene volcanism. Hence, the relief of the study area is characterized by a semi-graben fault system (CitationGallotti, Raynal, Geraads, & Mussi, 2014) striking from ENE to WSW and induced by volcanic events. Tuffaceous beds in the study area are recognized as distal volcanic products. They are described in detail by CitationRaynal and Kieffer (2004) and mapped by CitationSalvini et al. (2012). Tuff formations are caused by Phreatomagmatic and Plinian-phreatic activities and build up the so-called non-welded ignimbrites (CitationSalvini et al., 2012), which are extensively characterizing the southern parts of the archaeological area.
Figure 1. Study area around the Melka Kunture archaeological area, showing the main excavation sites.
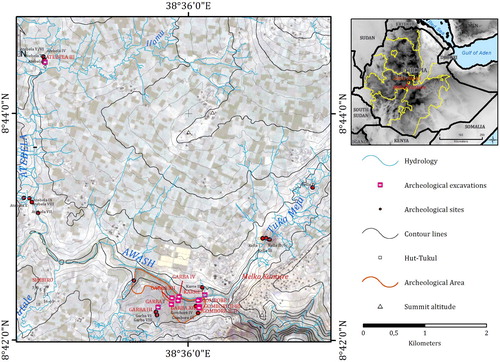
The archeological sites on the right bank of the Upper Awash River which cluster in the Gombore, Garba and Simbiro gullies (CitationBerthelet & Chavaillon, 2004; CitationEgels, 1971) have been extensively investigated. The archaeological sequences include volcanic and sedimentary deposits that are affected by water erosion resulting in gully systems with a typical length of 0.5–1 km. These gullies represent small torrential tributaries of the Upper Awash River.
The precipitation record (1987–2014) of the Awash-Melka Kunture station (located ca. 1 km northeast of the Melka Kunture Museum), shows an average yearly rainfall of approximately 1000 mm y−1 with a clear pattern of high inter-annual variability. The precipitation regime is characterized by a short rainy season between March and April and a main wet season between July and September. The maximum precipitation of 73.4 mm/day was recorded on 4 September 1993, whilst the monthly maximum of 506 mm was registered in August 2011 (National Meteorology Agency, Addis Ababa). High intensity rainfall due to convection occurs especially during July, August and September.
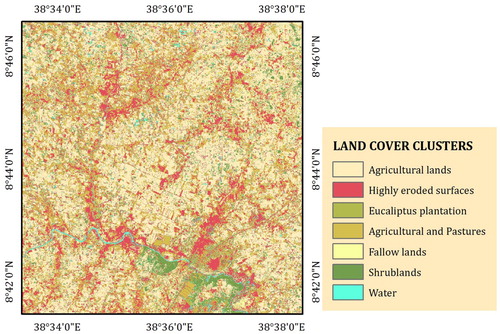
During dry periods, a scarce vegetation cover characterizes the area. The main land use is represented by extensive agriculture with Lentil, Tef, Sorghum, Wheat as well as pasture (see ). Slopes around the villages are cultivated, but, the high density of sheep, goats and cattle lead to overgrazing, resulting in the degradation of vegetation cover, soil compaction, increased surface runoff and soil erosion. Close to the villages, Eucalyptus plantations are frequently present (CitationYitebitu, 2010). The vegetation formations of the region consist of secondary grassland and wooded grassland with various Euphorbia ssp. and Acacia ssp.. Lowlands are dominated by C4 grasses (CitationWhite, 1983).
Figure 2. Land cover from RapidEye satellite image.
The typical soils of the area are shallow and with high skeleton content (Leptosols/Regosols according to WRB) (CitationIUSS Working Group WRB 2014). In gently sloping and flat areas, brown or black clay rich soils dominate such as Vertic Umbrisols and Vertisols (CitationIUSS Working Group WRB 2014) (see ).
Figure 3. (a) View of the Melka Kunture landscape characterized by Vertisols; (b) Vertisol profile.
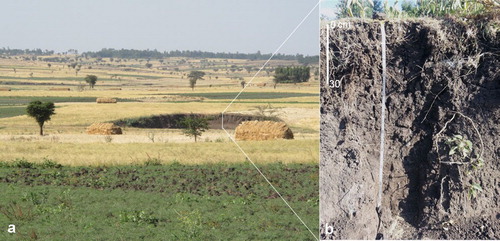
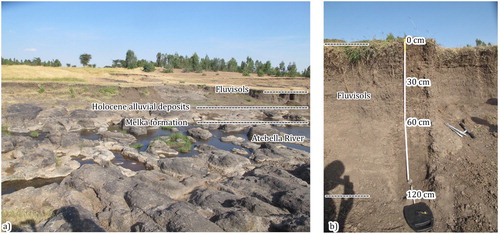
Flood plains are characterized by clay rich Fluvisols (Gleysols). Foothills consist of colluvial sediments of different texture and depth. Vertisols () and Fluvisols () represent the main soil types of the area (CitationDebele 1985).
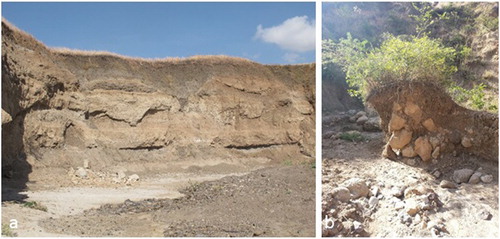
Figure 4. (a) Morphological and stratigraphical settings of the Atebela River banks, (b) profile of a Fluvisols.
3. Materials and methods
We performed a multiresolution interpretation of aerial photos and satellite images supported by an extensive validation in the field conducted in 2013 and 2014. We assessed typology and activity status of the landforms as well as of the geomorphological processes currently affecting the area. We mapped the dominant landforms taking into account detailed geologic information (CitationSalvini et al., 2012; CitationVerstappen & Van Zuidam, 1968) and information provided by the archaeological excavations (CitationGallotti et al., 2014; CitationMussi, Altamura, Bonnefille, De Rita, & Melis, 2016; CitationMussi, Altamura, Macchiarelli, Melis, & Spinapolice, 2014; CitationTamrat, Thouveny, Taieb, & Brugal, 2014).
3.1. Digital elevation model generation
We collected aerial photographs at 1:30,000 scale at the Ethiopian Mapping Agency EMA (Addis Ababa). In total, we purchased 34 images from 1972 scanned with 1024 dpi resolution and 1-meter ground resolution. The DEM was derived using an aerial photogrammetric technique called Structure from Motion (SfM) (see Supplementary materials section for details).
Based on the DEM we calculated several topographic indices following CitationWilson and Gallant (2000) and CitationHengl and Reuter (2009) that facilitate the geomorphological interpretation of forms and processes using the System for Automated Geoscientific Analyses (SAGA) (see CitationConrad 2006; CitationOlaya and Conrad, 2008). The DEM was hydrologically corrected to eliminate sinks using the algorithm proposed by CitationPlanchon and Darboux (2001). The following topographic indices were derived: (i) Slope, (ii) plan, (iii) profile curvature, (iv) flow accumulation/catchment area using multiple flow algorithm (CitationTarboton, 1997), (v) transport capacity index (TCI), (vi) stream power index (SPI), and (vii) altitude above channel network (AACN) (see CitationVogel & Maerker, 2010). Slope gives general information on terrain steepness like escarpments, faults, or embankments. Curvatures indicate erosion transport and deposition landforms. TCI highlight areas potentially affected by sheet erosion whereas linear erosion features are revealed by the SPI. AACN shows surfaces that have a specific vertical distance to the river network such as fluvial terrace systems.
3.2. Mapping approach
The selection of mapping techniques and symbols followed an adapted approach combining the GIS related system proposed by CitationGustavsson, Kolstrup, and Seijmonsbergen (2006) for geology and substrates and the traditional Italian geomorphological classification system for gravity and hydro-erosive slope processes and forms. Moreover, we used part of the classical symbology for the landforms following CitationOtto and Dickau (2004), and some symbols proposed by CitationGustavsson et al. (2006, Citation2008). Specifically, the legend is composed by elements describing: (i) Topography, (ii) Hydrology, (iii) Structural elements and landforms, (iv) Lithology, (v) Gravitative landforms, (vi) Morphometry, (vii) Exogenic Geomorphological Processes and (viii) Erosional landforms.
The road infrastructure is based mainly on Google open street map (Google) whereas the toponyms were taken from the official topographical sheet Melka Kunture 1:25,000 provided by the Ethiopian Mapping Agency. We derived contour lines from the high-resolution DEM with 5 m resolution based on stereo aerial photographs from 1972 (see above section 3.1). Nonetheless, the DEM represents the situation in 1972 fieldwork conducted in 2013/2014 reveals that the topography is changing only very little especially in the areas where we have gully erosion (headcuts) or intensive bank erosion. We corrected the DEM with the respective GPS information accordingly. Furthermore, we adopted colours of the geomorphological features following CitationGustavsson (2006) and CitationGustavsson et al. (2006). Specific codes and hatchings were used to represent the present lithology based on the ArcMap USGS lithology library palette.
We assessed the spatial distribution of the erosion features by extensive field mapping (2013/2014). The mapping campaigns were prepared by a detailed stereo photo interpretation (CitationVan Zuidam, 1985) morphometric analysis and expert knowledge based on the high-resolution DEM and the satellite imagery. Features such as surface soil erosion, linear erosion, and rock toppling have been successfully mapped. Additionally, a detailed terrain analysis aiming at the characterization of the landforms has been performed yielding a slope map that was subsequently used to delineate significant slope breaks. Areas affected by or with a high potential for sheet erosion are assessed using the TCI whereas linear erosion features are revealed by the SPI.
The breaks in slope have been represented with linear symbols (after CitationGustavsson et al., 2006). Significant changes in slopes such as fault systems, river bed incisions or meander banks were mapped overlaying the slope map to the aerial photographs and the RapidEye imagery. Specific morphological features like gully erosion, have been illustrated with line type symbols, whilst badlands/heavily eroded areas and sheet erosion were mapped with polygonal features and illustrated in a purple scale. For the gully susceptibility, we used the Stream Power Index (SPI) following CitationFinlayson and Montgomery (2003). Specifically, the legend is composed by elements describing: (i) Topography, (ii) Lithology, (iii) Hydrology, (iv) Structural elements and landforms, (v) Gravitative landforms, (vi) Morphometry, (vii) Exogenic Geomorphological Processes, and (viii) Erosional landforms.
3.3. Geomorphological processes assessment
We assessed the spatial distribution of the geomorphological features and processes combining fieldwork information, morphometric analysis based on the high-resolution DEM and a stereo aerial photo interpretation (API) approach following CitationVan Zuidam (1985). We identified and mapped in detail the morphological forms and features according to their typical shape and according to their position in the landscape. Therefore, we selected the potential areas for specific processes using the topographic indices: TCI as proxy for sheet erosion, SPI for rill and gully erosion, AACN for river terraces identification. Flow accumulation/Catchment area to specify the river network. Specific morphological features like gully erosion were illustrated with line type symbols whilst badlands/heavily eroded areas and sheet erosion were mapped with polygonal features. The indices also yield valuable information about the tectonic fault zones or uplifted sections since they are traced by abrupt changes in the landscape gradients. Especially, fault scarps in the basalts are the most evident sign of tectonic activity in the area. Furthermore, river systems and drainages are characterized by the river bankfull height and river floodplain area (CitationRosgen, 1996); the bankfull stage is represented by a blue hatched symbol while the floodplain is represented by green colour. Moreover, hydrological features, are represented in blue colours. Linear symbols were utilized to map active river banks. The bankfull levels were mapped according to CitationArnett and Williams (1978) using the AACN. The main drainages contribute significantly to the sediment transport. Based on the high-resolution DEM and extensive fieldwork we delineated drainage cross-sections and longitudinal profiles. Particularly their longitudinal profiles give important information on the erosional (steep parts or knickpoints) and depositional (flat sections) areas, as well as on the local erosion base levels.
Finally, the areas, identified by the abovementioned terrain indices, that show high susceptibilities for the respective forms and processes were checked with a detailed API and an extensive ground truth in 2013 and 2014.
3.4. Visualization
In order to cover the study area with appropriate detail, we present the mapped geomorphological forms and processes in two different formats: (i) an analogue classic map and (ii) a digital WebGIS-based visualization (see: www.roceeh.net/ethiopia_geomorphological_map/).
The classic analogue map at 1:15,000 scale is projected in the UTM system. For orientation, an index grid was plotted on top as well as major UTM coordinates. The grid lines are numbered from A to E for the longitudinal axis and from 1 to 5 for the latitudinal axis. In this paper, we use this grid to localize the mapped features (e.g. A3, B4, etc.). The legend is aligned to the right of the map. Some of the mapped features are shown in the lower right of the map. In the upper right a general overview is given to locate the study area in central Ethiopia.
We generated digital visualization using a framework based on open source software Geonetworks (3.0.5.0), Geosever (2.9.4) and QGIS (2.18.4) software and the Leaflet JavaScript Library (1.2.0).
More details are found in the Supplemental materials section.
4. Results and discussion
The geomorphological map represents an inventory of landforms, and geomorphological processes. Endogenic processes result in structural features like faults, and volcanic surfaces. The latter are the major landforms dominating the area. Moreover, exogenic processes related to climatic conditions and specific land use pattern profoundly shape the landscape. At the mesoscale, landform units and processes of the surroundings of Melka Kunture are represented by the following forms and features related to (i) structural elements and forms, (ii) fluvial processes and forms; (iii) water erosion processes and forms; (iv) gravitative processes and forms; and (v) anthropogenic forms and features.
4.1. Structural elements and landforms
The major fault systems were identified using the terrain indices TCI and the visual interpretation of the shaded relief high-resolution DEM. The map shows parallel faults that can be attributed to a half-graben system striking in a WSW to ESE direction. Perpendicular to this direction secondary fault systems can be observed. The Melka Kunture archaeological area is located in a graben zone. Since the surrounding areas are uplifted the study region was subject to deposition processes documented by sedimentary units (Tuka Meja-, Kella- and Melka Formations) (see ).
Figure 5. Bank erosion (a) Tuka Meja drainage (b) Godeti drainage.
Moreover, the river morphology reflects the main direction of the fault systems. Finally, the tectonic structures, in turn, trigger the lithological contacts between pyroclastic deposits and effusive rocks as well as the contacts to the sedimentary deposits. The so-called welded ignimbrites at the northern headwaters form major scarps. Basalts, welded ignimbrites and Kella Formation deposits made up of ignimbritic tuff and vesicular pumices. They occur at the south eastern border of the area, where tectonic contacts between these units can be observed.
4.2. Fluvial processes and related forms and features
The Upper Awash flows from the West to the East across the Oromia region, characterized by a low gradient meandering river morphology. It shows a high incision rate showing a moderate riffle/pool bed morphology. The classification proposed by CitationRosgen (1996) indicates a Stream Type C, consisting in a single thread channel with moderate to high depth and moderate to high sinuosity. At the confluence with the Atebela drainage, the banks are often less than two metres high and are detectable only by field observations. The tectonic activity played a strong role controlling river morphology and valley forms and features. Floodplains are well defined for low gradient river section whereas an increase of their slopes can be observed at the confluence with the Melka Dula tributary (see E3). At this section, the river cuts into the bedrock and becomes steeply entrenched corresponding to Stream Type A according to CitationRosgen (1996). Moreover, the section is characterized by high energy cascades. We define the Upper Awash tributaries in the study area generally as low gradient meandering with a low width/depth ratio and frequently eroded banks (). Their cross-sections are rectangular with almost vertical banks, of 2–4 m high, corresponding to Stream Type E following (CitationRosgen 1996). In the lower terrain positions the soils are well-drained, porous, and classified as Fluvisols showing recent signs of stratification and sedimentation (CitationIUSS Working Group WRB 2014). The Fluvisols () receive fresh material due to regular flooding events.
4.3. Water erosion processes and related forms and features
Erosion processes affect mainly the soils and weak sedimentary deposits even on low sloping areas. Especially the Vertisols show high potential for soil erosion processes due to active layer clays and the resulting soil cracks forming during the dry season with up to 2 m depth. These cracks represent preferential pathways for water infiltrating during first precipitation events. Hence, forming pipes within the substrates and soils that grow and finally collapse representing initial stages of gully erosion (). Once the soil gets wet, the active layer clays swell and subsequently cracks close. Therefore, in wet conditions Vertisols may produce a remarkable amount of surface runoff following intensive precipitation events due to infiltration excess related to the small pore diameter of the clay dominated soil matrix. The surface runoff, in turn, detaches soil or substrate particles and transports them along the drainage network.
Figure 6. (a) Sheet erosion, (b) Rill erosion, (c) Gully erosion, (d) Badlands.
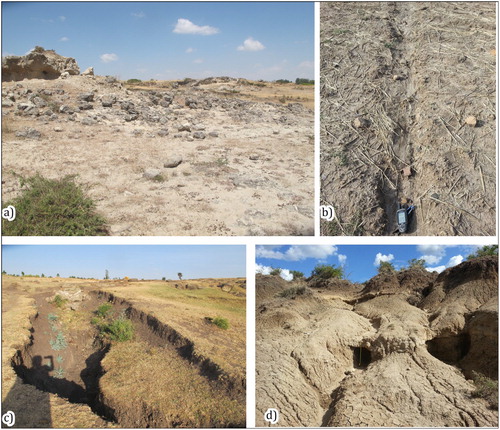
In the study area erosion processes can be observed particularly on the south-western slopes, adjacent to the Godeti gully (see map B5). Fine grained slope wash colluvial material is deposited at the base of the mayor incisions. High amounts of sediments are produced especially when single, intensive rainfall events affect freshly ploughed fields. Agricultural activity is mainly concentrating in the area north-west of the Wufi-Atebela archaeological sites.
Deep linear incision such as gully systems are found in the core archaeological area (e.g. ). We found continuous retrogressive dendritic gullies and discontinuous gullies related to local incisions. The length of these gullies varies between 10 and 1000 m. Gully systems tend to have a dendritic shape and a headwater catchment area of about 1000/10,000 m2. The headcuts of gullies are often characterized by pipe outlets. The depth of the gullies increases downstream, reaching a few metres close to the Awash River (e.g. Godedi area, B5). For and in-depth description of the gully erosion please see the Supplemental Materials section.
4.4. Gravitative processes and related forms and features
Rockfalls are the most frequent mass wasting process in the area, their shape ranges from 100 to 1000 m2. The main reason for these processes consists in the lithological discontinuities and the undercutting of the middle Pleistocene ignimbrites and tuffs belonging to the Kella formation (D4-D3). In fact, the escarpments of the Kella formation in the Tuka Meja drainage system are strongly eroded due to agriculture and cattle farming. Rock toppling also occur in the Kella formation and along the flood basalt escarpments (D4-B4) Because of the basalt pillars structure that has distinct and predefined fractures hence producing a sort of toppling.
4.5. Anthropogenic forms and features
Some parts of the study area are subject to the rapid growth of settlements. In particular, the Awash village expanded intensively in the last decades. This rapid development is connected to road constructions such as the new road connecting Butajira with Addis Ababa. The roads concentrate runoff and hence, road gullies developed. Moreover, road cuts led to accelerated erosion processes.
Human activities are mainly concentrated around the settlement areas and are characterized by intensive erosion processes, mainly due to over grazing and soil compaction. However, also the agricultural activity, especially after ploughing, increases the amount of sediments in the runoff after intensive rainfall events.
5. Conclusion
We utilized and integrated approach to identify and map the geomorphological processes of the Melka Kunture study area. Therefore, different methods like remote sensing, API, terrain analysis, as well as field measurements and observations were combined to generate a geomorphological map of the wider Melka Kunture area. We considered endogenic as well as exogenic geomorphological processes and related forms and features. The dominant landscape forming processes are related to the rift valley tectonics and the subsequent volcanic activities with their different depositional products. The latter changed the drainage pattern and hence fluvial erosion and deposition processes. Moreover, the stratigraphic sequence of the different volcanic and fluvial deposits leads to slope instabilities and mass movements like rockfalls and toppling (e.g. ).
Figure 7. (a), (b), (c) Rockfalls Tuka Meja drainage banks, and (d) Translational rock slide.
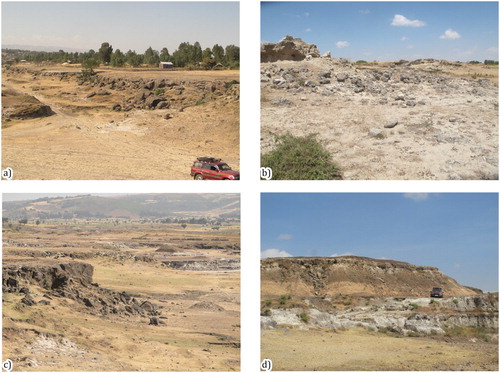
Sheet and gully erosion processes contribute to the landscape evolution and are mainly triggered by anthropogenic activities such as agriculture and cattle farming. The latter lead to overgrazing and hence compaction of soils with increased surface runoff.
We provide the geomorphological map [Main Map] in the classic analogue 2D format and an appropriate scale of 1.15,000 as well as in an interactive WebGIS-based version using WMS layer and a Leaflet application offering additional information. The geomorphological map [Main Map] represents an overview of the different forms and features related to specific geomorphological processes. Hence, the map contributes to the understanding of landscape evolution in the area and provides basic information to assess geo-hazards affecting the Melka Kunture archaeological sites.
Software
The mapping of relevant geomorphic processes and related landforms has been conducted using ArcGIS 10.1. DEM generation was performed with PhotoScan professional package (© 2015 Agisoft). The digital terrain analysis was achieved using SAGA GIS System for Automated Geoscientific Analysis. Land cover analysis was done with ERDAS image 2011 (ERDAS LTD). ArcGIS 10.1. has been used to generate the final map layout. The manuscript was prepared with Microsoft Word (TM Word®), references have been listed in EndNote (© 2014 Thomson Reuters). For the WebGIS -application we used Geonetworks (3.0.5.0) (https://geonetwork-opensource.org/), Geosever (2.9.4) (http://geoserver.org/) and QGIS (2.18.4) (https://qgis.org/) software as well as a Leaflet JavaScript Library (1.2.0) (https://leafletjs.com/).
map.pdf
Download PDF (20.5 MB)Disclosure statement
No potential conflict of interest was reported by the authors.
Data availability statement
The digital data is hosted at the ROCCEH project facility at University of Tübingen and available upon request (www.roceeh.net). Derived data supporting the findings of this study are available from the corresponding author [M. M.] on request.
ORCID
Michael Maerker http://orcid.org/0000-0003-0632-1422
Calogero Schillaci http://orcid.org/0000-0001-7689-5697
Alberto Bosino http://orcid.org/0000-0001-5032-8467
Additional information
Funding
Related Research Data
References
- Altamura, F. , Bennett, M. R. , D'août, K. , Gaudzinski-Windheuser, S. , Melis, R. T. , Reynolds, S. C. , & Mussi, M. (2018). Archaeology and ichnology at Gombore II-2, Melka Kunture, Ethiopia: Everyday life of a mixed-age hominin group 700,000 years ago Scientific Reports, 8 (1), art. no. 2815.
- Arnett, G. , & Williams, P. (1978). Bank-full discharge of rivers. D. Water Resources Research December U.S. Geological Survey, Colorado 80225.
- Berthelet, A. , & Chavaillon, J. (2004). Prehistoric archaeology. The site of Karre I. Studies on the Early Paleolithic site of Melka Kunture, Ethiopia. Instituto Italiano di Preistoria e Protostoria, Firenze, Origines: 211–251.
- Billi, P. , & Dramis, F. (2003). Geomorphological investigation on gully erosion in the rift valley and the northern highlands of Ethiopia. Catena , 50 (2–4), 353–368. doi: 10.1016/S0341-8162(02)00131-5
- Bouaziz, M. , Matschullat, J. , & Gloaguen, R. (2011). Improved remote sensing detection of soil salinity from a semi-arid climate in Northeast Brazil. Comptes Rendus Geosciences , 343 , 795–803. doi: 10.1016/j.crte.2011.09.003
- Chavaillon, J. , & Berthelet, A. (2004). The archaeological sites of Melka Kunture. In J. Chavaillon & M. Piperno (Eds.), Studies on the Early Paleolithic site of Melka Kunture, Ethiopia. Origines, Instituto Italiano di Preistoria e Protostoria (pp. 25–80). Firenze : Istituto Italiano di Preistoria e Protostoria.
- Chavaillon, J. , & Taieb, M. (1986). Stratigraphie du Quaternaire de Melka-Konturé, vallée de l’Awash, Ethiopie. Premiers résultats. Comptes rendus de l'Académie des Sciences , 266 , 1210–1212.
- Conrad, O. (2006). SAGA. Entwurf, Funktionsumfang und Anwendung eines Systems für Automatisierte Geowissenschaftliche Analysen (Ph.D. Thesis). University of Göttingen, Germany.
- Daba, S. , Rieger, W. , & Strauss, P. (2003). Assessment of gully erosion in eastern Ethiopia using photogrammetric techniques. Catena , 50 (2–4), 273–291. doi: 10.1016/S0341-8162(02)00135-2
- Debele, B. (1985). The vertisols of Ethiopia: Their properties, classification and management. Fifth meeting of the Eastern African soil correlation and land evaluation sub-committee, 4-10 December 1983, Wad Medani, Sudan. World soil resources report 56. FAO (Food and Agriculture Organization of the United Nations), Rome, 31–54.
- Egels, Y. (1971). Sites archéologiques de Melka-Konture: Gombore et Garba. Echelle: 1/2000. Institut Géographique National, Paris.
- Finlayson, D. P. , & Montgomery, D. (2003). Modeling large-scale fluvial erosion in geographic information systems. Geomorphology , 53 , 147–164. doi: 10.1016/S0169-555X(02)00351-3
- Gallotti, R. , Raynal, J.-P. , Geraads, D. , & Mussi, M. (2014). Garba XIII (Melka Kunture, Upper Awash. Ethiopia): a new Acheulean site of the late Lower Pleistocene. Quaternary International , 343 , 17–27. doi: 10.1016/j.quaint.2014.04.039
- Geraads, D. , Gallotti, R. , Raynal, J. P. , Bonnefille, R. , & Mussi, M. (in press). Melka Kunture, Ethiopia: Lower Pleistocene faunas of the Ethiopian highlands . In: S.C. Reynolds and R. Bobe African Paleoecology and human evolution . Cambridge University Press.
- Gustavsson, M. (2006). Development of a detailed geomorphological mapping system and GIS geodatabase in Sweden. Acta Universitatis Upsaliensis Uppsala.
- Gustavsson, M. , Kolstrup, E. , & Seijmonsbergen, A. C. (2006). A new symbol-and-GIS based detailed geomorphological mapping system: Renewal of a scientific discipline for understanding landscape development. Geomorphology , 77 , 90–111. doi: 10.1016/j.geomorph.2006.01.026
- Gustavsson, M. , Seijmonsbergen, A. C. , & Kolstrup, E. (2008). Structure and contents of a new geomorphological GIS database linked to a geomorphological map with an example from Liden, central Sweden. Geomorphology , 95 , 335–349. doi: 10.1016/j.geomorph.2007.06.014
- Hengl, T. , & Reuter, I. H. (2009). Geomorphometry. Concepts, software, applications, developments. In: Soil science (Vol. 33, pp. 765). Amsterdam.
- IUSS Working Group WRB . (2014). World reference base for soil resources 2014. International soil classification system for naming soils and creating legends for soil maps. World Soil Resources Reports No. 106. FAO, Rome.
- Kropáček, J. , Schillaci, C. , Salvini, R. , & Maerker, M. (2016). Assessment of gully erosion in the Upper Awash, Central Ethiopian highlands based on a comparison of archived aerial photographs and very high resolution satellite images. Geografia Fisica e Dinamica Quaternaria , 39 , 161–170.
- Kusák, M. , Kropáček, J. , Vilímek, V. , & Schillaci, C. (2016). Analysis of the influence of tectonic on the evolution of valley networks based on SRTM DEM, Jemma River Basin, Ethiopia. Geografia Fisica e Dinamica Quaternaria , 39 (1), 37–50.
- Maerker, M. , Schillaci, C. , & Kropáček, J. (2018). Morphometric terrain analysis to explore present day geohazards and paleolandscape forms and features in the surroundings of the Melka Kunture prehistoric site, Upper Awash valley. Central Ethiopia. Acta Universitatis Carolinae Geografica , 53 (1), 10–19.
- Mendez-Quintas, E. , Panera, J. , Altamura, F. , Di Bianco, L. , Melis, R. T. , Piarulli, F. , … Mussi, M. (2019). Gombore II (Melka Kunture, Ethiopia): A new approach to formation processes and spatial patterns of an Early Pleistocene Acheulean site. Journal of Archaeological Science , 108 , 104975. ISSN 0305-4403, https://doi.org/10.1016/j.jas.2019.104975
- Morgan, L. E. , Renne, P. R. , Kieffer, G. , Piperno, M. , Gallotti, R. , & Raynal, J.-P. (2012). A chronological framework for a long and persistent archaeological record: Melka Kunture, Ethiopia. Journal of Human Evolution , 62 , 104–115. doi: 10.1016/j.jhevol.2011.10.007
- Mussi, M. , Altamura, F. , Bonnefille, R. , De Rita, D. , & Melis, R. T. (2016). The environment of the Ethiopian highlands at the Mid Pleistocene Transition: Fauna, flora and hominins in the 850-700ka sequence of Gombore II (Melka Kunture). Quaternary Science Reviews , 149 , 259–268. doi: 10.1016/j.quascirev.2016.07.033
- Mussi, M. , Altamura, F. , Macchiarelli, R. , Melis, R. T. , & Spinapolice, E. E. (2014). Garba III (Melka Kunture, Ethiopia): A MSA site with archaic Homosapiens remains revisited. Quaternary International , 343 , 28–39. doi: 10.1016/j.quaint.2013.08.028
- Olaya, V. , & Conrad, O. (2008). Geomorphometry in SAGA. In T. Hengl & H. I. Reuter (Eds.), Geomorphometry: Concepts, software, applications (pp. 293–308). Amsterdam : Elsevier.
- Otto, J. , & Dickau, R. (2004). Geomorphologic system analysis of a high mountain valley in the Swiss Alps. Zeitschrift für Geomorphologie , 48 (3), 323–341.
- Piperno, M. (2001). The prehistory of Melka Kunture (Ethiopia). Bulletin du Centre de Recherche Français à Jérusalem , 8 , 135–145.
- Planchon, O. , & Darboux F. (2001). A fast, simple and versatile algorithm to fill the depressions of digital elevation models. Catena , 46 , 159–176. doi: 10.1016/S0341-8162(01)00164-3
- Poppe, L. , Frankl, A. , Poesen, J. , Admasu, T. , Dessie, M. , Adgo, E. , … Nyssen, J. (2013). Geomorphology of the Lake Tana basin, Ethiopia. Journal of Maps , 9 , 431–437. doi: 10.1080/17445647.2013.801000
- Raynal, J.-P. , & Kieffer, G. (2004). Lithology, dynamism and volcanic successions at Melka Kunture (Upper Awash, Ethiopia). In J. Chavaillon & M. Piperno (Eds.), Studies on the Early Paleolithic site of Melka Kunture, Ethiopia. Origines, Istituto Italiano di Preistoria e Protostoria (pp. 111–135). Firenze : Istituto Italiano di Preistoria e protostoria.
- Rosgen, D. (1996). Applied river morphology. Wildland Hydrology. Pagosa Springs, CO. USA, 378 pp.
- Salvini, R. , Riccucci, S. , & Francioni, M. (2012). Topographic and geological mapping in the prehistoric area of Melka Kunture (Ethiopia). Journal of Maps , 8 (2), 169–175. doi: 10.1080/17445647.2012.680779
- Sembroni, A. , Molin, P. , Dramis, F. , & Abebe, B. (2017). Geology of the Tekeze River basin (Northern Ethiopia). Journal of Maps , 13 , 621–631. doi: 10.1080/17445647.2017.1351907
- St.-Onge, D. A. (1981). Theories, paradigms, mapping and geomorphology. Canadian Geographic , 25 (4), 307–315. doi: 10.1111/j.1541-0064.1981.tb01335.x
- Taieb, M. (1974). Evolution quaternaire du bassin de l'Awash, Thèse Doctorat ès-Sciences, Paris, 2 vol. PhD Thesis (texte).
- Tamrat, E. , Thouveny, N. , Taieb, M. , & Brugal, J. P. (2014). Magnetostratigraphic study of the Melka Kunture archaeological site (Ethiopia) and its chronological implications. Quaternary International , 343 , 5–16. doi: 10.1016/j.quaint.2013.11.030
- Tarboton, D. G. (1997). A new method for the determination of flow directions and upslope areas in grid digital elevation models. Water Resources Research , 33 (2), 309–319. doi: 10.1029/96WR03137
- Tamene, L. , & Vlek P. L. G. (2008). Soil erosion studies in northern Ethiopia. In A. K. Braimoh & P. L. G. Vlek (Eds)., Land use and soil resources . Dordrecht : Springer.
- Van Zuidam, R. A. (1985). Aerial photo interpretation in terrain analysis and geomorphological mapping .
- Verstappen, H. T. , & Van Zuidam, R. A. (1968). Textbook of photo-interpretation, system of geomorphological survey. ITC Delft, The Netherlands.
- Vogel, S. , & Maerker, M. (2010). Reconstruction of the pre-eruption AD 79 paleo-topography and paleo-environment of the Sarno River Basin (Italy) using Stratigraphical Core drillings and Data mining technologies. Geomorphology , 115 (1–2), 67–77. doi: 10.1016/j.geomorph.2009.09.031
- White, F. (1983). The vegetation of Africa . Paris : UNESCO.
- Wilson, J. P. , & Gallant J. C. (2000). Digital terrain analysis. In J. P. Wilson & J. C. Gallant (Eds.), Terrain analysis: Principles and applications (pp. 1–27). New York : J. Wiley.
- Yitebitu, M. (2010). Eucalyptus species management, history, status and trends in Ethiopia Eucalyptus trees and the environment: A new perspective in times of climate change. In L. Gil , W. Tadesse , E. Tolosana , & R. López (Eds.). Proceedings from the congress held in Addis Ababa (pp. 104–113). Addis Ababa : UPM. September 15–17, 2010.