
ABSTRACT
The authors have prepared a detailed map of Slovakia’s ecosystems, which identifies individual ecosystems and their spatial distribution, status, and selected properties. The impetus for the production of this map is the need of various stakeholders, especially nature protection bodies, forestry management, agricultural management and public administration, for better data on the distribution of ecosystems. The methodology mostly involves using GIS analytical tools to combine datasets on nature protection, forestry, and agriculture which list attributes related to habitat identification. The results can be used for ecosystem services assessment, spatial planning, nature protection analysis, and other related purposes. The spatial precision of the data is determined by that of the field data, which was mostly created at scales between 1:10000 and 1:5000. The data are stored in the form of a geodatabase containing more than 1,000,000 polygons.
KEYWORDS:
1. Introduction
The Convention of Biological Diversity (CitationCBD, 2010) defines an ecosystem as a dynamic complex of plant, animal and micro-organism communities and their non-living environment interacting as a functional unit. Ecological land classification and regionalization divides and categorizes Earth as unified functional ecosystems into similar pieces-sectoral ecosystems at various scales in the interests of understanding (CitationRowe, 1996). Depending on the nature of the ecosystem, a classification hierarchy can be drawn up on the basis of hierarchies of system levels, organization levels and scales relevant for the classification and mapping of the ecosystem (CitationKlijn, 1994). A hierarchical ecosystem classification method facilitates the identification of areas to be surveyed and grouped together (CitationCarranza, Acosta, Stanisci, Pirone, & Ciaschetti, 2008) according to their assigned ecotopes.
Ecosystem maps are derived through various techniques (modelling, mapping or combination of both). Most classifications enable the creation of hierarchical framework based on plant sociology as diagnostic attributes (CitationBlasi, Carranza, Frondoni, & Rosati, 2000) often integrated with landscape ecology (CitationBlasi, Capotorti, & Frondoni, 2007). Ecosystems can be mapped effectively from high spatial resolution satellite image data (e.g. CitationJohansen, Coops, Gergel, & Stange, 2007; CitationTreitz & Howarth, 2000). Some level of uncertainty must be taken into account in ecosystem mapping by remote sensing (CitationRocchini et al., 2013), however using artificial intelligence neural networks and very high spatial resolution satellite imagery improves the situation greatly. CitationRendon, Erhard, Maes, and Burkhard (2019) suggest that it is important to also focus on the condition of an ecosystem at different spatial scales.
Terrestrial Ecosystem classification and mapping are very important tools not only from a theoretical point of view. They provide critical information to land and resource managers, who can use it as a tool for biodiversity management and conservation (CitationCarranza et al., 2008). Resulting maps may help to meet biodiversity conservation targets at the national level, assess conservation status, define restoration priorities, plan green infrastructure and identify collapse risks for the ecosystems (CitationBlasi et al., 2017). The EUNIS habitat classification (European Union Nature Information System) developed by the European Environment Agency, has been used in nature conservation as a tool for describing habitat units during monitoring and assessments. The system is hierarchical and covers all types of habitats from natural to artificial, from terrestrial to freshwater and marine. This classification is very useful for the national nature conservation authorities to place and assess their habitats in a European context (CitationMoss, 2008). The European Biodiversity Strategy (CitationEuropean Commission, 2011) and Strategic Plan for Biodiversity By 2020 urge the EU member states to map and assess ecosystems and their services, with the aim of halting the loss of biodiversity and ecosystem services (ES) in the EU by 2020 and of beginning to restore them (CitationCBD, 2011, Citation2010). The aim of this paper is to assemble data on ecosystems in Slovakia at the highest possible level of precision, so as to construct a detailed map of the ecosystems of the Slovak Republic. The creation of such a comprehensive ecosystem map, with an associated geodatabase, provides an important tool for comprehensive ES assessment, a process in which Slovakia lags far behind most European countries. The EUNIS classification from 2017 (CitationEEA, 2018) was chosen in our study, as it is already familiar to ecologists throughout the EU, and ensures comparability of the data with other countries using the same classifications. The main reason for this research comes from conservation practice. In Slovakia, such data sets are missing. Only partial data were available, while general data sets are not sufficient for detailed nature conservation practice. Therefore, new data sets are developed using new approach in order to connect the research with practical needs of nature conservation. Other reason is the fact that the existing data sets come from various sectors and thus are focused on one topic/sector (forestry database, agricultural database). Interconnection of these data sets and preparation of a unified interpretation was crucial in order to present general overview of ecosystems in Slovakia.
2. Materials and methods
2.1. Study area
The study area comprises the whole territory of Slovak Republic, which is an inland state in Central Europe. It has an area of 49,034 km² and has 5,445,089 inhabitants (31 December 2018). Slovakia has a relatively dense network of settlements; there are 2890 separate municipalities, of which 140 are cities, but only 2 of them have more than 100,000 inhabitants and 10 have more than 50,000 inhabitants. In total, 53.5% of inhabitants are living in the cities (CitationSTATdat, 2019).
2.2. Data collection and preparation of the map of ecosystems
The urgent need for a comprehensive generalized nationwide map of ecosystems in Slovakia is emphasized in an introductory part of the article. Such map has been created by using agricultural, forestry and environmental data, based on below explained procedure. The resulting polygons containing data from various sources were finally classified as ecosystem/habitat types in accordance with the EUNIS classification system.
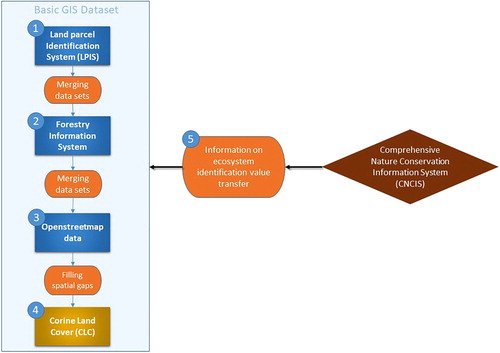
The technical steps in the process of preparing the ecosystem map were performed in the following sequence ().
-
The non-forest areas were delineated on the basis of data from the land parcel identification system LPIS (CitationNPPC-VÚPOP, 2018; LPIS, Citation2018).
-
Data on spatial distribution of forest ecosystems were subsequently obtained from the National Forest Centre and added to the collected data (CitationNFC, 2017).
-
Watercourses, road and railway infrastructure, buildings and urban vegetation elements were incorporated into the map to clarify details and capture small-scale but essential ecological and artificial features. This was done on the basis of Openstreetmap data (CitationGeofabrik, 2015).
-
Corine Land Cover (CitationCLC, 2012) data was used as the basis for filling in areas where more accurate spatial data was lacking.
-
Selected attributes were then taken from Comprehensive Nature Conservation Information System – CNCIS (CitationSNC SR, 2018) databases as a basis for ecosystem identification. National habitat categories were converted to the EUNIS habitats categories (see crosswalk table in Annex 1).
Figure 1. Flowchart demonstrating steps in preparation of the map of ecosystems.
All layers and features were joined together to create a coherent polygonal map of Slovakia. Problems with overlap were solved by prioritization of the more precise data sets. Undesirable features – very small (less than 10 m2) and very thin polygons (width less than 10 m) – mainly by incorporating them into a larger adjacent polygons.
Accuracy of the final data set is determined by the accuracy and spatial extent of the input data sets. LPIS data were used on 45.5%, forestry information system were used on 34.9%, CLC on 19.4% and Open street map data on 0.2% of the total national territory coverage. Therefore more than 80% of the total national territory in the final data set is prepared at scale 1:5000–1:10,000. For LPIS, minimum accuracy requirement is defined in Article 70 of Regulation (EU) 1306/2013 at a scale of 1:5000. Horizontal absolute positional accuracy is expressed as RMSE (Root Mean Square Error) of 1.25 m (5000 × 0.25 mm = 1.25 m), or the equivalent CE95 (circular standard error at the 95% confidence level) value, display range and feature type content compatible with a map with a scale 1:5000, using orthophotographs < = 0.5 m GSD (ground sampling distance). For the CLC data set, the total reliability is 85% (CitationCLC, 2012). For the Forestry information system accuracy of mapping is given in accordance with the nationally defined standard < = 0.5 m GSD and mapping scale is 1:10,000.
In order to test the accuracy of the final data, a compact control area was randomly selected and a field mapping of all ecosystems was realized in 2017–2018 (total area of 1169 hectares, see ). Mapping methodology was maintained according to the standard national mapping of habitats (CitationStanová & Valachovič, 2002). Analysis of overlap of each of the ecosystems identified by field mapping with the final data set ( and ) shows that there is 87.7% probability of real occurrence of the habitat within the final polygons (analysis was realized on EUNIS level 3 precision) and 93.45% match of the final borders of polygon features (using 20 m buffer).
Figure 2. Match of the boundaries and identified ecosystems with field data survey.
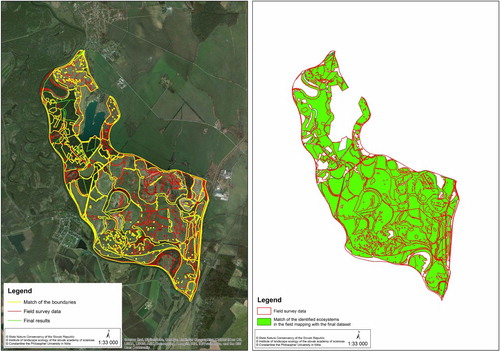
Table 1. Overlap of field data survey (Reference area) with the final data set.
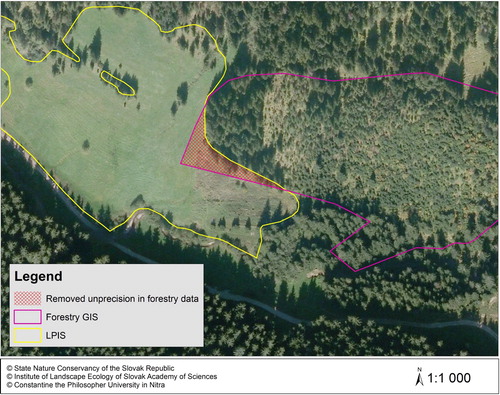
To reduce the errors in the data set, in some cases, the classification of ecosystems was modified based on additional attributes in used data sets to reflect as much as possible the real ecosystem occurring at the locality level (i.e. based on tree species composition). If some habitats could not be reliably identified based on the available data, they were categorized into lower, less accurate levels of the EUNIS ecosystem hierarchy. Data processing used the most precise data set from the agricultural data set (LPIS) and the spatial parts of forestry data set were removed in places, where there was improper border of forest. By this step, it was assured that the border of forest ecosystems is never within the agricultural land (). In case there had been different habitat categories resulting from different data sources, the result of more precise method of habitat identification had been used for final data set of the same polygon. The most precise methods of habitat identification were field mapping data and data obtained from field monitoring (EUNIS level 4, 5, 6), these had the highest priority. On the other hand, CLC had the lowest priority for identification of habitat category (EUNIS level 2) and it was used only if there was no other more precise habitat identification available for particular polygon.
Figure 3. Example of error reduction in data set by removal of non-forest part previously defined as forest habitat.
3. Results
The main map of Slovakiás ecosystems represents a unique and comprehensive spatial geodatabase with identified ecosystems for the whole national territory. The prepared map of ecosystems in Slovakia contains 1,033,905 unique polygons, with an average size of 4.9 ha. Examples of maps for individual regions of Slovakia are shown in and . The smallest polygon has a size of 0.00001 ha and the largest, 2839 ha – a large, continuous area of water (behind a dam) with only type of water ecosystem. Polygon size is highly dependent on ecosystem type and uses the highest level of detail available to delineate the borders of the individual ecosystems and landscape features. By combining many data sources, it was possible to examine the degree to which Slovak ecosystems could be assigned to different levels of the EUNIS Habitats categories (). Most of the map (over 600,000 polygons) could be determined to category level 4 or higher; 45 different habitat types were identified at level 4 ().
Figure 4. A selection of the prepared ecosystem map for the Bratislava region (the EUNIS level 3 habitat names, frequencies, and covered areas are given in annex 2).
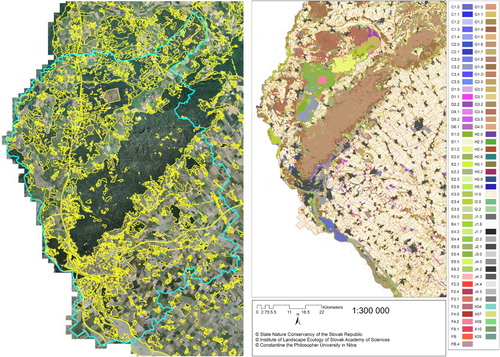
Figure 5. The ecosystem map for another region of Slovakia (Žilina region).
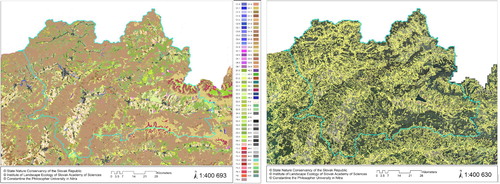
Table 2. Number of habitat types at the different EUNIS levels in the ecosystem map.
Even though different levels of classification and precision are present in the final map, the discussion of the results that follows will only compare results at the same level of EUNIS Habitats category. The maps in and display EUNIS Habitats level 3 (Annex 2), supplemented by EUNIS Habitats level 2 in places where no more precise identification of habitat type was available to fill in gaps in the map. Data are online available: maps.sopsr.sk and WMS service is available at http://maps.sopsr.sk/wms-ekosystemy?request=getCapabilities
3.1. EUNIS Habitats level 1 – overview and highlights
The largest level 1 habitat in Slovakia is woodland, forest and other wooded lands, whose total area is 185,307,626 ha (all G ecosystems in the EUNIS Habitats classification), representing 37.82% of the area of Slovakia. A significant part of Slovakia is covered by non-forest ecosystems, which occupy 1,222,864.80 ha (all E, C, D, E, F, H ecosystems in the EUNIS Habitats classification). Regularly or recently cultivated agricultural, horticultural and domestic ecosystems in Slovakia cover 1,402,798.33 ha (I in the EUNIS Habitats classification). Ecosystem complexes (X in the EUNIS Habitats classification) have a surface area of 112,427.74 ha. At present, the area covered by constructed, industrial and other artificial ecosystems in Slovakia is 303,102 ha (category J in the EUNIS Habitats classification). Mires, bogs and fens are rare in Slovakia, covering only 0.43% of the country. An overview of all EUNIS habitat level 1 categories, including their frequency, area, and percentage of national territory, is provided in .
Table 3. Overview of EUNIS habitat level 1 categories, and their frequency, area and coverage (in %) of the national territory.
3.2. EUNIS level 4 – overview and highlights
At this level of classification, the most prevalent type of forest ecosystem in Slovakia is medio-European neutrophile beech (Fagus) forests (G1.63), and the most prevalent of non-forest habitat types is sub-Atlantic lowland hay meadows (E2.22). The rarest ecosystem types in Slovakia are fen Cladium mariscus beds (D5.24) (6 polygons), charophyte submerged carpets in oligotrophic water bodies (C1.14) (12 polygons), and damaged, inactive bogs (D1.12) (14 polygons). Other rare ecosystem types were also found related to sand, peat bogs, mountainous environments, and xerothermic habitats.
4. Discussion
The prepared map of ecosystems shows in detail the ecosystem distribution in Slovakia, and provides a much more accurate basis for ecosystem assessment than the map of the CLC or other available sources. This is the first time in history in which an ecosystem map for Slovakia with habitat categories has been prepared with such precision and complexity, gathering data on all natural habitat types and their distribution across the entire country, and incorporating data from previous phyto-sociological mapping. Similar ecosystem maps have been produced in Sicily (CitationGianguzzi, Papini, & Cusimano, 2016), in the Czech Republic (CitationGuth & Kučera, 2005; CitationVačkář, Grammatikopoulou, Daněk, & Lorencová, 2018), and a map for Hungary is in progress (CitationBölöni, Botta-Dukát, Illyés, & Molnár, 2011). They also include additional information, beyond those concerning habitats of Community Interest (e.g. estimation of conservation status, representativeness in the Czech Republic, cross-checks of various other information layers published for Sicily on vegetation, land use, geology, soil science and bioclimatology). The contextual biotopes mapping in the Czech Republic and Sicily was focused at occurrence and dimensions of all natural and semi-natural biotopes at a scale 1:10,000 and particularly some sites influenced by human activities such as agriculture, mining, forestry, urbanization were not mapped. Similarly, in Hungary, mapping was focused only on semi-natural habitats only. Mapping accuracy was adapted to hexagon mapping units with an area of 35 ha. Drafting the main map required photo-interpretation of vegetation through digital colour orthophotographs and colour satellite images (Landsat TM, Google Earth 25 cm pixels), with digital data on Technical Map of Sicily at 1:10,000 scale. The main weakness of data which we have used and at the same time the main challenge for us was the difference in mapping approaches, scale and borders. Combination of detailed non-forest habitats data, complex data on spatial distribution of forest ecosystems and exact borderline unified with LPIS based on orthophotographs have helped us to make this map highly accurate.
An important feature of the map and geodatabase presented is that its preparation is repeatable: a similar map can be prepared in exactly the same way in the future, in order to map changes in ecosystems over time. To use these data in practice, it is necessary to distinguish the source and quality of the background data – especially whether they were obtained from detailed field mapping or derived on the basis of partial data, which needs to be verified by monitoring and field mapping in the future. The use of additional spatial dataset would be beneficial in order to improve the result of the map of ecosystems, such as data set ZB GIS (CitationZB GIS, 2018). Information on small natural elements, linear features and other detailed spatial data could add to the detail of the map of ecosystems. This, however, was not available at the time of map preparation.
The vegetation maps of Europe produced in recent times were intended as an aid to implementing policies on land use planning and, in particular, nature conservation (CitationEEA, 2014). Landscape classification based on (semi-)natural vegetation may be used for estimating landscape diversity, landscape modelling, selection of study sites, regionalization of local scientific results, and landscape development planning and nature conservation management (CitationBölöni et al., 2011). The presented map of ecosystems in Slovakia must still be verified at the local scale, but may already be used for designating ecological networks on the regional or the national scale (CitationIzakovičová & Swiader, 2017). Although the geodatabase was created for national ES assessment, it could also be useful for many other needs and purposes. Integration of ES considerations into landscape planning, with an emphasis on participative processes, has the potential to make spatial planning significantly more efficient in Slovakia (CitationBezák, Mederly, Izakovičová, Špulerová, & Schleyer, 2017).
The obtained knowledge can help move towards optimal resource use and habitat management, and thus contribute to improving the overall ecosystem status and quality of life in the target area (CitationŠedivá & Izakovičová, 2015). In the Czech Republic, habitat mapping results have also been used also for monetary valuation of natural forest habitats (CitationPechanec et al., 2017), and the authors stated that this method could be a promising decision support tool in countries where habitat mapping results are available.
5. Conclusions
This article presented outlines the methodology and discusses the results of our research, in which a comprehensive map of the ecosystems in Slovakia was prepared, for the first time in history, in digital form and with assignment of habitat categories to precise areas. The preparation of such a complex map was challenging process, with numerous problems occurring – particularly regarding combining the datasets, correctly merging the data, and extracting or calculating the most relevant attributes for ecosystem identification. Robust nationwide data sets from different sectors were included, and heavy use was made of ArcGIS tools in preparing the resulting map. Overall, this GIS-based map provides comprehensive information on the ecosystems of Slovakia, and could potentially be useful in numerous ways in different sectors and areas.
Software
Data processing and map design were performed by ARC GIS, version 10.3.
Supplemental Material
Download Zip (40.4 KB)Ecosystems of Slovakia
Download PDF (99.9 MB)Acknowledgements
We would also like to thank James Asher for English proofreading.
Disclosure statement
No potential conflict of interest was reported by the authors.
Additional information
Funding
Related Research Data
References
- Bezák, P. , Mederly, P. , Izakovičová, Z. , Špulerová, J. , & Schleyer, C. (2017). Divergence and conflicts in landscape planning across spatial scales in Slovakia: An opportunity for an ecosystem services-based approach? International Journal of Biodiversity Science, Ecosystem Services & Management , 13 , 119–135. doi: 10.1080/21513732.2017.1305992
- Blasi, C. , Capotorti, G. , & Frondoni, R. (2007). Defining and mapping typological models at the landscape scale. Plant Biosystems , 155–163. doi: 10.1080/11263500500163629
- Blasi, C. , Capotorti, G. , Ortí, M. M. A. , Anzellotti, I. , Attorre, F. , Azzella, M. M. , … Zavatterro, L. (2017). Ecosystem mapping for the implementation of the European biodiversity strategy at the national level: The case of Italy. Environmental Science and Policy , 78 , 173–184. doi: 10.1016/j.envsci.2017.09.002
- Blasi, C. , Carranza, M. L. , Frondoni, R. , & Rosati, L. (2000). Ecosystem classification and mapping: A proposal for Italian Landscapes. Applied Vegetation Science , 3 , 233–242. doi: 10.2307/1479002
- Bölöni, J. , Botta-Dukát, Z. , Illyés, E. , & Molnár, Z. (2011). Hungarian landscape types: Classification of landscapes based on the relative cover of (semi-) natural habitats. Applied Vegetation Science , 14 , 537–546. doi: 10.1111/j.1654-109X.2011.01139.x
- Carranza, M. L. , Acosta, A. T. R. , Stanisci, A. , Pirone, G. , & Ciaschetti, G. (2008). Ecosystem classification for EU habitat distribution assessment in sandy coastal environments: An application in central Italy. Environmental Monitoring and Assessment , 99–107. doi: 10.1007/s10661-007-9851-7
- CBD . (2010). Convention on biological diversity. COP 10 Decision X/2: Strategic Plan for Biodiversity 2011–2020. Retrieved from https://www.cbd.int/decision/cop/?id=12268
- CBD . (2011). Strategic plan for biodiversity 2011–2020, including Aichi biodiversity targets. Retrieved from https://www.cbd.int/sp/
- Corine land cover (CLC) . (2012). Maps & data. Retrieved from https://land.copernicus.eu/pan-european/corine-land-cover/clc-2012/viewnnnn
- European Commission . (2011). Communication from the commission to the European Parliament, the Council, The Economic and Social Committee and the committee of the regions our life insurance, our natural capital: an EU biodiversity strategy to 2020. COM/2011/0244 final, Brussels, European Commission.
- EEA . (2014). Terrestrial habitat mapping in Europe: an overview, EEA Technical report No1/2014. European Environment Agency, 152 p. ISBN 978-92-9213-420-4. ISSN 1725-2237. https://doi.org/10.2800/11055. Available online: https://www.eea.europa.eu/publications/terrestrial-habitat-mapping-in-europe
- EEA . (2018). EUNIS habitat classification review 2017. European Environment Agency. Retrieved from https://www.eea.europa.eu/data-and-maps/data/eunis-habitat-classification
- Geofabrik . (2015). Maps & data – Openstreetmap. Retrieved from http://www.geofabrik.de/data/shapefiles.html
- Gianguzzi, L. , Papini, F. , & Cusimano, D. (2016). Phytosociological survey vegetation map of Sicily (Mediterranean region). Journal of Maps , 12 , 845–851. doi: 10.1080/17445647.2015.1094969
- Guth, J. , & Kučera, T. (2005). Natura 2000 habitat mapping in the Czech Republic: Methods and general results. Ecology (Bratislava) , 24 , 39–51.
- Izakovičová, Z. , & Swiader, M. (2017). Building ecological networks in Slovakia and Poland. Ecology (Bratislava) , 36 , 303–322. doi: 10.1515/eko-2017-0025
- Johansen, K. , Coops, C. N. , Gergel, E. S. , & Stange, Y. (2007). Application of high spatial resolution satellite imagery for riparian and forest ecosystem classification. Remote Sensing of Environment , 110 (1), 29–44. doi: 10.1016/j.rse.2007.02.014
- Klijn, F. (1994). Ecosystem classification for environmental management, ecology & environment. Springer. Dordrecht: Kluwer Academic Publishers. 310 pp. ISBN 978-0-7923-2917-6. doi:10.1007/978-94-017-1384-9
- LPIS . (2018). Geografický informačný systém poľnohospodárskej pôdy. Retrieved from https://portal.vupop.sk/portal/apps/webappviewer/index.html?id=32beed691b01498d9ebe11bf8f9b7b04
- Moss, D. (2008). EUNIS habitat classification. European topic centre on biological diversity. 27 pp. Retrieved from http://citeseerx.ist.psu.edu/viewdoc/download?doi=10.1.1.231.4607&rep=rep1&type=pdf
- NFC (National Forest Centre) . (2017). Geographic information system of the forest. Retrieved from http://gis.nlcsk.org/lgis/
- NPPC-VÚPOP . (2018). Register pôdy LPIS (Land Register – Land Parcel Information System). Retrieved from http://www.podnemapy.sk/lpis_verejnost/viewer.htm
- Pechanec, V. , Machar, I. , Sterbova, L. , Prokopova, M. , Kilianova, H. , Chobot, K. , & Cudlin, P. (2017). Monetary valuation of natural forest habitats in protected areas. Forests , 8 , 427, 21 pp. doi: 10.3390/f8110427
- Rendon, P. , Erhard, M. , Maes, J. , & Burkhard, B. (2019). Analysis of trends in mapping and assessment of ecosystem condition in Europe. Ecosystems and People , 1 , 156–172. doi: 10.1080/26395916.2019.1609581
- Rocchini, D. , Foody, G. M. , Nagendra, H. , Ricotta, C. , Anand, M. , He, K. S. , … Neteler, M. (2013). Uncertainty in ecosystem mapping by remote sensing. Computers & Geosciences , 50 , 128–135. doi: 10.1016/j.cageo.2012.05.022
- Rowe, S. J. (1996). Land classification and ecosystem classification. Environmental Monitoring and Assessment , 39 (1–3), 11–20. doi: 10.1007/BF00396131
- Šedivá, A. , & Izakovičová, Z. (2015). Assessment of representative landscape types of Skalica district. Ecology, (Bratislava) , 34 , 329–338. doi: 10.1515/eko-2015-0030
- SNC SR . (2018). Komplexný informačný systém ochrany prírody – KIMS. (Comprehensive Nature Conservation Information System – CNCIS). Retrieved from www.biomonitoring.sk
- Stanová, V. , & Valachovič, M. 2002). Katalóg Biotopov Slovenska. DAPHNE – Inštitút aplikovanej ekológie. Bratislava, 225 pp.
- STATdat . (2019). Retrieved from http://statdat.statistics.sk/cognosext/cgi-bin/cognos.cgi?b_action=xts.run&m=portal/cc.xts&gohome=
- Treitz, P. , & Howarth, P. (2000). High spatial resolution remote sensing data for forest ecosystem classification: An examination of Spatial Scale. Remote Sensing of Environment , 72 (3), 268–289. doi: 10.1016/S0034-4257(99)00098-X
- Vačkář, D. , Grammatikopoulou, I. , Daněk, J. , & Lorencová, E. (2018). Methodological aspects of ecosystem service valuation at the national level. One Ecosystem , 3 , e25508. doi: 10.3897/oneeco.3.e25508
- ZB GIS . (2018). GKÚ. Retrieved from https://zbgis.skgeodesy.sk/mkzbgis/?bm=zbgis&z=8&c=19.53000,48.80000#!