
 ?Mathematical formulae have been encoded as MathML and are displayed in this HTML version using MathJax in order to improve their display. Uncheck the box to turn MathJax off. This feature requires Javascript. Click on a formula to zoom.
ABSTRACT
In the last years, metropolitan areas are more and more exposed to natural risks often intensified by the effects of climatic changes. Clear and complete information about hazards impending on the territory is indispensable for local authorities to define efficient territorial management strategies focused on the risk reduction. A flexible hazard tool which works at different scale and with several sources of hazard is here proposed. We drew maps of monothematic and synthetic indices to describe the hazard status of metropolitan areas. A hazard hotspot map was also elaborated to identify both the areas with high hazard for the single dangerous event and the areas characterized by the concomitance of several hazards. We computed hazard indices for Napoli and Pozzuoli, a densely populated area, located in the Somma-Vesuvio and Campi Flegrei multi-source volcanic zone and also exposed to landslide, flood and coastal erosion hazard.
1. Introduction
Today 55% of the world’s population lives in urban settlements areas and by 2030, urban areas are projected to globally house 60% of people. The impact of natural disasters for such areas characterized by dense population and representing the hubs of government, commerce and transportation can be catastrophic. The vast majority of cities is close to rivers and is hence prone to river flooding, which potentially affects 379 million people, followed by earthquakes (283 million), wind storms (157 million), storm surges (33 million) and tsunami (12 million) (CitationSundermann, Schelske, & Hausmann, 2014). Volcanic eruptions globally result less catastrophic; approximately 274,000 volcanic fatalities were documented in the historical records and 5.6 million people were affected in the twentieth century (CitationDoocy, Daniels, Dooling, & Gorokhovich, 2013) resulting in about 98,000 fatalities. A risk reduction can be achieved acting on the latter two parameters of Risk formula proposed by CitationUNESCO (1972):(1)
(1) Where H = hazard, is the probability of occurrence of an event in a fixed time window; E = exposure is the number of people, properties and other elements that can be subject to damages and losses; V = vulnerability is the proportion of these elements that might be lost (CitationVarnes, 1984).
In the last decades, the increasing natural and anthropogenic pressure in the urban context required a new approach to solve the problems of human and environmental protection. Scientists, planners and decision-makers gradually realized that the adaptive and flexible approaches of resilient strategies (CitationLu & Stead, 2013; CitationTasan-Kok, Stead, & Lu, 2013) for risk reduction work better than vulnerability and exposure control. Resilience represents the capacity of urban systems to prepare, withstand, respond and readily adapt to shocks and stresses to emerge stronger and live better in good times (CitationARUP, 2015). Moreover, the rise in citizens and local authorities of a consciousness of impending risks helps to render the system more resilient. For example, the Hurricane Irma, that hit the Southern Carolina in 2017, had a reduced impact on the coast thanks to the declaration of an emergency state that made residents and businesses ready for a potential emergency. About 6.3 million people and more than 400 shelters were put in safe (CitationIavarone, Alberico, Gravagnuolo, & Esposito De Vita, 2019).
In this context, multi-hazard studies are fundamental (CitationBathrellos, Skilodimou, Chousianitis, Youssef, & Pradhan, 2017; CitationKappes, Keiler, von Elverfeldt, & Glade, 2012; CitationKaur, Gupta, Parkash, & Thapa, 2018; CitationYordanova & Curt, 2018), since they evidence all threats impending on a metropolitan area and consequently the correct strategies to reduce the risks. Multi-hazard can be seen as the process of assessing the role and effects of various independent hazards endangering the same area or as a process dealing with the possible interactions among different hazardous events (CitationGarcia-Aristizabal et al., 2014).
In the present work, we used a semi-quantitative approach, based on the use of an indicator/index, to draw hazard maps (CitationAlberico & Petrosino, 2015) viable for the phases of hazard-risk mitigation and preparedness management. A time-window in order to determine the hazard level was not fixed and the relations between different hazards, known as cascade (CitationMarzocchi et al., 2009) or domino (CitationDelmonaco, Margottini, & Spizzichino, 2006) effect, were overlooked. These simplifications were forced by the inhomogeneity of data but they did not affect the results of the work, whose main purpose was to support the phases of mitigation and preparedness in the long term. The novelty is the gridding of the whole study area into square cells of 1 km side, that improves the workflow implemented in CitationAlberico and Petrosino (2015) for the indicator/index assessment, in that it avoids forcing induced by the comparison of single hazards with respect to the municipality extent.
We first developed monothematic hazard indices for the single hazard by taking into account the extent of affected areas and the hazard intensity, then we summed up the monothematic indices to get an overview of hazard degrees impending on the single territorial zone (square cell). Moreover, according to CitationDilley et al. (2005), CitationSatta, Snoussi, Puddu, Flayou, and Hout (2016), CitationJiménez, Sanuy, Ballesteros, and Valdemoro (2017) and CitationFerreira et al. (2017) we used the concept of hotspot to identify the zones typified by both the highest value of the single hazard and the coexistence of several hazards.
The method was applied to the case study of Napoli and Pozzuoli municipalities where about 3.183.465 people are possibly exposed to the activity of Somma-Vesuvio and Campi Flegrei as well as to coastal erosion, flooding, landslide and earthquakes. Furthermore, we first proposed a preliminary seismic microzoning of Pozzuoli municipality.
2. Methods
We used two different strategies to map single and total hazards in an exposed territory providing an efficient tool for hazard-risk management. To achieve these goals, according to CitationAlberico and Petrosino (2015), a semi-quantitative methodology based on the use of hazard index/indicators was adopted. The novelty is the gridding of territory into square cells with 1 km side that improves the workflow implemented for the hazard indicator/index assessment since it overwhelms the step of rating the extent of hazard zone and censual district, characterized by different extension, previously needed to make the hazard index comparable on the whole of the investigated area. Moreover, we identified the hazard hotspots as the zones where the maximum intensity of a single hazard and/or the recurrence of all the hazardous events occur.
2.1. Hazard indices
The index is a single indicator or an aggregation of indicators (CitationOECD, 1993). The indicator is a measure, generally quantitative, useful to simply illustrate and communicate complex phenomena, including trends and progress over time (CitationEEA, 2005). We adopted the indices for their ability to point out the status of a territorial system with regard to a specific theme, and to pass from a qualitative to a semi-quantitative approach for hazard assessment (CitationKappes et al., 2012). The heterogeneity of data available on both the single hazard (e.g. landslides, flood) and on the relationship between hazards from different sources (e.g. volcanic eruptions that trigger tsunami) forced us to overlook the probabilities of occurrence of single events and the cascade effects. However, the use of hazard and multi-hazard indices for the management of hazard-risk acts on time intervals longer than those of the response to the crisis and this is a guarantee of the applicability of our methodology, devoted to support mitigation and preparedness in the long term.
In the present work, the single index was assessed as follows:(2)
(2) where:
is a monothematic hazard index calculated in each cell;
is the extent of hazard area in the single cell, calculated through the intersection of the single hazard type and the grid of area exposed to risk;
is a value expressing the degree of hazard identified by the classes of a single hazard map (i.e. low hazard = 0.33, medium hazard = 0.66 and high hazard = 1).
Notwithstanding the influence of cell size on the resulting output (CitationHu & Wang, 2016 and references therein), the choice of a 1 km side cell was driven by the need to balance the preservation of the hazard zoning input data, that were recovered from previously published maps (), and the possibility to draw a Total hazard index map that could be easily read by stakeholders.
Table 1. Summary of the methodologies designed to assess single hazards used for calculation of hazard indices and hotspot map.
The indices were also used to zone the territory in multi-hazard classes by taking into account all the natural hazards acting in the metropolitan area. To ensure comparability (CitationLirer, Petrosino, & Alberico, 2010), all indices
were ranked into three classes (low, medium, high hazard), according to equal interval method, and then summed to provide the multi-hazard index
for the single cell as follows:
(3)
(3) The Main Map depicts the outcomes of this workflow implemented into a Geographic Information System framework that for each cell records not only the
index but also the degree of the single hazard. This allows us to discriminate between two cells with the same multi-hazard index to which diverse hazards contribute and/or with the same type of hazard but different dangerousness for society.
2.2. Hazard hotspot
In a territory exposed to potential damage, a hotspot is an area with the highest hazard level (CitationArnold et al., 2006; CitationDilley et al., 2005) or, in case of multi-hazard, with the highest spatial frequency of hazardous events (CitationAlberico & Petrosino, 2015). To better focus the attention on the most critical points of metropolitan area, we here propose to identify the hotspots in the light of both these meanings. The areas where each single hazard shows the highest values, selected from the respective hazard map (volcanic, seismic, landslide, coastal erosion …), are hence considered hotspots along with those areas exposed to at least two hazards, notwithstanding their degree, identified through the overlap of the Boolean maps obtained for the single hazard.
3. Case study
The municipalities of Napoli and Pozzuoli (hereafter, PNMs) were chosen as the test area to validate the proposed methodology. It hosts about 3.183.465 people (ISTAT, Citation2017) and is exposed to volcanic (CitationLirer, Petrosino, Alberico, & Postiglione, 2001; CitationOrsi, De Vita, & Di Vito, 1996), seismic (CitationEsposito, Porfido, Luongo, & Petrazzuoli, 1992; CitationNunziata, 2004; CitationNunziata, Sacco, & Panza, 2011), flood (CitationEsposito, Matano, & Scepi, 2018; CitationVennari, Parise, Santangelo, & Santo, 2016), landslide (CitationDi Martire, De Rosa, Pesce, Santangelo, & Calcaterra, 2012) and coastal erosion (CitationDe Pippo et al., 2008) hazards. This area, about 162,5 km2 wide, mostly pertains to the Campi Flegrei caldera that collapsed as a consequence of two main explosive events, the Campanian Ignimbrite (CI – ca. 39 ka, CitationDe Vivo et al., 2001) and the Neapolitan Yellow Tuff (NYT – ca. 15 ka, CitationDeino, Orsi, De Vita, & Piochi, 2004) eruptions. Its inner part is morphologically shaped by post-NYT monogenetic volcanoes (e.g. Gauro, Astroni, Monte Nuovo) and by Camaldoli and Posillipo Hill, which separates the Fuorigrotta and Sebeto coastal plains. The easternmost high is the northern flank of Somma-Vesuvio ().
Figure 1. Geo-lithological and structural sketch map of the study area.
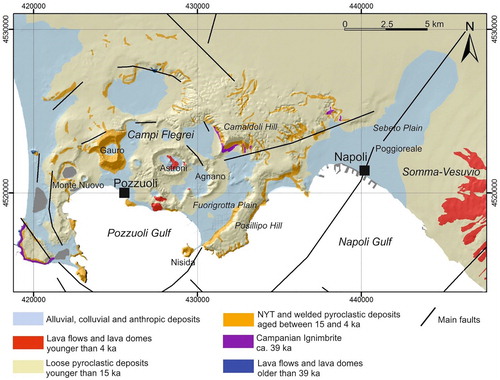
The deposits outcropping in the area were mainly emplaced by post-CI Campi Flegrei volcanic activity, and are made up of loose to lithified (tuffs) pyroclastic products and minor lava flows. The plains are filled by alluvial and remobilized volcanic deposits, together with sediments reworked by intense anthropic activity.
In the following, a brief summary of the single natural hazards is reported, and the specific methodology is resumed in . Only for seismic hazard assessment, firstly carried out for the purposes of the present paper, the methodology is extensively explained in the text.
3.1. Volcanic hazard
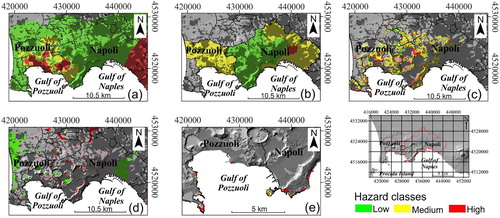
The PNMs are exposed to the volcanic hazard from both Campi Flegrei and Somma-Vesuvio. This hazard was recently studied by CitationBevilacqua et al. (2015), CitationNeri et al. (2015), and CitationBevilacqua et al. (2017) that published several sketch maps focused on a single volcanic source at a time. Therefore, the volcanic hazard map published by CitationLirer et al. (2010), that discretizes the territory in hazard classes integrating all the hazards caused by the possible resuming of explosive activity at both volcanoes, represents the data source for the present study (). The map showed four hazard classes (very low, low, medium and high) but, in order to make it comparable with other maps, we reduced the number of classes to three by merging very low and low classes ().
Figure 2. Maps displaying natural hazards characterizing the Napoli and Pozzuoli municipalities: (a) volcanic hazard; (b) seismic hazard; (c) landslide hazard; (d) flood hazard; (e) coastal erosion hazard. On the bottom right of the figure, the shaded relief of Campania Region shows the two municipalities in a wide territorial setting.
3.2. Seismic hazard
The previous knowledge of seismic hazard is not homogeneous for PNMs since only for Napoli city a seismic microzoning based on the 1980 earthquake is available (CitationNunziata, 2004). Therefore, we drew a preliminary global hazard map that suffers from the paucity of information for the Pozzuoli municipality.
For Napoli, we attributed the maximum peak ground acceleration (PGA) to geologically homogenous zones of CitationNunziata (2004). The PGA values were reclassified into three hazard classes.
For Pozzuoli municipality, the lack of measurements of shear wave velocities (VS) suggested to estimate them by using literature relations with geotechnical data and by attributing the values of similar lithotypes outcropping in the close urban area of Napoli. In particular, we used: (1) empirical correlations between qc values from Cone Penetration Tests (CPT) and VS; (2) empirical correlations between NSPT values from Standard Penetration Tests (SPT) and VS; (3) correlation with Neapolitan lithologies.
The approach 1 yielded to the less reliable results because of: (i) too shallow depth of the CPT tests; (ii) non-specificity of the empirical correlations for volcanic soils; (iii) scarce reliability of CPT tests when carried out in soils coarser than sands (pozzolana grain size can be very heterogeneous). As regards the approach 2, empirical correlations between NSPT values from SPT and VS are not available for volcanic soils. Despite the inadequacy of the approaches 1 and 2, we used them for the computation of VS and compared the results with the dataset of Neapolitan lithotypes (CitationNunziata, Natale, & Panza, 2004) (). This comparison was suggested by the observation that all values computed through empirical correlations fall in the range of the Neapolitan velocity database. In particular, for pozzolana, cinerites, fine and coarse ash, scoria, pumice and lapilli we used the VS data reported for recent pyroclastic products. The lack of any description or physical parameters like RQD (Rock Quality Designation – CitationDeere & Deere, 1988) prevented us to establish the degree of fracturing of the tuff, hence we used the correlation with NYT soil facies.
Figure 3. Comparative diagrams between Vs values obtained using empirical correlations NSPT-VS and using correlations with Neapolitan lithotypes.
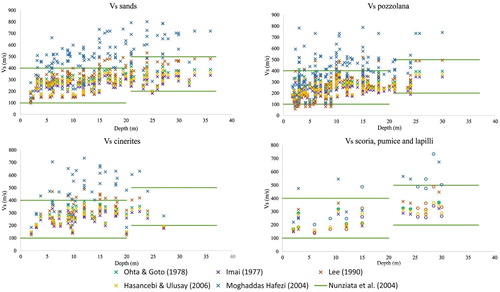
As VS values vary with depth, we considered two layers (0–20 m, 21–37 m) and, for each drilling, we attributed the mean VS obtained by the correlation. Then we computed the VS30 parameter by excluding the first 7 meters of soil:(5)
(5) Using CitationNTC, 2008, we defined soil category C for the entire area of Pozzuoli, for which the PGA was assumed as that coded for the SLD (Damage Limit State – after an earthquake, the building in all its parts must not have suffered damages capable to endanger people who use it and to significantly affect its strength and stiffness), that is 0.085 g for a:
-
Vn (nominal life of the building – number of years in which it is expected to maintain specific levels of performance) = 50 years;
-
cu (coefficient of use) = 1.
This assumption was based on some considerations:
-
- The maximum PGA for Napoli is 0.11 g (southern part of Poggioreale);
-
- The pozzolana composing the soils of Pozzuoli has the same lithological features of that found in Napoli. Moreover, the technical characteristics of pozzolana can vary because of the different degree of cementation and/or welding: very often, these characteristics get worse with the distance from the vent. Assuming Campi Flegrei as the source, it is therefore unlikely that the characteristics of the Pozzuoli soils are worse than those of Napoli's;
-
- Pozzuoli is farther than Napoli from the Apennine seismic sources; this involves greater attenuation for Pozzuoli, so it is unlikely that here we could have values higher than the PGA expected for Napoli.
Therefore, the area of Pozzuoli falls into the intermediate hazard class of seismic hazard map.
It is necessary to emphasize that the hazard map for the whole of the investigated area here obtained () is just a preliminary product; in fact, it is the result of two non-homogeneous approaches for the two municipalities.
3.3. Landslide hazard
The presence of unwelded pyroclastic deposits and the steepness of both volcano flanks and caldera rim favors the occurrence of landslides. In the last decades, the most common landslide types are slides, flows and slide-flows (CitationDi Martire et al., 2012). Landslides occur mainly along high angle slopes (>30°) and are mostly triggered by heavy rainfalls and human activities (CitationDi Martire et al., 2012).
The landslide hazard map published by the ex-Basin Authority of Central Campania (today Southern Apennine Hydrogeomorphologic District) (CitationB.U.R.C. n°33 21/05/2012) represented our data source for the hazard index assessment (). The map is drawn by combining landslides detachment susceptibility and runout susceptibility maps consisting of four classes (low, medium, high, very high). Once again, for the sake of comparison, we reduced these classes to three by merging the two lower hazard classes ().
3.4. Flood hazard
In PNMs, the zones interested by flooding events are mainly flat areas, internal parts of craters and the foot of valleys cutting hills and monogenetic vents. Among these phenomena, there are also flash floods (CitationEsposito et al., 2018; CitationVennari et al., 2016), consequent to heavy rains occurred in a short time interval (CitationBorga, Boscolo, Zanon, & Sangati, 2007), here disregarded due to the lack of a hazard zoning over the whole territory.
Areas subject to flood hazard () are evidenced in the flood hazard map drawn by the ex-Basin Authority of Central Campania. According to three return periods (50, 200, 500 years), three hazard classes are identified (low, medium, high) ().
3.5. Coastal erosion hazard
In PNMs, the sandy coastal areas are few because most of the littoral is artificial. Along the coastal cliffs, mainly built up of NYT/other tuff formations or cemented volcanoclastic rocks, landslide events can occur only when these are characterized by a fracture network that favors the detachment of rock blocks. Such fractures are the results of the coexistence of rocks with different cementation degree, or of the presence of structural discontinuities and/or differential erosion (CitationEvangelista, Scotto Di Santolo, Zimbardo, Ercoli, & Nocilla, 2010). In addition, volcanoclastic rocks are deeply erodible by marine waves although they are cohesive. According to the methodology reported in , three hazard classes are identified (low, medium, high) ().
4. Results: multi-hazard assessment
We used the quoted source maps to draw the single hazard index, multi-hazard and hotspots maps. Through these maps, we investigated different but equally important aspects of hazard management: the hazards level and the spatial recurrence.
-
(a). Monothematic hazard index maps
Applying the formula (2) for PNMs, we obtained five monothematic hazard index maps (one for each hazard). Results (Main map) highlighted that:
-
The territory shows the dominance of cells with a low volcanic hazard index (161 cells out of 278 – ∼58%). This occurs for all cells characterized only by low volcanic hazard or by two/three hazard classes among which low hazard prevails. High hazard class is more frequent than medium one (60 cells out of 278 – ∼21.6%).
In Pozzuoli municipality, high volcanic hazard index typifies the southern area of Astroni and the city center. In Napoli, on the counterpart, the highest volcanic hazard index characterizes the eastern part of the city due to the proximity to Somma-Vesuvio volcano.
-
The medium seismic hazard index class is dominant (129 cells out of 278–46.4%). Most Napoli city is characterized by a low seismic hazard index, due to the presence of tuff at shallow depth, and only 3 cells of the Poggioreale zone show a high seismic hazard index. The entire territory of Pozzuoli shows a medium seismic hazard index.
-
In the landslide hazard index map, 108 out of 278 cells (∼38.8%) show a low hazard index, 33 cells (∼11.8%) a medium hazard (e.g.; Solfatara) and 10 cells (∼3.6%) a high hazard index (e.g.; Camaldoli, in Napoli, and Astroni in Pozzuoli).
-
Similarly, the flood hazard index map shows a predominance of low hazard index (131 cells out of 278 – ∼47%), 15 cells (∼5.4%) have medium (e.g.; eastern sector of Napoli and northern of Pozzuoli) and 8 cells (∼2.9%) (e.g.; SE of Napoli and W of Pozzuoli) high hazard index.
-
In the coastal erosion hazard index map 6 out of 10 cells have low, just 1 cell has medium and 3 cells have high hazard index. Most of the coast is man-made hence very few areas are affected by coastal erosion.
-
(b). Total hazard index map
The sum of the five monothematic hazard indices and their ranking into three classes allowed us to draw the total hazard index map. This map shows a predominance of cells with a medium multi-hazard index (113 out of 278 – 96 cells have low and 68 cells high hazard index).
The largest number of cells with a high total hazard index is concentrated in Pozzuoli; here we have the combination of several types of hazard, most of which with high/medium index. For example, a low total hazard index class may be the result of: (i) the coexistence of three low monothematic hazard indices; (ii) the presence of a single high monothematic hazard index; (iii) the different combinations between two monothematic hazard indices (for detail, see the Main map).
To preserve this information, fundamental for hazard-risk management, four radial graphics were drawn. In these diagrams, each radius corresponds to a cell, the color of the segments forming the radius is referred to the type of hazard and the number of segments to the monothematic hazard index class (Main Map).
-
(c). Hazard hotspot map
The hotspots () correspond to the areas where at least two hazards occur, as well as to those exposed to a single hazard at its highest degree. has been drawn depicting with different full colors the areas where the highest single hazard is recorded, whereas the areas where more than one hazard occurs have been contoured with different colors and filled with different patterns.
Figure 4. Hotspots map displaying both areas affected by high hazard for the single dangerous event and areas characterized by the concomitance of two or more hazards.
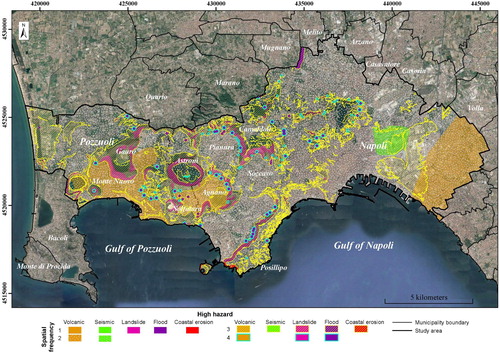
The highest hazard affects: (a) the lowlands in Pozzuoli municipality and the eastern area of Napoli exposed to both the propagation of PDC and the deposition of pyroclastic fall (volcanic hazard); (b) the southern part of Poggioreale in Napoli due to the presence of unconsolidated sediments and peat layers (seismic hazard); (c) the Monte Nuovo, Gauro, Astroni and Agnano crater rims and Camaldoli and Posillipo hills, all characterized by steep slopes and unwelded pyroclastic deposits potentially made instable by heavy rainfalls and uncontrolled human activities (landslide hazard); (d) restricted areas at the mouths of valleys cutting the Camaldoli, Agnano and Posillipo hills where relief energy and torrential regime favor inundation events (flood hazard) and (e) the Posillipo and Nisida Island characterized by cliffs made up of fractured tuffs (coastal erosion).
In both municipalities, the compresence of at least 2–4 types of hazard is detected. The totality of territory is exposed to volcanic and seismic hazard; in fact, about 78% of Napoli and 61% of Pozzuoli municipalities respectively are characterized by the compresence of 2 types of hazard (areas contoured by white lines and filled with grey dot pattern in ).
The overlapping of 3 types of hazard (areas contoured by yellow lines and filled with yellow line pattern) is due to the coexistence of volcanic and seismic hazard with: (i) landslide hazard for 13% of Napoli and 26% of Pozzuoli municipality; (ii) flood hazard, confined to the foot of valleys cutting the hills (7,5% of Napoli and 12% of Pozzuoli municipality) and (iii) coastal erosion for about 0.3% of Napoli (only 0.02% of Pozzuoli). Areas with 4 types of hazard (contoured by a light blue line and with no pattern) are small and remark the spatial concurrence of volcanic, seismic, flood and landslide hazards; they are mostly concentrated at the foot of major reliefs and crater rims (e.g.; Posillipo, Agnano, Camaldoli) (see light blue boundary in ).
5. Conclusions
This research focused on the use of hazard indices and hotspots concept to identify the metropolitan zones needing priority of intervention aimed at reducing hazard-risk.
The hazard indices allow the territorial zoning in response to the spatial extent of areas exposed to hazard and to the hazard intensity, while through the hotspots we easily identify the areas exposed to the highest hazard and/or to the largest number of hazards. The concomitant use of both tools brings to map the hazard degree accounting for the level of multi-hazard as the sum of all the hazard indices, without losing the information on the single hazard intensity, and on the spatial occurrence of all hazards endangering the metropolitan areas.
For the single cell of Napoli and Pozzuoli, we defined the multi-hazard index that in a synthetic and speedy way allows the visualization of the portions of territory more exposed to natural hazards. Additionally, for each multi-hazard class, a description of the single hazard together with the spatial occurrence of hazardous events is given.
In summary, 34% of Pozzuoli and 21% of Napoli municipality are characterized by high hazards and in only two cases, the central portion of Pozzuoli and a small sector of Poggioreale in Napoli, the high hazard zones are also exposed to more than one hazard.
The analysis of such a big amount of data was supported by the use of algorithms available in a GIS environment and resulted in a tool that makes it possible to:
-
- easily adapt the methodology to a different scale;
-
- upgrade the workflows with both the progress of knowledge about a hazard and the integration of other types of hazard (e.g. anthropic hazards);
-
- export the methodology to other endangered areas;
-
- address local authorities to better land management and land use;
This research arises in the context of an active support to the strategies of territorial management; it develops an agile and flexible methodology that can be ultimately used as an aid to identify zones of priority of intervention and properly address funds and energies. Finally, such approach could be used as a preliminary tool for the implementation of Municipal Emergency Plans (MEP – Civil Protection Law -n. 100 July 12th 2012), which are critical documents where all the hazard sources should be effectively combined.
Software
The development of all of the hazard indices and hotspot maps was performed using ArcGIS® 10.3.
The key role of hazard indices and hotspot in disaster risk management: the case study of Napoli and Pozzuoli municipalities (Southern Italy)
Download PDF (6.5 MB)Acknowledgment
We thank the reviewers Y. Hu, H. Apps and G.P. Ganapathy for their valuable comments and suggestions provided.
Disclosure statement
No potential conflict of interest was reported by the authors.
Related Research Data
References
- Alberico, I. , Lirer, L. , Petrosino, P. , & Scandone, R. (2002). A methodology for the evaluation of long-term volcanic risk from pyroclastic flows in Campi Flegrei (Italy). Journal of Volcanology and Geothermal Research , 116 , 63–78. doi: 10.1016/S0377-0273(02)00211-1
- Alberico, I. , & Petrosino, P. (2015). The hazard indices as a tool to support the territorial planning: The case study of Ischia Island (Southern Italy). Engineering Geology , 197 , 225–239. doi: 10.1016/j.enggeo.2015.08.025
- Arnold, M. , Chen, R. S. , Deichmann, U. , Dilley, M. , Lerner-Lam, A. L. , Pullen, R. E. , & Trohanis, Z. (2006). Natural Disaster Hotspots case studies. Disaster risk management series 6. World Bank.
- ARUP and Rockefeller Foundation (2015). City resilience framework . New York : The Rockfeller foundation. Retrieved from https://www.rockefellerfoundation.org/report/city-resilience-framework/
- Bathrellos, G. D. , Skilodimou, H. D. , Chousianitis, K. , Youssef, A. M. , & Pradhan, B. (2017). Suitability estimation for urban development using multi-hazard assessment map. Science of the Total Environment , 575 , 119–134. doi: 10.1016/j.scitotenv.2016.10.025
- Bevilacqua, A. , Isaia, R. , Neri, A. , Vitale, S. , Aspinall, W. P. , Bisson, M. , … Rosi, M. (2015). Quantifying volcanic hazard at Campi Flegrei caldera (Italy) with uncertainty assessment: 1. Vent opening maps. Journal of Geophysical Research: Solid Earth , 120 . doi:10.1002/ 2014JB011775
- Bevilacqua, A. , Neri, A. , Bisson, M. , Esposti Ongaro, T. , Flandoli, F. , Isaia, R. , … Vitale, S. (2017). The effects of vent location, event scale, and time forecasts on pyroclastic density current hazard maps at Campi Flegrei caldera (Italy). Frontiers in Earth Science , 5 , 72. doi: 10.3389/feart.2017.00072
- Borga, M. , Boscolo, P. , Zanon, F. , & Sangati, M. (2007). Hydrometeorological analysis of the 29 august 2003 flash flood in the eastern Italian Alps. Journal of Hydrometeorology , 8 , 1049–1067. doi: 10.1175/JHM593.1
- B.U.R.C. n°33 21/05/2012.
- Calcaterra, D. , Parise, M. , & Palma, B. (2003). Combining historical and geological data for the assessment of the landslide hazard: A case study from Campania, Italy. Natural Hazards and Earth System Science , 3 (1–2), 3–16. doi: 10.5194/nhess-3-3-2003
- Deere, D. U. , & Deere, D. W. (1988). The rock Quality Designation (RQD) index in Practice. In: “Rock Classification systems for Engineering purposes”. ASTM STP , 984 , 91–101.
- Deino, A. L. , Orsi, G. , De Vita, S. , & Piochi, M. (2004). The age of the Neapolitan Yellow Tuff caldera forming eruption Campi Flegrei caldera - Italy assessed by 40Ar-39Ar dating method. Journal of Volcanology and Geothermal Research , 133 , 157–170. doi: 10.1016/S0377-0273(03)00396-2
- Delmonaco, G. , Margottini, C. , & Spizzichino, D. (2006). ARMONIA methodology for multi-risk assessment and the harmonisation of different natural risk maps. Deliverable 3.1.1, ARMONIA.
- De Pippo, T. , Donadio, C. , Pennetta, M. , Petrosino, C. , Terlizzi, F. , & Valente, A. (2008). Coastal hazard assessment and mapping in Northern Campania, Italy. Geomorphology , 97 , 451–466. doi: 10.1016/j.geomorph.2007.08.015
- De Vivo, B. , Rolandi, G. , Gans, P. B. , Calvert, A. , Bohrson, W. A. , Spera, F. , & Belkin, H. E. (2001). New constraints on the pyroclastic eruptive history of the Campanian volcanic Plain (Italy). Mineralogy and Petrology , 73 , 47–65. doi: 10.1007/s007100170010
- Dilley, M. , Chen, R. S. , Deichmann, U. , Lerner-Lam, A. L. , Arnold, M. , Agwe, J. , … Yetman, G. (2005). Natural disaster hotspots: a global risk analysis. Disaster risk management series 5. World Bank.
- Di Martire, D. , De Rosa, M. , Pesce, V. , Santangelo, M. A. , & Calcaterra, D. (2012). Landslide hazard and land management in high-density urban areas of Campania region, Italy. Natural Hazards and Earth System Sciences , 12 , 905–926. doi: 10.5194/nhess-12-905-2012
- Doocy, S. , Daniels, A. , Dooling, S. , & Gorokhovich, Y. (2013). The human impact of volcanoes: A historical review of events 1900–2009 and systematic literature review. PLOS Currents Disasters. 2013 April 16. Edition 1.
- EEA . (2005). Household consumption and the environment (EEA Report N° 11/2005).
- Esposito, E. , Porfido, S. , Luongo, G. , & Petrazzuoli, S. M. (1992). Damage scenarios induced by the major seismic events from XV to XIX century in Naples city with particular reference to the seismic response. Earthquake Engineering, 10th World Conference, 1075–1080.
- Esposito, G. , Matano, F. , & Scepi, G. (2018). Analysis of increasing flash flood frequency in the densely urbanized coastline of the Campi Flegrei volcanic area, Italy. Frontiers in Earth Science , 6 , 63. doi: 10.3389/feart.2018.00063
- Evangelista, A. , Scotto Di Santolo, A. , Zimbardo, M. , Ercoli, L. , & Nocilla, N. (2010). Influence of the behaviour of soft rocks on cliff evolution. Rock Mechanics in civil and environmental engineering. Proceedings of the European rock mechanics symposium, EUROCK 2010 (643–646), Lausanne (Switzerland).
- Ferreira, O. , Viavattene, C. , Jiménez, J. A. , Bolle, A. , das Neves, L. , Plomaritis, T. A. , … van Dongeren, A. R. (2017). Storm-induced risk assessment: Evaluation of two tools at the regional and hotspot scale. Coastal Engineering , XXX , 1–13.
- Garcia-Aristizabal, A. , Bucchignani, E. , Palazzi, E. , D’Onofrio, D. , Gasparini, P. , & Marzocchi, W. (2014). Analysis of non-stationary climate-related extreme events considering climate change scenarios: An application for multi-hazard assessment in the Dar es Salaam region, Tanzania. Natural Hazards , 75 , 289–320. doi: 10.1007/s11069-014-1324-z
- Hasancebi, N. , & Ulusay, R. (2006). Empirical correlations between shear wave velocity and penetration resistance for ground shaking assessments. Bulletin of Engineering Geology and the Environment , 66 , 203–213. doi: 10.1007/s10064-006-0063-0
- Heim, A. (1932). Bergsturze und menschenleben. Fretz & Wasmuth, Zurich, 1–218.
- Hoek, E. (1994). Strength of rock and rock masses. ISRM News Journal , 2 (2), 4–16.
- Hoek, E. , & Brown, E. T. (1997). Practical estimates of rock mass strength. International Journal of Rock Mechanics and Mining Sciences , 34 (8), 1165–1186. doi: 10.1016/S1365-1609(97)80069-X
- Hoek, E. , & Marinos, P. (2000). GSI: A geologically friendly tool for rock mass strength estimation. In Proc. GeoEng2000, International Conference on Geotechnical and Geological Engineering, Melbourne AU (pp. 1422–1446). Lancaster, USA: Technomic publishers.
- Hoek, E. , Marinos, P. , & Benissi, M. (1998). Applicability of the geological strength index (GSI) classification for weak and sheared rock masses. Bulletin of Engineering Geology and the Environment , 57 (2), 151–160. doi: 10.1007/s100640050031
- Hu, Y. , & Wang, F. (2016). Temporal trends of intraurban commuting in Baton Rouge, 1990-2010. Ann. Am. Assoc. Geogr. , 106 (2), 470–479.
- Iavarone, R. , Alberico, I. , Gravagnuolo, A. , & Esposito De Vita, G. (2019). The role of cultural heritage in urban resilience enhancement. In F. Calabrò , et al. (Ed.), New metropolitan perspectives. Local knowledge and innovation dynamics towards territory attractiveness through the implementation of Horizon /E2020/agenda 2030 (pp. 369–377). Reggio Calabria: Springer.
- Imai, T. (1977). P-and S-wave velocities of the ground in Japan. Proceedings of the IX International Conference on Soil Mechanics and Foundation Engineering, (vol. 2, pp. 127–132 ).
- ISTAT . (2017). National institute for statistics. Retrieved from http://www.istat.it /
- Jiménez, J. A. , Sanuy, M. , Ballesteros, C. , & Valdemoro, H. I. (2017). The Tordera Delta, a hotspot to storm impacts in the coast northwards of Barcelona (NW Mediterranean). Coastal Engineerin,g , XXX , 1–11.
- Kappes, M. S. , Keiler, M. , von Elverfeldt, K. , & Glade, T. (2012). Challenges of analyzing multihazard risk: A review. Natural Hazards , 64 , 1925–1958. doi: 10.1007/s11069-012-0294-2
- Kaur, H. , Gupta, S. , Parkash, S. , & Thapa, R. (2018). Application of geospatial technologies for multi-hazard mapping and characterization of associated risk at local scale. Annals of GIS , 24 (1), 33–46. doi: 10.1080/19475683.2018.1424739
- Lee, S. H. H. (1990). Regression models of shear wave velocities in Taipei basin. Journal of the Chinese Institute of Engineers , 13 , 519–532. doi: 10.1080/02533839.1990.9677284
- Lirer, L. , Petrosino, P. , & Alberico, I. (2010). Hazard and risk assessment in a complex multisource volcanic area: The example of the Campania region, Italy. Bulletin of Volcanology , 72 , 411–429. doi: 10.1007/s00445-009-0334-2
- Lirer, L. , Petrosino, P. , Alberico, I. , & Postiglione, I. (2001). Long-term volcanic hazard forecast based on Somma-Vesuvio past eruptive activity. Bulletin of Volcanology , 68 , 145–163.
- Lu, P. , & Stead, D. (2013). Understanding the notion of resilience in spatial planning: A case study of Rotterdam, The Netherlands. Cities , 35 , 200–212. doi: 10.1016/j.cities.2013.06.001
- Malin, M. C. , & Sheridan, M. F. (1982). Computer-assisted mapping of pyroclastic surges. Science , 217 , 637–640. doi: 10.1126/science.217.4560.637
- Marinos, P. , & Hoek, E. (2001). Estimating the geotechnical properties of heterogeneous rock masses such as flysch. Bulletin of Engineering Geology and the Environment , 60 , 85–92. doi: 10.1007/s100640000090
- Marinos, V. , Marinos, P. , & Hoek, E. (2005). The geological strength index: Applications and limitations. Bulletin of Engineering Geology and the Environment , 64 , 55–65. doi: 10.1007/s10064-004-0270-5
- Marzocchi, W. , Mastellone, M. L. , Di Ruocco, A. , Novelli, P. , Romeo, E. , & Gasparini, P. (2009). Principles of multi-risk assessment: Interaction amongst natural and man-induced risks (Project Report). Office for Official Publications of the European Communities, Luxembourg.
- Moghaddas Hafezi, N. , & Panah Komak, A. (2004). Correlation between shear wave velocity and n-value of the standard penetration test in east part of Iran. In The 8th symposium of Geological Society of Iran, Shahrud, 2004 (in Persian ).
- Neri, A. , Bevilacqua, A. , Esposti Ongaro, T. , Isaia, R. , Aspinall, W. P. , Bisson, M. , … Rosi, M. (2015). Quantifying volcanic hazard at Campi Flegrei caldera (Italy) with uncertainty assessment: 2. Pyroclastic density current invasion maps. Journal of Geophysical Research: Solid Earth , 120 , 2330–2349.
- NTC . (2008). Norme Tecniche per le Costruzioni. Gazzetta Ufficiale, 29, 4 February 2008.
- Nunziata, C. (2004). Seismic ground motion in Napoli for the 1980 Irpinia earthquake. Pure and Applied Geophysics , 161 , 1239–1264. doi: 10.1007/s00024-003-2489-7
- Nunziata, C. , Natale, M. , & Panza, G. F. (2004). Seismic characterization of Neapolitan soils. Pure and Applied Geophysics , 161 , 1285–1300. doi: 10.1007/s00024-003-2492-z
- Nunziata, C. , Sacco, C. , & Panza, G. F. (2011). Modeling of ground motion at Napoli for the 1688 scenario earthquake. Pure and Applied Geophysics , 168 , 495–508. doi: 10.1007/s00024-010-0113-1
- OECD . (1993). OECD economic outlook N°53, June 1993.
- Ohta, Y. , & Goto, N. (1978). Empirical shear wave velocity equations in terms of characteristic soil indexes. Earthquake Engineering & Structural Dynamics , 6 , 167–187. doi: 10.1002/eqe.4290060205
- Orsi, G. , De Vita, S. , & Di Vito, M. A. (1996). The restless, resurgent Campi Flegrei nested Caldera (Italy): constraints on its evolution and configuration. Journal of Volcanology and Geothermal Research , 74 , 179–214. doi: 10.1016/S0377-0273(96)00063-7
- Satta, A. , Snoussi, M. , Puddu, M. , Flayou, L. , & Hout, R. (2016). An index-based method to assess risks of climate-related hazards in coastal zones: The case of Tetouan. Estuarine, Coastal and Shelf Science , 175 , 93–105. doi: 10.1016/j.ecss.2016.03.021
- Sundermann, L. , Schelske, O. , & Hausmann, P. (2014). Mind the risk:A global ranking of cities under threat from natural disaster (Swiss Re. Report No. 1505715_13_en12/14). pp. 39.
- Tasan-Kok, T. , Stead, D. , & Lu, P. (2013). Conceptual overview of resilience: History and context. In A. Eraydin & T. Tasan-Kok (Eds.), Resilience thinking in urban planning (pp. 39–51). Dordrecht: GeoJournal Library, 106, Springer Science.
- UNESCO . (1972). Report of consultative meeting of experts on the statistical study of natural hazards and their consequences. Document SC/WS/500, 1–11.
- Varnes, D. J. (1984). Commission on the Landslides of the IAEG, UNESCO. Landslide Hazard Zonation: A Review of Principles and Practice, 3, 61.
- Vennari, C. , Parise, M. , Santangelo, N. , & Santo, A. (2016). A database on flash flood events in Campania, Southern Italy, with an evaluation of their spatial and temporal distribution. Natural Hazards and Earth System Sciences , 16 , 2485–2500. doi: 10.5194/nhess-16-2485-2016
- Yordanova, R. P. , & Curt, C. (2018). Towards a systematic qualitative methodology for multi-hazards risk representation and preliminary assessment. Conference: 10èmes journées Fiabilité des Matériaux et des Structures - Bordeaux, 27–28 Mars 2018, France.