
 ?Mathematical formulae have been encoded as MathML and are displayed in this HTML version using MathJax in order to improve their display. Uncheck the box to turn MathJax off. This feature requires Javascript. Click on a formula to zoom.
ABSTRACT
During our soil-specific drought sensitivity research, an aim of ours was to ascertain how drought, a stress factor caused by the lack of precipitation, affects soil fertility. We used the five-year-long (1985–1989) soil and corn yield data of the National Pedological and Crop Production Database (NPCPD). We assigned the annual Pálfai Drought Index (PaDI) to the annual corn yield data of the NPCPD in order to identify drought-free corn yields and production areas. We determined the drought sensitivity of soils by comparing drought-free and annual yields. Based on the results of our statistical analyses, we created a seven-point drought sensitivity scale of soil types, based on which we produced a national soil-specific drought sensitivity index map. Our results may provide a good starting point for constructing large-scale (1: 10,000) climate sensitivity soil maps of agricultural lands, which can assist with soil-specific crop production that also adapts to climate change.
1. Introduction
Potential soil fertility and the environmental impacts affecting it can be explained and predicted with different accuracy by employing a variety of methods (CitationVan Diepen, Van Keulen, Wol, & Berkhout, 1991). Nowadays it is possible to estimate and model the fertility of an agricultural land by applying different geo-statistical and GIS methods. Research into this direction began in the 1970s, and, in modern land evaluation practice, especially the results of European researchers allowed classifying agricultural lands into categories on the basis of their real soil fertility (CitationBeek, 1978; McRea & Burnham, Citation1981; CitationOlson, 1974). In order to classify arable lands, fertility estimations based on quantifying significant soil properties and using IT applications were made by Bouma & Bregt first (Citation1989), who were followed by CitationWagenet and Bouma (1993), then CitationHack-ten Broeke, Van Lanen, and Bouma (1993). Lots of authors aimed at quantifying the attribute information of digital soil maps as well as harmonizing pedological datasets on the basis of uniform scales (CitationAgbu & Olson, 1990; CitationBeckett & Webster, 1971; CitationBoehm & Anderson, 1997; CitationGaston, Nkedi-Kizza, Sawka, & Rao, 1990; CitationMahmoudjafari, Kluitenberg, Havlin, Sisson, & Schwab, 1997; CitationThompson, Bell, & Butler, 1997; CitationWebster, 1985; CitationSchellentrager & Doolittle, 1991). CitationWarrick and Nielsen (1980) made spatial estimation for the soil properties of areas not having been studied before on the basis of small-scale soil map data. As a result of their research, they concluded that certain properties of the same soil types can exhibit great spatial heterogeneity. Inaccurate soil map data can be improved by different point estimation procedures. Over the past four decades, different interpolation and kriging methods were often used to spatially extend the point data of soil properties (CitationBurgess & Webster, 1980; CitationJournel & Huijbregts, 1978).
Soil mapping has had a long-standing tradition in Hungary (CitationStefanovits, 1992; CitationVárallyay, 1989, Citation2012), and these works provide a great amount of pedological information. At the same time, these data have not been evaluated and analysed in relation to environmental protection (CitationSisák & Bámer, 2008), although digital soil mapping procedures would provide an opportunity to carry out complex analyses. The National Soil Strategy (CitationNémeth, Stefanovits, & Várallyay, 2005) as well as the INSPIRE directive of the EU (CitationEC, 2007) also address and encourage their use.
Several authors have highlighted that in recent years there has been an increasing demand for soil-related information coming from other scientific areas besides soil evaluation (CitationBehrens & Scholten, 2006; CitationMcBratney, Mendonca Santos, & Minasny, 2003; CitationSzabó, Pásztor, & Bakacsi, 2005). Digital soil mapping methods, the development of GIS, and increasing accuracy of spatial details allow a more accurate classification of soils (CitationTóth & Máté, 2006) and their highly detailed analysis. GIS tools and methods as well as the development of pedological information allow the integration of existing maps and other soil databases (CitationBakacsi, Laborczi, Szabó, & Takács, 2014; CitationBehrens & Scholten, 2006). Digital soil mapping and its wide range of applications offered by the faster and faster progress is highly prevalent nowadays (CitationPásztor, Szabó, Bakacsi, & Laborczi, 2013; CitationPásztor, Szabó, Bakacsi, & Laborczi, 2014; CitationSzatmári & Barta, 2013). The means, instruments, and the application possibilities of soil mapping is described in Pásztor and Takács’s ‘Remote sensing in soil mapping’ article (Citation2014) in detail.
Extreme weather events nowadays that occur as a result of climate change are causing unequal rainfall distributions, which can cause drought, among other things. The droughty periods appear more often and they take longer and longer in the last 40 years, moreover, their impact is also increasing, which is a growing problem for agriculture. It influences negatively the soil fertility through natural water supply. Different soils react differently to the stress effects evolved as a result of lack of precipitation, so their drought sensitivity will not be the same. The method prepared by us examined the drought sensitivity in a novel approach through the soil-specific yield reactions of different seasonal effects with the help of yield maps. Our investigations corn culture was chosen because in Hungary, together with winter wheat, corn has the biggest growing area among arable crops. Besides, corn is one of the most drought sensitive crops.
2. Materials and methods
2.1. National Pedological and Crop Production Database (NPCPD)
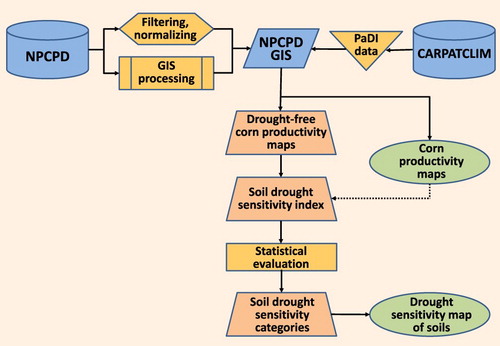
The NPCPD contains pedological information about different crop production sites of Hungary (arable land, meadows, pastures, vineyards, gardens, orchards, and afforested agricultural sites). The database includes data from about four million hectares of land and their complex crop production of five years (1985–1989) (CitationDebreczeni et al., 2003; CitationMakó, Tóth, Máté, & Hermann, 2007; CitationTóth, 2001; CitationTóth & Máté, 2006). In addition, it provides time-series data about fertilizer and manure use per field as well as the crop yields of 196 cultivated plant types and their forecrops (CitationKocsis, Tóth, Berényi Üveges, & Makó, 2014). The soil and corn yield data of the GIS-based NPCPD database were used for the determination of the microregional soil drought sensitivity values. The process of this task is shown on .
Figure 1. Forming of soil drought sensitivity indices from the geocoding NPCPD database information. NPCPD: National Pedological and Crop Production Database; PaDI: Pálfai Drought Index; CARPATCLIM: Climate of the Carpathian Region Database.
2.2. Processing of the NPCPD database
Statistical analysis of the relationship between the soil/corn/seasonal effect was carried out on the basis of the filtered data of the NPCPD (NPCPD ver3.0). Inaccurate records resulting from erroneous data recording were excluded. For this reason, the filtered database used in our analyses currently consists of 321,915 data rows, and it provides information about 76,849 crop production units of 2,970,895 hectares of agricultural land on a mean annual basis. We also filtered the corn yield due to the elimination of the interfering effect of inappropriate and raised yield data. Then, we calculated the mean national corn yield and the standard deviation of the yields. We also assessed the double of the standard deviation of the yields both in the positive and negative directions. We excluded the yields that exceeded the double standard deviations in both directions.
Next, we normalized the corn yields due to the easier interpretability of the results and comparability to other crops to a scale ranging from 1 to 100 (Equationequation 1(1)
(1) ):
(1)
(1) where: Crop100
– is the yield of a certain crop normalized to a 1–100 scale; Crop – is the yield of a certain crop (t ha−1); Crop
min – is the minimum yield of a certain crop (t ha−1); Crop
max – is the maximum yield of a certain crop (t ha−1). We carried out our analyses on the NPCPD (ver3.0) database consisting of 56,774 records of information about corn, which includes 11,349 fields and parcels on a five-year average as well as 613,156 hectares of arable land; all of which includes a total of 249,862 soil sampling locations.
2.3. GIS processing of the NPCPD
We converted the TIEDIT (Unified Digital Map of Hungarian Land Use Information) XY coordinates of the NPCPD soil-sampling sites into the HD 1972 Unified National Projection System (EOV in Hungary) in accordance with a method developed by us (CitationKocsis et al., 2014). The TIEDIT mapping system developed in the mid-1970s was also used for military purposes to a certain extent, furthermore, the mapping database called the Landcover System of Hungary was also based on this system (CitationDomokos, 2004). The TIEDIT coordinates contain artificial distortions, as a result, their projections are dimensionally not stable concerning bigger areas. Their inaccuracy originating from artificially generated distortion may as well reach several kilometres (CitationKiss, Jordán, Detzky, & Vértesy, 2013). Based on our experiences, the TIEDIT coordinates shift 3-5 km to southeast in the western, and 3-5 km northwest in the eastern part of Hungary. Due to the distortions, we could not transfer the TIEDIT coordinates directly into the EOV projection system, so their conversion was carried out in two steps. Firstly, we used sampling sites with known EOV coordinates to perform an approximate inversion with linear regression fit, and, secondly, we performed the accurate geo-referencing of the soil-sampling sites. In order to do so, we used the 1: 100,000 scale CORINE Land Cover (CLC2000) database from 2000 (CitationBüttner & Maucha, 2006; CitationFÖMI, 2012), and the DTA-50 (Digital Mapping Database, scale: 1:50,000) database renewed in May 2000, which contains the data describing the hydrography of rivers and lakes as well as the administration (country, state, urban) boundaries.
2.4. Creating corn productivity maps
We created the yearly corn yield maps by ordinary kriging. The spatial extension of corn yields was carried out by estimating the crop produce of other 20 surrounding soil sampling points of each and every NPCPD soil sampling points. When kriging the maps based on the point estimations, we applied the highest spatial smoothing value of 0.5 (Map 1 (Main map)).
2.5. Construction of drought sensitivity map of soils for corn
In order to carry out annual climate effect analysis, we assigned the annual Pálfai Drought Index (PaDI) to the corn yields. The PaDI is commonly used to quantify droughts in Hungary. It was developed in the 1980s, and it characterises the drought strength of an agricultural production year with a single numerical value (EquationEquation 2(2)
(2) ). The PaDI is defined with only the monthly mean temperature and monthly precipitation data (CitationLakatos, Szentimrey, Bihari, & Szalai, 2013). We modified the calculation of the drought index for practical applicability (CitationBihari et al., 2012). Based on this change, the base value of the Pálfai Drought Index can be calculated by using the following formula:
(2)
(2) where: PaDI0
– is the base value of the Pálfai Drought Index (°C/100 mm); Ti
– is the monthly mean temperature from April to August (°C); Pi
– is the monthly precipitation from October to September (mm); wi
– is a weighing factor; c – is a constant value (10 mm). The drought index data used in the present study were acquired from www.carpatclim-eu.org website.
The Word Geodetic System 1984 (WGS84) projection vector files contain information on drought, where the values of Hungary, apart from the western frontier, are situated in a meteorological graticule containing 1,045 grids with a spatial resolution of 10×10 km. The grid data were converted from the WGS84 coordinate system into the EOV projection.
We generated 200×200 m resolution raster maps displaying the extent of drought in the country on the basis of the meteorological grid values per years. Then we assigned category variables to the PaDI values of the drought maps on the basis of CitationBihari et al. (2012), which we used to characterize the agricultural years of the NPCPD (1985–1989). Drought-free areas were also marked per year, and by merging these areas, we produced the drought-free area map of the 1985–1989-period (5 years). Where we could not mark any drought-free areas concerning the NPCPD years (eg. the Danube-Tisza Sand Ridge), we worked with the most moderate (mild) drought category.
The latter map helped us to determine the drought-free corn yields of the NPCPD years normalized for a 1–100 scale, which is independent from the annual effects of weather conditions. Then, for our statistical analyses, we assigned the values of the krigged corn yield maps as well as the raster values of the PaDI drought map to the GIS file of the NPCPD ver3.0.
When generating the soil drought sensitivity index, we calculated the difference between the ‘normal’ corn yield and the previously determined drought-free corn yield, then we divided the result with the Pálfai drought-index value. We used the decision tree technique CHAID (Chi-square automatic interaction detection) to classify the results (CitationMakó, Tóth, Kocsis, & Hernádi, 2013; CitationTóth, 2010; CitationTóth, Makó, Guadagnini, & Tóth, 2012) by taking into account certain soil parameters (sub-type, texture, pH, KCl value, humus and lime content). As a result, 133 groups (nodes) were determined. We formed equal-ranking category variables ranging from 1 to 10 from the mean values of the group estimated with the help of the CHAID method (SPSS/Transform/Visual binning).
Next, we applied an one-factor analysis of variance (Oneway) to see if the previously formed categories differ significantly from each other. Since the Levene's test of homogeneity showed that the standard deviations are different, we applied the Tamhane’s T2 probe. Based on the results of the test, the groups of each category could not be separated from each other explicitly, so we merged them. In the end, we could characterize Hungarian soils with 7 different drought-sensitive groups (categories). The determined drought sensitivity values were extended to the 230 physical geography microregions (CitationDövényi et al., 2010; CitationCsorba et al., 2018) with zone statistic.
Due to the lack of meteorological and drought index (PaDI) data, we could not compute soil drought sensitivity index for the soils located to the west of 17° E – the western frontier of Hungary. We determined drought sensitivity categories for this area by estimation, and in order to do so, we used the known soil-type parameters and corn yields from other parts of the country (Map 2 (Main map)).
3. Results and conclusions
According to the data provided by the geospatial NPCPD ver3.0 database (CitationKocsis et al., 2014), the crop maps of the agricultural years (1985–1989) show that the highest corn yields can be attributed to chernozem soils depending on the annual effect of climate (CitationPepó, 2005; CitationSzász, 2005). On the basis of the calculated mean PaDI values, the years 1985 and 1989 were drought-free periods, while the interim three years were slightly dry. The corn yield maps of 1985 and 1988 represented in Map 1 shows the best corn-growing sites of Hungary, which are as follows: Kaloz-Igari Loess Ridges (1.4.32), Szigetköz (2.1.11.), Central Mezőföld (1.4.21), Southern Mezőföld (1.4.25), Tolnai-Sárköz (1.1.24), Békés Ridge (1.13.12), Csanád Ridge (1.13.11), Hajdúhát (1.11.11), Southern Hajdúság (1.11.12), and other subregions.
1989 was a drought-free year on average, since the Mohács Terraced Plain (1.1.26), Hatvan Plain (1.9.11) and the Tápió Riverscape (1.9.12) had outstandingly high yields compared to the other years. High-yielding corn fields are situated on former or current alluvial fans, and on soils with loess parent material, soils with loam and clay-loam physical properties, and soils with appropriate water management. 1988 proved to be the driest of the slightly dry years (based on the mean national PaDI value of 5.28), since most of the ideal crop-producing areas had unusually low yields. High yields characterized only some subregions (Map 1), for example, Hajdúhát (1.11.11), Southern Hajdúság (1.11.12), Érmellék Loess Ridge (1.12.14), and Csanád Ridge (1.13.11). The other annual yield map also shows (Map 1) that yield differences between wet and dry years are significantly greater (CitationKismányoky, 2005). In general, the lowest corn yields were found on sandy soil types (Dorozsma-Majsa Sand Ridge (1.2.15)), and on highly clayey soils (eg. Körösmenti Plain (1.12.23), Small Sárrét (1.12.22)).
The map displaying the drought sensitivity of soils for corn (Map 2) also shows that the corn yields of the Central Great Plain are significantly affected by the limited amount of available water, which comes from precipitation and soil moisture (CitationCsajbók, 2000; CitationJolánkai, Szentpétery, & Szöllősi, 2003). The past few decades are characterized by more and more serious drought, which affects the eastern and the south-eastern parts of the country with an absence of 200-300 mm of precipitation on average (CitationBocz, 1995; CitationJolánkai & Birkás, 2009; CitationMárton, 2002; Citation2005; CitationMolnár, 2006; CitationPepó, 2007; CitationSárvári, El-Hallof, & Molnár, 2006). It is reflected in greater crop yield deficit on the more drought-sensitive soils. Crop deficit can also be observed in south-west Hungary: in Kerka Riverscape (3.4.12), the left riverside of the Mura (3.4.31), Central Zala Hills (3.4.13) and Vas Ridge (3.1.32) (Map 2), which is the wettest region of the country with an average rainfall of around 800 mm (CitationVarga-Haszonits & Varga, 2005). The Mediterranean climatic influence is increasing in this area, and, according to the 30-year long (1980–2010) time-series data of the National Weather Service (CitationBartholy et al., 2011), summer mean temperatures have increased by an average of 2 °C. The latter change is confirmed by CitationMáté, Makó, Sisák, and Szász (2008, Citation2009), whose research on the climate sensitivity of soils found that Hungarian soil zones shift, and, in addition, the Mediterranean climatic influence becomes dominant at the expense of continental influence in some areas.
The drought-sensitivity of, highly acidic (clay illuviation and pseudogley) forest soils with low fertility found in south-western Hungary may be further strenghtened by the fact, that the parent material of these soils is alluvial material (gravel) and they are often sandy and sandy loam type soils with poor water retention capability (). The drought sensitivity of clayey soils is proved by the research results of CitationCsorba et al. (2012), who found that the croplands with mostly wet and highly clayey soil types located in the Great Plain (Map 2), for example, Southern Tisza Valley (1.8.12), Small Sárrét (1.12.22) Körös Riverscape (1.12.23), are significantly affected by climate-change-induced drought.
Table 1. Distribution of soil specific drought sensitivity categories according to main soil types and soil texture for corn.
The method we developed for corn, unfortunately, is not suitable for taking into account the cumulative effects of adverse weather factors, because we did not include the extent of the previous year's water shortage in our calculations. As for future research direction, we intend to make more precise drought sensitivity indicators on the basis of the strong relationship between the precipitation of the vegetation period and crop yields as determined by CitationBlaskó and Zsigrai (2000), then by CitationJolánkai et al. (2003), and the meteorological datasets for the vegetation period. We also plan to include some topographical factors (altitude above sea level, hillslope location, aspect, spatial position and other geomorphological attributes) to our drought sensitivity estimation model, as well as to determine the national-scale soil-specific drought sensitivity indicators of other arable crops, such as spring barley, rapeseed, alfalfa, etc.
The research results of different Hungarian long-term experiments concerning the climate sensitivity of soils are already available, but their synthesis, statistical analysis and nationwide extension have not been realized yet.
Our examination results prove the increasing of the drought sensitivity of forest soils situated in Southwestern part of Hungary. Moreover, the results also prove the large drought involvement of the areas where soils with high sand content or heavy soils with high clay content can be found. Not only the increasing extent of aridity can cause large problems but the increasing of mean temperature can also generate the increase of soil drought sensitivity. This can also be observed in case of forest soils situated in the Southwestern part of Hungary, where the precipitation amount is high. Our crop-specific drought sensitivity map, which is based on examinations of soil-climate-yield reactions and edited yield maps is a novelty on a European scale; till now, similar work has not yet been made.
Our large scale (national) drought sensitivity research creates the possibility of preparing 1:10,000 scale climate sensitivity maps of crop production sites, which could contribute to the soil-specific crop production, that can adapt to climate change more easily.
Software
We used the ESRI arcGIS 9.3 GIS software to carry out the vector operations, to convert the AIIR ver3.0 database into a map projection system (the Unified National Projection (EOV)), and to apply other spatial and statistical analyses. For further statistical tests, we used the IBM SPSS Statistics 18.0 software.
Map_2_revised3.pdf
Download PDF (13.6 MB)Map_1_revised3.pdf
Download PDF (1.5 MB)Acknowledgements
The publication is supported by the EFOP-3.6.2-16-2017-00010 project and Ring 2017 Sustainable Raw Materials program. This research was supported by the European Union and the State of Hungary, co-financed by the European Social Fund in the framework of TÁMOP-4.2.4.A/ 2-11/1-2012-0001 ‘National Excellence Program’ and TÁMOP-4.2.2.A-11/1/KONV-2012-0064 project. We acknowledge the financial support of Széchenyi 2020 under the EFOP-3.6.1-16-2016-00015. Our research was supported by the Hungarian National Research, Development and Innovation Office (NRDI; Grant No: KH126725).
Disclosure statement
No potential conflict of interest was reported by the authors.
Related Research Data
References
- Agbu, P. A. , & Olson, K. R. (1990). Spatial variability of soil properties in selected Illinois Mollisols. Soil Science , 150 , 777–786. doi: 10.1097/00010694-199011000-00004
- Bakacsi, Z.s , Laborczi, A. , Szabó, J. , & Takács, K. (2014). Az 1:100 000-es földtani térkép jelkulcsának és a FAO rendszer talajképző kőzet kódrendszerének javasolt megfeleltetése. Agrokémia és Talajtan , 63 (2), 189–202. doi: 10.1556/Agrokem.63.2014.2.3
- Bartholy, J. , Bihari, Z. , Horányi, A. , Krüzselyi, I. , Lakatos, M. , Pieczka, I. , … Toma, C. (2011). Hazai éghajlati tendenciák. In J. Bartholy , L. Bozó , & L. Haszpra (Szerk.), Klímaváltozás – 2011. Klímaszcenáriók a Kárpát-medence térségére (pp. 145–169). Budapest : Magyar Tudományos Akadémia – Eötvös Loránd Tudományegyetem Meteorológiai Tanszék. Retrieved from http://nimbus.elte.hu/~klimakonyv/Klimavaltozas-2011.pdf
- Beckett, P. H. T. , & Webster, R. (1971). Soil variability: A review. Soils Fertility , 34 , 1–15.
- Beek, K. J. (1978). Land evaluation for agricultural development . ILRI Publication, 23. ILRI : Wageningen.
- Behrens, T. , & Scholten, T. (2006). Digital soil mapping in Germany (a review). Journal of Plant Nutrition and Soil Science , 169 , 434–443. doi: 10.1002/jpln.200521962
- Bihari, Z. , Gauzer, B. , Gnandt, B. , Gregorič, G. , Herceg, Á , Kovács, T. , … Vincze, E. (2012). Délkelet-Európai Aszálykezelési Központ – DMCSEE projekt. In Z. Bihari (Ed.), Összefoglaló a projekt eredményeiről . Budapest : Országos Meteorológia Szolgálat. Retrieved from http://www.met.hu/doc/DMCSEE/DMCSEE_zaro_kiadvany.pdf
- Blaskó, L. , Zsigrai, Gy. (2000). A műtrágyázás hatása a kukorica termésére és néhány talajjellemzőre réti csernozjom talajon. Gyakorlati Agrofórum , 11 ( 3 ), 48–50.
- Bocz, E. (1995). A fenntartható fejlődés időszerű kérdései. In F. Szabó , G. Nagy , M. Jolánkai , P. Szabó , J. Kovács , L. Szabó , & Z. Menyhért , (Szerk), A fenntartható fejlődés időszerű kérdései a mezőgazdaságban (pp. 1–20). Keszthely : XXXVII. Georgikon Napok.
- Boehm, M. M. , & Anderson, D. W. (1997). A landscape-scale study of soil quality in three prairie farming systems. Soil Science Society of America Journal , 61 , 1147–1159. doi: 10.2136/sssaj1997.03615995006100040022x
- Bouma, J. , & Bregt, A. K. (1989). Land qualities in space and time . Proceedings of a symposium organized by the International society of Soil Science (pp. 3–13), Wageningen: Pudoc, Netherlands.
- Burgess, T. M. , & Webster, R. (1980). Optimal interpolation and isarithmic mapping of soil properties: I. The variogram and punctual kriging. Journal of Soil Science , 31 , 315–331. doi: 10.1111/j.1365-2389.1980.tb02084.x
- Büttner, G. , & Maucha, G. (2006). The thematic accuracy of Corine land cover 2000. Assessment using LUCAS (land use/cover area frame statistical survey). Technical report, 7. Copenhagen: European Environment Agency. Retrieved from http://reports.eea.europa.eu/technical_report_2006_7/en
- Csajbók, J. (2000). A termesztési tényezők és a produkció összefüggései kukoricában. In F. Szabó (Ed.), Agrár-termékpiacok és környezetük (pp. 231–235). Keszthely : XLII. Georgikon Napok.
- Csorba, P. , (Ed.), Ádám, S. , Bartos-Elekes, Z. , Bata, T. , Bede-Fazekas, Á , Czúcz, B. , … Vasvári, M. (2018). Tájak. In K. Kocsis (Ed.), Magyarország nemzeti atlasza: Természeti környezet (pp. 113–130). Budapest : MTA CSFK Földrajztudományi Intézet.
- Csorba, P. , Blanka, V. , Vass, R. , Nagy, R. , Mezősi, G. , & Burghard, M. (2012). Hazai tájak működésének veszélyeztetettsége új klímaváltozási előrejelzés alapján. Földrajzi Közlemények , 136 ( 2 ), 237–253.
- Debreczeni, B.-n. , Kuti, L. , Makó, A. , Máté, F. , Szabóné Kele, G. , Tóth, G. , & Várallyay, G. (2003). D-e-Meter földminősítési viszonyszámok elméleti háttere és információ tartalma. In Z. Gaál , F. Máté , & G. Tóth (Eds.), Földminősítés és földhasználati információ (pp. 23–36). Keszthely : Veszprémi Egyetem.
- Domokos, G. (2004). A térinformatika fejlődése, helyzete Magyarországon. ESRI Magyarország Kft. Térinformatika . Székesfehérvár : Nyugat-magyarországi Egyetem, Geoinformatikai Kar. Retrieved from http://www.geo.info.hu/rendezvenyek/10eves/3/4%20ESRIGEO10.pdf
- Dövényi, Z. , (Ed.), Becse, A. , Mezősi, G. , Ádám, L. , Juhász, Á , Marosi, S. , … Keresztesi, Z. (2010). Magyarország kistájainak katesztere. Második, átdolgozott és bővített kiadás . Budapest : MTA Földrajztudományi Kutatóintézet.
- EC. (2007). Directive 2007/2/EC of the European Parlament and of the Council of 14 March 2007 establishing an Infrastructure for Spatial Information in the European Community (INSPIRE).
- FÖMI , (2012). CORINE Land Cover 1:100 000 méretarányú felszínborítási adatbázis. Retrieved from http://www.fomi.hu/corine/clc100_index.html
- Gaston, L. , Nkedi-Kizza, P. , Sawka, G. , & Rao, P. S. C. (1990). Spatial variability of morphological properties at a Florida flatwoods site. Soil Science Society of America Journal , 54 , 527–533. doi: 10.2136/sssaj1990.03615995005400020040x
- Hack-ten Broeke, M. J. D. , Van Lanen, H. A. J. , & Bouma, J. (1993). The leaching potential as a land quality of two Dutch soils under current and potential management conditions. Geoderma , 60 , 73–88. doi: 10.1016/0016-7061(93)90019-H
- Jolánkai, M. , & Birkás, M. (2009). Climate change and water availability in the agro-ecosystems of Hungary. Columbia University Seminars , 38–39 , 171–180.
- Jolánkai, M. , Szentpétery, Z. , & Szöllősi, G. (2003). Az évjárat hatása az őszi búza termésére és minőségére. “AGRO-21” Füzetek , 31 , 74–82.
- Journel, A. G. , & Huijbregts, C. H. (1978). Mining Geostatistics . London: England : Academic Press.
- Kismányoky, T. (2005). A globális klímaváltozás hatásai és válaszai Közép- és Dél-Dunántúl szántóföldi növénytermelésében. “AGRO-21” Füzetek , 41 , 81–94.
- Kiss, J. , Jordán, G. , Detzky, G. , & Vértesy, L. (2013). Bezárt bányászati hulladékkezelő létesítmények nyilvántartása és kockázati besorolása. Bányahulladék nyilvántartás. Retrieved from http://www.uni-miskolc.hu/∼earthc/4old/C_6_KissJ-JGY-DG-VL.pdf
- Kocsis, M. , Tóth, G. , Berényi Üveges, J. , & Makó, A. (2014). Az Agrokémiai Irányítási és Információs Rendszer (AIIR) adatbázis talajtani adatainak bemutatása és térbeli reprezentativitás-vizsgálata. Agrokémia és Talajtan , 63 ( 2 ), 223–248. doi: 10.1556/Agrokem.63.2014.2.5
- Lakatos, M. , Szentimrey, T. , Bihari, Z. , & Szalai, S. , (2013). Creation of a homogenized climate database for the Carpathian region by applying the MASH procedure and the preliminary analysis of the data. Időjárás , 117 ( 1 ), 143–158.
- Mahmoudjafari, M. , Kluitenberg, G. J. , Havlin, J. L. , Sisson, J. B. , & Schwab, A. P. (1997). Spatial variability of nitrogen mineralization at the field scale. Soil Science Society of America Journal , 61 , 1214–1221. doi: 10.2136/sssaj1997.03615995006100040029x
- Makó, A. , Tóth, B. , Kocsis, M. , Hernádi, H. (2013). Talajtérképi információkon alapuló talajfizikai becslőmódszerek alkalmazása a növénytermesztésben és a környezetvédelemben. In Janda, T. (Szerk.) II. ATK Tudományos Nap ( 2013. november 8., Martonvásár, 148–151). Martonvásár : Magyar Tudományos Akadémia Agrártudományi Kutató Központ.
- Makó, A. , Tóth, G. , Máté, F. , & Hermann, T. (2007). A talajtermékenység számítása a változati talajtulajdonságok alapján. In T. Tóth , G. Tóth , T. Németh , & Z. Gaál (Szerk.), Földminősítés, földértékelés és földhasználati információ (pp. 39–44). Budapest – Keszthely : MTA Talajtani és Agrokémiai Kutatóintézet – Pannon Egyetem.
- Márton, L (2002). A csapadék-, a tápanyagellátás és az őszi búza (Triticum aestivum L.) termése közötti kapcsolat. Növénytermelés , 51 ( 5 ), 530–540.
- Márton, L. (2005), Effect of mineral fertilization and rainfall on the yield of corn (Zea mays L .). Agrokémia és Talajtan , 54 ( 3 ), 309–324. doi: 10.1556/Agrokem.54.2005.3-4.5
- Máté, F. , Makó, A. , Sisák, I. , & Szász, G. (2008). Talajaink klímaérzékenysége, talajföldrajzi vonatkozások. Talajtani Vándorgyűlés, 2008. május 28-29. In Simon, L. (Ed.), Talajvédelem, különszám, 141–146. Nyíregyháza: Talajvédelmi Alapítvány – Bessenyei György Kiadó.
- Máté, F. , Makó, A. , Sisák, I. , & Szász, G. (2009). A magyarországi talajzónák és a klímaváltozás. “AGRO-21” Füzetek , 56 , 36–42.
- McBratney, A. , Mendonca Santos, M. L. , & Minasny, B. (2003). On digital soil mapping. Geoderma , 117 , 3–52. doi: 10.1016/S0016-7061(03)00223-4
- McRea, S. G. , & Burnham, C. P. (1981). Land evaluation. Monographs on soil survey no. 7 . Oxford : Clarendon Press.
- Molnár, K. (2006). Hazai csapadékváltozások. Természettudományi Közlöny (különszám ), 127 ( 1 ), 66–68.
- Németh, T. , Stefanovits, P. , & Várallyay, G. (2005). Talajvédelem. Országos Talajvédelmi Stratégia tudományos háttere. Kármentesítési tájékoztató . Budapest : Környezetvédelmi és Vízügyi Minisztérium.
- Olson, G. W. (1974). Land classifications. Searcher Agricultural , 4 , 1–34.
- Pásztor, L. , Szabó, J. , Bakacsi, Zs. , & Laborczi, A. (2014). Elaboration of novel, countrywide maps for the satisfaction of recent demands on sptial, soil related information in Hungary. In D. Arrouays (Ed.), Global soil Map (pp. 207–212). Balkema : CRC Press.
- Pásztor, L. , Szabó, J. , Bakacsi, Zs ., & Laborczi, A. (2013). Elaboration and applications of spatial soil information systems and digital soil mapping at Research Institute for Soil Science and Agricultural Chemistry of the Hungarian Academy of Sciences. Geocarto International , 28 ( 1 ), 13–27. doi: 10.1080/10106049.2012.685895
- Pásztor, L. , & Takács, K. (2014). Távérzékelés a talajtérképezésben. Agrokémia és Talajtan , 63 (2), 353–370. doi: 10.1556/Agrokem.63.2014.2.13
- Pepó, P. (2005). A globális klímaváltozás hatásai és válaszai a Tiszántúl szántóföldi növénytermelésében. AGRO-21 Füzetek , 41 , 59–65.
- Pepó, P. (2007). A Klímaátlakulás kedvezőtlen hatásai és az alkalmazkodás termesztéstechnológiai elemei a szántóföldi növénytermesztésben. Agrofórum , XVIII (11), 17–26.
- Sárvári, M. , El-Hallof, N. , & Molnár, Z. (2006). A kukorica termesztése. Őstermelő , 2 , 60–62.
- Schellentrager, G. W. , & Doolittle, J. A. (1991). Using systematic sampling to study regional variation of a soil map unit. In M. J. Mausbach , & L. P. Wilding (Eds.), Spatial variabilities of soils and landforms Soil. Science Society of America special publication (Vol. 28, pp. 199–212). Madison : Wisconsin, SSSA.
- Sisák, I. , & Bámer, B. (2008). Hozzászólás Szabó, Pásztor és Bakacsi “Egy országos, átnézetes, térbeli talajinformációs rendszer kiépítésének igénye, lehetőségei és lépései” című cikkéhez. Agrokémia és Talajtan , 57 (2), 347–354. doi: 10.1556/Agrokem.57.2008.2.9
- Stefanovits, P. (1992). Talajtan . Budapest : Mezőgazdasági Kiadó.
- Szabó, J. , Pásztor, L. , & Bakacsi, Z. (2005). Egy országos, átnézetes, térbeli talajinformációs rendszer kiépítésének igénye, lehetőségei és lépései. Agrokémia és Talajtan , 54 , 41–58. doi: 10.1556/Agrokem.54.2005.1-2.4
- Szász, G. (2005). Az éghajlat változékonysága és a szántóföldi növények termésingadozása. AGRO-21 Füzetek , 38 , 59–77.
- Szatmári, G. , & Barta, K. (2013). Csernozjom talajok szervesanyag-tartalmának digitális talajtérképezése erózióval veszélyeztetett mezőföldi területen. Agrokémia és Talajtan , 62 (1), 47–60. doi: 10.1556/Agrokem.62.2013.1.4
- Thompson, J. A. , Bell, J. C. , & Butler, C. A. (1997). Quantitative soil–landscape modeling for estimating the areal extent of hydromorphic soils. Soil Science Society of America Journal , 61 , 971–980. doi: 10.2136/sssaj1997.03615995006100030037x
- Tóth, G. (2001). Soil productivity assessment method for integrated land evaluation of Hungarian croplands. Acta Agronomy Hungarian , 49 ( 2 ), 151–160.
- Tóth, B. (2010). Talajok víztartó képességét becslő módszerek. Agrokémia és Talajtan , 59 , 379–398. doi: 10.1556/Agrokem.59.2010.2.14
- Tóth, B. , Makó, A. , Guadagnini, A. , & Tóth, G. (2012). Water retention of salt affected soils: Quantitative estimation using soil survey information. Arid Land Research and Management , 26 , 103–121. doi: 10.1080/15324982.2012.657025
- Tóth, G. , & Máté, F. (2006). Megjegyzések egy országos, átnézetes, térbeli talajinformációs rendszer kiépítéséhez. Agrokémia és Talajtan , 55 , 473–478. doi: 10.1556/Agrokem.55.2006.2.13
- Van Diepen, C. A. , Van Keulen, H. , Wol, L. J. , & Berkhout, J. A. A. (1991). Land evaluation: From intuition to quantification. In B. A. Stewart (Ed.), Advances in Soil Science (pp. 139–204). New York : Springer.
- Varga-Haszonits, Z. , & Varga, Z. (2005). Nyugat-Magyarország éghajlati viszonyai és a kukorica. “AGRO-21” Füzetek , 43 , 71–79.
- Várallyay, G. (1989). Mapping of hydrophysical properties and moisture regime of soils. Agrokémia és Talajtan , 38 , 800–817.
- Várallyay, G. (2012). Talajtérképezés, talajtani adatbázisok. Agrokémia és Talajtan , 61 (Supplementum), 249–263. Retrieved from http://www.aton.hu/documents/10156/c4e78c6b-a2bf-4441-b367-39e2275d83ce
- Wagenet, R. J. , & Bouma, J. (1993). Operational methods to characterize soil behavior in space and time. Geoderma , 60 , 1–4. doi: 10.1016/0016-7061(93)90014-C
- Warrick, A. , & Nielsen, D. R. (1980). Spatial variability of soil physical properties in the field. In D. Hillel (Ed.), Applications of Soil Physics (pp. 319–324). New York : USA, Academic Press.
- Webster, R. (1985). Quantitative spatial analysis of soils in the field. Advances in Soil Science , 3 , 1–70.