
 ?Mathematical formulae have been encoded as MathML and are displayed in this HTML version using MathJax in order to improve their display. Uncheck the box to turn MathJax off. This feature requires Javascript. Click on a formula to zoom.
ABSTRACT
Mobilities that take place in coastal tourist regions are not regular in time nor in space, since the arrival of tourists follows a distinctly seasonal pattern. A key agent in the mobility sector, such as the public transport, is directly affected by these alterations. This article aims at analysing this phenomenon from a geographical perspective, by means of the use of big (geo)data generated by travel cards that monitor the demand for interurban public transport in the region of Camp de Tarragona, in south Catalonia. The maps presented in this article constitute a first attempt to appraise the impact of seasonality of tourist activities on public transport demand in coastal tourist regions. They allow detailing large spatiotemporal fluctuations in the use of public transport between winter and summer periods, and also significant differences in daily time slots between both periods. The results are from interest to understand the mobilities in tourist regions and for agents involved in public transport provision and tourism management.
1. Introduction
The increase of tourist activities in a given area not only contributes to the economic growth but also determines how activity and population are distributed across the region. Tourism exerts a direct impact on urban expansion, creating new towns, expanding existing ones and restructuring metropolitan dynamics (CitationAnton Clavé, 2012). The capacity of the tourist sector to structure people’s movements within a given territory has already been amply demonstrated. Along these lines, researchers have focused their attention on transport within cities that receive thousands of visitors every year (CitationAlbalate & Bel, 2010; CitationLe-Klähn, Gerike, & Michael Hall, 2014; CitationThompson & Schofield, 2007). They have, however, paid much less attention to the impact that the tourism sector has on mobility in wider coastal regions (CitationGutiérrez & Miravet, 2016b; CitationLe-Klähn & Hall, 2015). In such areas, it is necessary to consider the extent to which functional relationship patterns are shaped by the seasonal nature of tourist activity. When analysing coastal destinations, one may observe seasonal fluctuations in the number and frequency of trips made. The peak in the number of visitors received and temporary jobs created during the summer high season starkly contrasts with the situation in winter, when the demand for tourist services plummets. As a result, it becomes necessary to adjust the supply according to monthly changes in the number of visitors.
Surveys and other traditional data gathering methods such as travel diaries do not provide appropriate information to uncover these spatiotemporal fluctuations. As highlighted by CitationBagchi and White (2005), surveys are associated with a diverse range of problems and contain bias. For instance, surveys provide a fixed photograph taken at a certain moment in time. In the case of coastal regions, where the arrival of tourists is a dynamic phenomenon that continuously varies throughout the year and even during daily time slots, this fixed snapshot constitutes a major challenge. Moreover, surveys on mobility only focus on the residents and tend to ignore the visitors themselves. On the contrary, advances in location-aware technologies have brought new opportunities for developing studies on human mobility in general and on tourists’ spatiotemporal behaviour in particular (CitationRaun, Ahas, & Tiru, 2016; CitationShoval & Ahas, 2016). Among many sources of geolocated information, such as GPS systems or mobile phone data, the use of big geodata generated by travel cards is one of the most powerful for analysing the spatial, temporal, compositional, dynamic and social dimensions of tourist regions. Hence, travel cards are not only useful for monitoring demand and allocating payments among different public transport operators, but also for research purposes (CitationBagchi & White, 2005; CitationPelletier, Trépanier, & Morency, 2011). In contrast to surveys, travel card data are flexible and can be tailored to the precise period of interest for the query in question. Moreover, travel card data include trips of both residents and tourists, who use public transport for different reasons. As a consequence, travel card data are a valid source of information for analysing the seasonality of mobility and the spatiotemporal fluctuations between daily time slots in the demand for public transport.
Many research projects have focused their attention on producing maps related to the supply of public transport. These works have examined how to make transport more readily comprehensible to users (CitationAvelar, 2008; CitationMorrison, 1996) and have sought to assess accessibility from a wide range of perspectives (CitationAchuthan, Titheridge, & Mackett, 2010; CitationDrew & Rowe, 2010; CitationHorner & Downs, 2014). The availability of appropriate data obtained from travel cards has contributed to the generation of specialised cartography highlighting such phenomena as demand flows, the use of public transport stops, the detection of tourists travelling with public transport, or even the influence of the weather on the way in which passengers use public transport (CitationCorcoran & Tao, 2017; CitationMunizaga & Palma, 2012; CitationTao, Rohde, & Corcoran, 2014). Nevertheless, very few studies have tackled seasonal patterns related to transport in tourist regions (CitationAntoniou & Tyrinopoulos, 2013). In this regard, the objective of this article is to test the potential of the big geodata generated by travel cards for producing maps that size and characterise the seasonal demand for public transport in a coastal tourist region. The resulting maps (Main Map) showcase large spatiotemporal fluctuations in the use of public transport between winter and summer periods, as well as remarkable differences between daily time slots. These types of maps are relatively rare to find in the existing literature. Prior to the present study, CitationDomènech and Gutiérrez (2017) created maps addressing tourist accessibility to public transport in coastal destinations, and CitationGutiérrez and Miravet (2016a) attempted to cartographically differentiate the demand for public transport between the high and the low seasons.
2. Territorial context
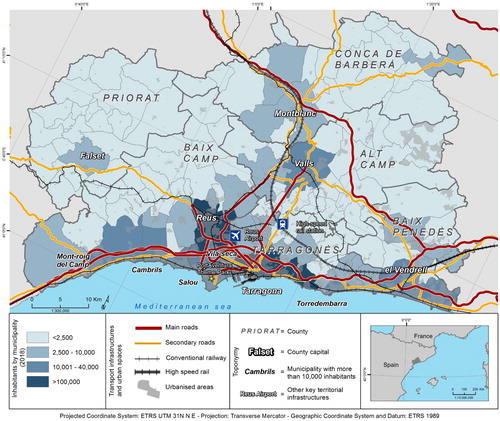
The data used in this study has been generated in Camp de Tarragona (see ), an area with a population of 617,504 in 2018Footnote1 that is considered the second most important metropolitan area in Catalonia (CitationSegarra et al., 2007). The strategic situation of this region stems from the fact that it is at the nexus of two major communication axes: the Mediterranean axis and the River Ebro axis, which facilitates communications with Madrid and the north of Spain. The economic base of the area is mainly built upon industrial activity, particularly linked to the petro-chemical sector, and the tourism sector. This economic composition has led to an uneven spatial distribution of economic activity and population, most of which is concentrated along the coast. The result is a high intensity of land use within and around the area’s two main cities, Tarragona and Reus, which have populations of over 130,000 and 100,000, respectively. The main transport infrastructures (airport, port, highways and railways) have also been concentrated around these two cities. Close to Tarragona and Reus, there are also three coastal towns whose populations exceed 20,000: Cambrils, Vila-seca and Salou, where tourism is the most important sector of activity. These three municipalities account for 77.4% of the total hotel capacity in Camp de Tarragona.Footnote2 According to data provided by the Tourism Observatory of Catalonia,Footnote3 these three municipalities received almost 3 M tourists in 2018, which translated to more than 10.5 M overnight stays in regulated accommodation. Furthermore, in 1995 the municipalities of Vila-seca and Salou saw the installation of one of the largest theme parks in Europe: PortAventura. Its presence has also boosted tourism in the area and characterises the territorial dynamics with an attraction of more than 3.5 M visitors per year (CitationAnton Clavé, 2010).
Figure 1. Camp de Tarragona territorial context. Own elaboration.
3. Data
The data used in this article were generated by travel cards that were validated on board Camp de Tarragona interurban bus services, the main mode of public transport used to interconnect the cities and towns in the Camp de Tarragona area. These interurban bus services correspond to the public transport services managed by Camp de Tarragona’s territorial authority of mobility. Once a passenger validates a travel card for a particular trip, the validating machine located on every bus keeps the data and sends them to the fare-managing system of the integrated transport network, SIGIT (from the acronym in Catalan: Sistema de Gestió de la Integració Tarifaria). SIGIT stores information regarding the bus stop where the user boarded the vehicle with its corresponding geolocation, the bus line, the type of transport ticket and the exact time at which the passenger boarded the vehicle.Footnote4
The reported information has some limitations that must be considered. Firstly, the amount of available information is limited to the physical trip; there are no data available relating to the social characteristics or the economic profile of the passenger (CitationGutiérrez & Miravet, 2016a; CitationPelletier et al., 2011). Secondly, the data are restricted to passenger trips on buses; other modes of transport, such as the use of private cars, are excluded. Thirdly, there is no information about the bus stop where the user gets off; it is, therefore, not possible to directly build origin-destination matrices (CitationTrépanier, Morency, & Agard, 2009) and estimations are needed (CitationTrépanier, Tranchant, & Chapleau, 2007).
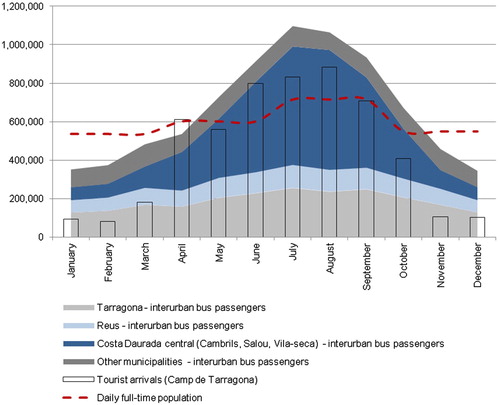
Despite all these limitations, that are common among the studies based on mining travel card data (CitationPelletier et al., 2011), the mining of the SIGIT database has enabled us to produce accurate maps showing the impact of the seasonality of tourism, as well as spatiotemporal variations between daily time slots on the demand for mobility within the coastal area of Camp de Tarragona. Given the objective of this article, it was necessary to choose representative time periods for the high and low seasons. In this regard, an exploratory analysis of the travel card data was developed, and a subsequent extraction was completed to process the data and carry out the mapping. In 2017, a total of 8,002,352 interurban bus passengers were counted in Camp de Tarragona. As shown in , the use of public transport for interurban bus trips is anything but equal throughout the year. On the contrary, interurban bus demand tends to be concentrated in the summer season, when the arrival of tourists is more prominent and the daily seasonal population increases considerably. Since the data show July as having the highest number of passengers and January as having the lowest, these two months were selected as representatives of the high and low tourist season, respectively.
Figure 2. Number of interurban bus passengers and tourist arrivals per month in 2017 and number of daily full-time population per quarter in 2017. Source: Own elaboration from data provided by the territorial authority for the mobility of Camp de Tarragona, the Catalan Institute of Statistics and the Tourism Observatory of Catalonia.
4. Methods
Interurban bus lines and bus stops had to be georeferenced in order to carry out a spatial analysis of the data obtained from the register. To this end, a new point layer map representing bus stops belonging to the Camp de Tarragona area and a new line layer map representing the integrated interurban bus services were created by projecting the x and y coordinates of each variable using the geographic coordinate system GCS_WGS_1984. The point layer map contained a total of 946 bus stops whereas the line layer map showed a total of 118 bus lines. Once the bus stops and integrated bus services had been georeferenced, the number of passengers using each interurban bus stop and line for July were compared with those for January to show seasonal oscillations in the demand for public transport resulting from differences in tourist flows between the high and low seasons. To verify that the increase in mobility in summer takes place in areas where the tourist activity tends to cluster, Pearson’s correlation coefficient and the bivariate Moran’s indicator were calculated between the number of passengers in the months of reference (January and July) and the supply of tourist accommodationFootnote5 and the daily full-time populationFootnote6 in the 132 municipalities of the Camp de Tarragona area. To be precise, the volume and type of regulated tourist accommodations were considered, as well as their capacity. Furthermore, the daily full time estimated population during the months of winter and summer was included in the calculations as well.
Finally, the bus stops were also used to compare spatiotemporal fluctuations between time slots in winter and summer. First, the number of passengers per time slot and interurban bus stop were calculated (2 am to 7 am; 7 am to 11 am; 11 am to 3 pm; 3 pm to 7 pm; 7 pm to 11 pm; 11 pm to 2 pm). Then, a kernel density estimation (KDE) was implemented by means of the heatmap plugin of the QGIS software 2.8.2. The results of these calculations are density maps that allow the identification of areas with a high clusterisation of passengers. Mathematically, KDE is defined aswhere f(x, y) is the density estimate at the location (x, y), n is the number of observations, h is the bandwidth or kernel size, K is the kernel function and di is the distance between the location (x, y) and the location of the ith observation. A bandwidth of 1 km and a grid cell size of 100 m were defined.
5. Results
5.1. Demand for interurban bus lines
compares the number of passengers in 2018 using the twelve most important interurban bus lines during the high tourist period (July) with use in the low season (January). It is apparent that the agglomeration of activity and population around the central coastal area determines the demand for bus services. The preponderance of mobility within the main urban area has already been identified by CitationAlberich (2008), although his work was limited to the mobility of residents and, as a consequence, had neglected tourist trips.
Figure 3. Number of passengers using the twelve most important interurban bus lines in January and July 2018. Source: Own elaboration from data provided by authority for the territorial mobility of Camp de Tarragona.
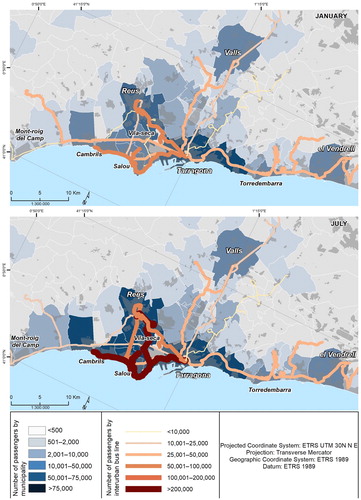
The most outstanding result obtained from is the evidence of the impact of seasonality on certain bus services. Significant differences between summer and winter patterns are apparent for bus services connecting tourist destinations in the central coastal area as well as for the bus lines connecting these same coastal towns to Tarragona and Reus. The five main lines operating in the central coastal area registered 20% of the total number of trips made in the month of January 2018, compared to 70% in the month of July. The Tarragona-Salou-Cambrils line, which was the bus service with the greatest demand in 2018, had 378,089 passengers during July, but only 57,423 in January. The second most popular line was Cambrils-Reus, for which the number of passengers increased from 5110 in the low season to 250,680 in the high season. On the Reus-Salou line, passenger numbers increased from 18,051 in the low season to 78,299 in the high season. The number of passengers using the night service La Pineda-Salou-Cambrils shot up from just 159 in January to 24,709 in July.
5.2. Demand for interurban bus stops
With respect to the use of bus stops, similar conclusions may be drawn from . There were only three bus stops with more than 20,000 users in January: the bus station of Tarragona and the two main bus stops of Reus. In July, the number was eleven. Seven of these eleven bus stops belonged to the municipalities of Cambrils, Salou and Vila-seca.
Figure 4. Number of passengers per interurban bus stop in January and July 2018. Source: Own elaboration from data provided by authority for the territorial mobility of Camp de Tarragona.
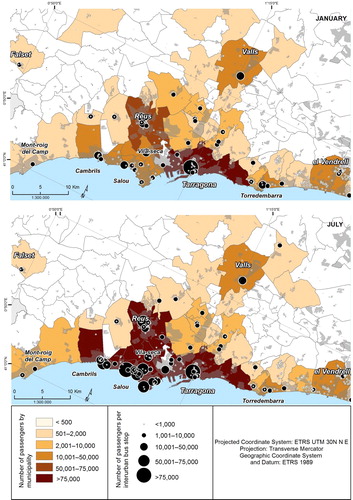
The total percentage variation between January and July for all of Camp de Tarragona was 171%. The growth in demand for interurban public transport primarily concentrated on the bus stops located in the three central coastal towns. In fact, the contribution of the municipalities of Cambrils, Salou and Vila-seca to the total growth in users was as high as 75.2%. However, the impact of tourism also spilled over from Tarragona and Reus, which are also visited by tourists using public transport and which also contribute residents that visit coastal destinations for both work and leisure purposes. If the contributions of Tarragona and Reus, which represented 23.5%, are added, the growth in use related to the remaining municipalities was only 1.3%.
The results of the Pearson’s statistical correlation coefficients and the Moran's bivariate spatial autocorrelation coefficients, presented in , showcase that the increase in public transport passengers is highly associated with the presence of hotel accommodations and the seasonal population in the summer quarter.
Table 1. Correlation coefficients (Pearson’s R and bivariate Moran’s I) between the volume of passengers in January and July 2018 and variables related to the tourist sector by municipalities of the Camp de Tarragona area.
However, the increase in the number of passengers in highly touristic municipalities is not proportional to the increase in the number of seasonal population: it is clearly much higher. In Cambrils, Salou and Vila-seca, the percentage variation in the volume of passengers in July with respect to January was as high as 683%; meanwhile, the increase in the daily full-time population is 111% (see ). This may be a consequence of more intensive use of public transport by tourists in the area.
Table 2. Percentage variation between the winter and summer population, and the volume of passengers in January and July 2018 in the three most touristic municipalities of the Camp de Tarragona area.
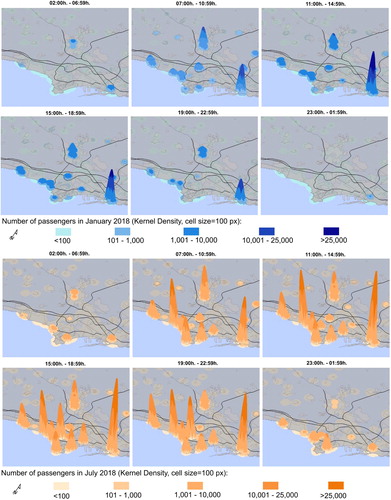
5.3. Spatiotemporal fluctuations between time slots in summer and winter
The demand for interurban public transport not only varied between seasons but also throughout the hours of the day for both periods. KDE afforded 3D maps of the number of passengers per time slots represented by 100-meter cells in January and July 2018. These representations point up the challenges for the supply of sustainable modes of transport, as significant fluctuations in space and time are produced along daily periods in summer and winter. On the one hand, , which represents the KDE for both January and July, reveals that in the winter month, there is a clear association between interurban public transport demand and urban hierarchies, with the most populated cities being the ones that generate a higher number of trips. On the other hand, the maps for July showcase how the urban hierarchies are altered as a result of tourism’s influence on the labour, residential and recreational markets (CitationGutiérrez & Miravet, 2016a).
Figure 5. 3D kernel density estimation map per time slots in July and January 2018. Source: Own elaboration from data provided by authority for the territorial mobility of Camp de Tarragona.
6. Discussion and conclusions
The maps produced in this article Main Map illustrate the potential of the tourist industry for transforming the functional relationships within a given territory by boosting the demand for public transport to a point at which some coastal towns become the most important generators of trips. These results are consistent with the view that tourist activity plays a key role in shaping territories (CitationAnton Clavé, 2012; CitationAnton Clavé & Wilson, 2017) and remodelling urban hierarchies (CitationGutiérrez & Miravet, 2016a). The results of this study also add new evidences to the literature in the field of the multiple implications of tourism demand for the provision of public transport in tourist cities and regions (CitationAlbalate & Bel, 2010; CitationGössling, Hall, Peeters, & Scott, 2010; CitationGutiérrez, Miravet, Saladié, & Anton Clavé, 2019; CitationThompson & Schofield, 2007). However, to date, very few works have shed any light on the challenge of seasonality and its impact on the demand for public transport (CitationAntoniou & Tyrinopoulos, 2013). Another point that cannot be neglected is the fact that the maps revealed that the impact of seasonality was primarily concentrated within the main tourist areas, coinciding with the main hotel clusters. This finding was consistent with those of CitationGutiérrez and Miravet (2016b), who concluded that staying in a hotel makes tourists more likely to have flown to their destination and to subsequently use public transport to move around.
To the best of the authors’ knowledge, this study is the first attempt to generate maps capable of capturing seasonal fluctuations in the demand for public transport resulting from the asymmetrical distribution of activity associated with the habitual seasonality of the tourist industry. The spatial analysis undertaken by mining travel card data shows the extent to which the use of public transport within a given territory can be modified by the dynamics of tourist mobility. Our maps highlight the fact that trips made by tourists may clearly outnumber those made by residents during certain periods of the year and that this is most likely to occur during the high season for tourism. The maps also reveal the oscillation of spatiotemporal flows in different time stamps. Overall, the maps demonstrate that the centres of gravity of the metropolitan area are switched in summer toward the areas where tourist activity tends to cluster.
This work highlights the relevance of mixing both the temporal and spatial dimensions of tourist mobility in order to properly examine the impact of seasonality. This combined approach is only possible if suitable data are available to enable researchers to analyse how trip flows vary from one time of year to another. In this sense, travel cards offer a valid source of information. The utility of the resulting maps lies in the fact that they can open the door to future studies that may be used to appraise the wide range of challenges facing those providing public transport at coastal tourist destinations. Future research should address issues such as the identification of user-profiles and the relationship at the microlevel between land use and the activities around the bus stops. The combination of travel card data with person trip survey data (CitationKusakabe & Asakura, 2017) could also help in providing interesting insights and thorough knowledge about the purpose and motivations of the trips. Meanwhile, the estimation of the stops where the users exit the bus is key information (CitationTrépanier et al., 2007) that in further research might be obtained by implementing algorithms. These new lines of research may help consolidate a competitive public transport system in tourist regions and shift mobility choices towards sustainable transport means.
Software
The georeferencing of bus lines and bus stops was carried out using Esri ArcGIS® 10.3 software and based on their coordinates. The statistical data were processed with the SIGIT and subsequently treated with R software and Microsoft Excel. Esri ArcGIS 10.3 was used to generate the final map.
Map_page.pdf
Download PDF (599.4 KB)Disclosure statement
No potential conflict of interest was reported by the authors.
Additional information
Funding
Notes
1 Data provided by Idescat (Institute of Statistics of Catalonia) www.idescat.cat.
2 Information provided by Idescat: www.idescat.cat.
3 Data obtained from the Tourism Open Knowledge (TOK) of the Tourism Observatory of Catalonia: https://www.tok.pct-turisme.cat.
4 A collaboration agreement signed between the Camp de Tarragona’s territorial authority of mobility and the Rovira i Virgili University allowed the use of the dataset generated by the SIGIT for research purposes.
5 The volume, capacity and type of regulated accommodations (agritourism, camping sites and hotels) is provided by the Catalan Institute of Statistics (https://www.idescat.cat).
6 The Catalan Institute of Statistics provides estimates of the daily seasonal population that each Catalan municipality supports on an annual and quarterly average. From this data, it is possible to calculate the daily full-time population during the quarters of winter and summer by municipality (https://www.idescat.cat/pub/?id=epe).
References
- Achuthan, K., Titheridge, H., & Mackett, R. L. (2010). Mapping accessibility differences for the whole journey and for socially excluded groups of people. Journal of Maps, 6(1), 220–229. doi: 10.4113/jom.2010.1077
- Albalate, D., & Bel, G. (2010). Tourism and urban public transport: Holding demand pressure under supply constraints. Tourism Management, 31(3), 425–433. doi: 10.1016/j.tourman.2009.04.011
- Alberich, J. (2008). La mobilitat quotidiana al Camp de Tarragona. Papers, 48, 46–63.
- Anton Clavé, S. (2010). Leisure parks and destination redevelopment: The case of PortAventura, Catalonia. Journal of Policy Research in Tourism, Leisure & Events, 2(1), 66–78. doi: 10.1080/19407960903542326
- Anton Clavé, S. (2012). Rethinking mass tourism; space and place. In J. Wilson (Ed.), The Routledge handbook of tourism geographies: New perspectives on space, place and tourism (pp. 217–224). London: Routledge.
- Anton Clavé, S., & Wilson, J. (2017). The evolution of coastal tourism destinations: A path plasticity perspective on tourism urbanisation. Journal of Sustainable Tourism, 25(1), 96–112. doi: 10.1080/09669582.2016.1177063
- Antoniou, C., & Tyrinopoulos, Y. (2013). Factors affecting public transport use in touristic areas. International Journal of Transportation, 1(1), 91–112. doi: 10.14257/ijt.2013.1.1.06
- Avelar, S. (2008). Visualizing public transport networks: An experiment in Zurich. Journal of Maps, 4(1), 134–150. doi: 10.4113/jom.2008.1007
- Bagchi, M., & White, P. R. (2005). The potential of public transport smart card data. Transport Policy, 12(5), 464–474. doi: 10.1016/j.tranpol.2005.06.008
- Corcoran, J., & Tao, S. (2017). Mapping spatial patterns of bus usage under varying local temperature conditions. Journal of Maps, 13(1), 74–81. doi: 10.1080/17445647.2017.1378933
- Domènech, A., & Gutiérrez, A. (2017). A GIS-based evaluation of the effectiveness and spatial coverage of public transport networks in tourist destinations. ISPRS International Journal of Geo-Information, 6, 83. doi: 10.3390/ijgi6030083
- Drew, K., & Rowe, M. (2010). Applying accessibility measures to assess a transport intervention strategy: A case study of Bromsgrove. Journal of Maps, 6(1), 181–191. doi: 10.4113/jom.2010.1069
- Gössling, S., Hall, C. M., Peeters, P., & Scott, D. (2010). The future of tourism: Can tourism growth and climate policy be reconciled? A Mitigation Perspective. Tourism Recreation Research, 35(2), 119–130. doi: 10.1080/02508281.2010.11081628
- Gutiérrez, A., & Miravet, D. (2016a). Estacionalidad turística y dinámicas metropolitanas: Un análisis a partir de la movilidad en transporte público en el Camp de Tarragona. Revista de Geografía Norte Grande, 65, 65–89. doi: 10.4067/S0718-34022016000300004
- Gutiérrez, A., & Miravet, D. (2016b). The determinants of tourist use of public transport at the destination. Sustainability, 8(9), 908. doi: 10.3390/su8090908
- Gutiérrez, A., Miravet, D., Saladié, Ò, & Anton Clavé, S. (2019). Transport mode choice by tourists transferring from a peripheral high-Speed Rail station to their destinations: Empirical evidence from Costa Daurada. Sustainability, 11(11), 3200. doi: 10.3390/su11113200
- Horner, M. W., & Downs, J. (2014). Integrating people and place: A density-based measure for assessing accessibility to opportunities. Journal of Transport and Land Use, 7(2), 23. doi: 10.5198/jtlu.v7i2.417
- Kusakabe, T., & Asakura, Y. (2017). Combination of smart card data with person trip survey data. In F. Kurauchi, & J. D. Schmöcker (Eds.), Public transport and planning with smart card data (pp. 73–92). Boca Ratón: CRC Press
- Le-Klähn, D.-T., & Hall, C. M. (2015). Tourist use of public transport at destinations – a review. Current Issues in Tourism, 18(8), 785–803. doi: 10.1080/13683500.2014.948812
- Le-Klähn, D. T., Gerike, R., & Michael Hall, C. (2014). Visitor users vs. non-users of public transport: The case of Munich, Germany. Journal of Destination Marketing and Management, 3(3), 152–161. doi: 10.1016/j.jdmm.2013.12.005
- Morrison, A. (1996). Public transport maps in Western European cities. The Cartographic Journal, 33(2), 93–110. doi: 10.1179/caj.1996.33.2.93
- Munizaga, M. A., & Palma, C. (2012). Estimation of a disaggregate multimodal public transport origin-destination matrix from passive smartcard data from Santiago, Chile. Transportation Research Part C: Emerging Technologies, 24, 9–18. doi: 10.1016/j.trc.2012.01.007
- Pelletier, M. P., Trépanier, M., & Morency, C. (2011). Smart card data use in public transit: A literature review. Transportation Research Part C: Emerging Technologies, 19(4), 557–568. doi: 10.1016/j.trc.2010.12.003
- Raun, J., Ahas, R., & Tiru, M. (2016). Measuring tourism destinations using mobile tracking data. Tourism Management, 57, 202–212. doi: 10.1016/j.tourman.2016.06.006
- Segarra, A., Margalef, J., Teruel, M., Duro, J. A., Pinyol, J. M., & Miravet, D. (2007). El Camp de Tarragona: realitat actual i propostes per a la planificació estratègica (1st ed.). Tarragona: Publicacions URV.
- Shoval, N., & Ahas, R. (2016). The use of tracking technologies in tourism research: The first decade. Tourism Geographies, 18(5), 587–606. doi: 10.1080/14616688.2016.1214977
- Tao, S., Rohde, D., & Corcoran, J. (2014). Examining the spatial – temporal dynamics of bus passenger travel behaviour using smart card data and the flow-comap. Journal of Transport Geography, 41, 21–36. doi: 10.1016/j.jtrangeo.2014.08.006
- Thompson, K., & Schofield, P. (2007). An investigation of the relationship between public transport performance and destination satisfaction. Journal of Transport Geography, 15(2), 136–144. doi: 10.1016/j.jtrangeo.2006.11.004
- Trépanier, M., Morency, C., & Agard, B. (2009). Calculation of transit performance measures using smartcard data. Journal of Public Transportation, 12(1), 79–96. doi: 10.5038/2375-0901.12.1.5
- Trépanier, M., Tranchant, N., & Chapleau, R. (2007). Individual trip destination estimation in a transit smart card automated fare collection system. Journal of Intelligent Transportation Systems, 11(1), 1–14. doi: 10.1080/15472450601122256