
ABSTRACT
We present a detailed snow avalanche susceptibility map at scale 1:20,000 of the Circo de Gredos in the Sierra de Gredos (Iberian Central System, Spain). This cirque-shaped landscape is one of the most popular spots for winter sports in the region. However, no snow avalanche activity assessment has been conducted to date. We have, therefore, produced a snow avalanche susceptibility map based on aerial and satellite imagery, newspaper reviews and field work, including avalanche features recognition and interviews with frequent backcountry users. We extracted the spatial distribution of necessary and enhancer factors for triggering slab, wet and loose snow avalanches from a digital elevation model. Finally, calculations to evaluate each snow avalanche type susceptibility were performed using a Geographical Information System. By combining our map collection, we concluded that most of the area in the Circo de Gredos is highly susceptible to snow avalanches, especially slab and wet snow types.
1. Introduction
Snow avalanches consist of rapidly descending snow masses on steep slopes (CitationSchweizer, Jamieson, & Schneebeli, 2003). They contribute to alpine landscape dynamics by increasing geomorphic processes, affecting the forest, and also endanger the human population and infrastructures. Therefore, they are one of the most significant processes in mountain environments (CitationGarcía-Hernández et al., 2017; CitationSchweizer, Bartelt, & van Herwijnen, 2015).
Snow avalanches are a traditional preoccupation in European mountain regions. Therefore, numerous studies following diverse methodologies have addressed the topic, especially in the French and Swiss Alps. So far, significant advances in automated mapping have allowed to assess snow avalanche hazard over large areas by extracting topographic parametres from digital elevation models, which strongly facilitates risk management (CitationBarbolini, Pagliardi, Ferro, & Corradeghini 2011; CitationBühler et al., 2013, Citation2018).
Although in Spain snow avalanches do not present a significant risk to the population, the rising popularity of winter sports in recent years has led to an increase of social exposure to snow avalanches and thus a growing number of victims due to the direct action of this phenomenon (CitationMuñoz, 2012).
The majority of snow avalanche activity in Spain takes place in the northern mountain ranges, such as the Pyrenees (e.g. CitationChueca & Julián, 2004, Citation2010; CitationChueca, Julián, & Montañés, 2014; CitationFurdada, 1996; CitationFurdada & Vilaplana, 1998; CitationJulián & Chueca, 1999; CitationJulián et al., 2000) and Cantabrian ranges (e.g. CitationBeato Bergua, Poblete Piedrabuena, & Marino Alfonso, 2018; CitationGonzález, Vega, Villar, & Gutiérrez, 2010; CitationVada, Frochoso, & Vilaplana, 2012). However, mountain ranges in the central region, such as the Iberian Central System, also present topographic and climatological conditions suitable for the occurrence of snow avalanche. In addition, their proximity to large cities facilitates the access of a large number of visitors during the winter season. Despite of circumstances, there are very few studies availables assessing the snow avalanche activity in the mountains of this Spanish region (e.g. CitationFernández-Cañadas, Palomo, & Pantoja, 2015).
Our work here focuses on the Circo de Gredos (CdG) within the Sierra de Gredos (Iberian Central System). CdG is an alpine massif ideal for winter sports, such as ice climbing, mountaineering and backcountry skiing. Furthermore, this spot is located at ∼170 km from Madrid, one of the largest city in Spain. According to the Sierra de Gredos Regional Park administration, CdG received ∼20,000 visitors in 2007 (CitationHidalgo-Moran, 2011). However, this number corresponds exclusively to the visitors of the information center. A broad estimation, based on parking and mountain shelter data, suggests visitor annual numbers closer to ∼90,000, although the number of backcountry users during the winter months must be significantly lower.
Our aim in this paper is to contribute to the reduction of snow avalanche risk for frequent backcountry users of the CdG by producing a collection of snow avalanche susceptibility maps of the area, based on an analysis of snow avalanche triggering factors, newspaper reports, personal interviews and exhaustive fieldwork. This map collection updates and completes previous data used as the basis for this new interpretation (CitationSoteres, Pedraza, & Carrasco, 2016).
2. Regional setting
The CdG is a glacial cirque morphology massif located in the Sierra de Gredos in the Iberian Central System (). It covers an area of ∼2.5 km2 within elevations between ∼2000 m asl and 2592 m asl, corresponding to the maximum altitude of the Iberian Central System in Pico Almanzor.
Figure 1. Geographic and geomorphologic context of Circo de Gredos. (A) Location of Sierra de Gredos Regional Park in the Iberian Peninsula. (B) Simplified sketch of glacial morphology of the Circo de Gredos area. (C) Detailed Digital Elevation Model of the Circo de Gredos morpho-topography and sites of interest.
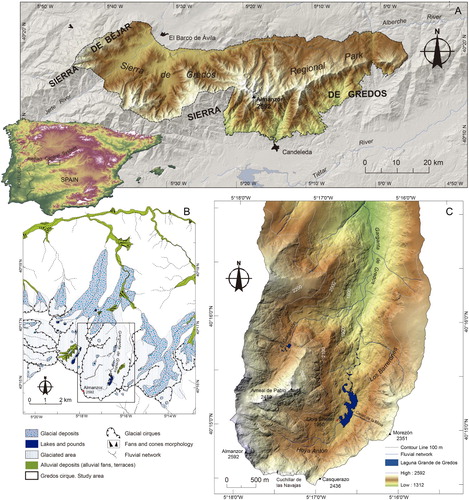
The Iberian Central System is an intraplate alpine pop-up structure range, located in the central sector of the Iberian Peninsula. The main lithology corresponds to granitoids (monzogranites, granodiorites) and isolated migmatite outcrops, formed during the Hercynian or Variscan cycle. Surficial Quaternary deposits are also widely represented in the region (CitationRuiz & Gabaldón, 1981).
During the last glaciation, significant glaciers formed in the CdG area (CitationHuguet del Villar, 1915; CitationMartínez de Pisón & Muñoz Jiménez, 1972; CitationObermaier & Carandell, 1916; CitationPedraza & Fernández, 1981; CitationSchmieder, 1915; CitationVidal Box, 1936), leading to the largest glacial systems in central Spain (CitationCarrasco, Pedraza, Domínguez-Villar, Villa, & Willenbring, 2013; CitationCarrasco, Pedraza, Domínguez-Villar, Willenbring, & Villa, 2015; CitationPalacios, de Marcos, & Vázquez-Selem, 2011, Citation2012; CitationPedraza, Carrasco, Domínguez-Villar, & Villa, 2013). So, the present landscape is dominated by typical glacial features (), including U-shaped valleys, moraine ridges, horns, arêtes, ice-sculpted bedrock and erratic boulders. Nevertheless, the current morphogenetic context is driven by periglacial and torrential processes (CitationAcaso, Ruiz-Zapata, Pedraza, & Centeno, 1985).
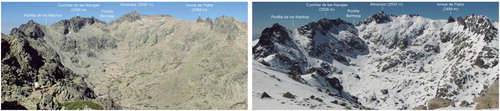
Figure 2. Photographs of the Circo de Gredos in summer (left) and winter (right). The photo on the left shows the location of the principal morphological couloirs and peaks referred to in the text.
The climate is Mediterranean type with a very strong continental effect, with very dry summers and frequent precipitation during the rest of the year. Mean annual temperatures range from 15.0 to 2.5°C, with a summer maximum of 27.5°C and a winter minimum of −5.0°C. 100–120 days per year record minimum temperatures below 0°C. Mean annual precipitation ranges from 1400 to 1800 mm (CitationAEMET/IM, 2011). Above 2000 m asl, snow cover persists 180–300 days per year in certain orographic sectors (CitationMuñoz, Palacios, & de Marcos, 1995) ().
The CdG is characterized by a complete absence of arboreal vegetation and sporadic dense bush formations (Cytisus oromediterraneus). The alpine prairies are frequent growing on flatlands with well-developed soil and fluvial terraces.
3. Map production
To produce our map collection, we used the MTN25 topographic map series (scale 1:25,000; sheet 577-Bohoyo), aerial orthophotos (pixel size 0.25 m or 0.50 m) and a digital elevation model (DEM) obtained by LIDAR sensors (average density 0.5 points/m2) from the Centro Nacional de Información Geográfica (www.cnig.es).
We adapted the methodology used by CitationPalomo (2008) and CitationFernández-Cañadas et al. (2015), which considers the spatial distribution of ‘necessary’ and ‘enhancer’ factors which trigger snow avalanches (). Additionally, we also included most recurrent avalanche paths in the final map under very high susceptibility because the majority of them coincides with natural corridors or goulottes, which are often used as winter mountaineering routes. So, our map compiles snow avalanche susceptibility areas and run out zones.
Table 1. Description of the necessary and enhancer factors.
Where there are no necessary factors, the probability of avalanche occurrence is reduced to zero. In the CdG, we considered slope exclusively as a necessary factor because of the nature of the study area. In one hand, traditional topographic parameters used in snow avalanche hazard mapping, such as plan curvature, roughness or distance to the main ridges (CitationMaggioni & Gruber, 2003; CitationVeitinger, Purves, & Sovilla 2016), produce no significant changes in our results. On the other hands, the CdG presents no vegetation to act as a barrier or anchor the snowpack. We classified slopes on three categories according to the gradients normally assumed for triggering snow avalanches. So, we extracted areas with gradients approaching 45°, as they are required for the release of loose snow avalanches, whereas for wet and slab avalanches, slopes of 30° and 25° respectively, were identified (CitationFernández-Cañadas et al., 2015).
Enhancer factors are not required to trigger an avalanche, but they increase the probability of occurrence. In this category, we considered leeward slopes, as they are prone to develop wind slabs and a thicker snowpack. We also identified maximum and minimum insolation received by the slopes between November and April (i.e. local winter sports season). The distribution of the insolation on the slopes determines the evolution of the snowpack and, thus, their aptitude to produce snow avalanches. Finally, the lack of weather monitoring stations in the CdG precludes our understanding about snow accumulation rates in the area. However, direct observation and numerical modeling indicate that snowfall events reaching metric accumulations are very scarce in the Iberian Central System (Alonso-González et al., Citation2018; Gascón et al., Citation2015). Therefore, they are not considered as a triggering factor. Instead, we mapped the snow patches with permanence >120 days/year identified by CitationMuñoz et al. (1995). We considered these patches reflect areas with snowpack evolving to unstable profiles alternating strong and weak layers.
The extraction of the spatial distribution of the triggering factors and the calculations of the susceptibility was performed with a Geographical Information System software tool (ArcGIS 10.4) using a DEM as a primary source of data and the algorithms shown in , respectively.
Table 2. Algorithms followed to elaborate the snow avalanche susceptibility maps for each type of phenomena. Adapted from CitationFernández-Cañadas et al. (2015).
Subsequently, we checked our preliminary maps on fieldwork by identifying recurrent snow avalanche paths and snowpack conditions. Additionally, to create a database of historical snow avalanche activity, we conducted personal interviews with rangers at the Elola mountain shelter (), and frequent backcountry users including alpinists, mountain skiers and rescue teams. We also collected snow avalanche occurrence data from a comprehensive review of newspaper reports and specialized literature.
The final step of the map production was carried out on Surfer 12 software to generate a hillshade background, and Adobe Illustrator CC 2017.
4. Results
4.1. Trigger factor mapping
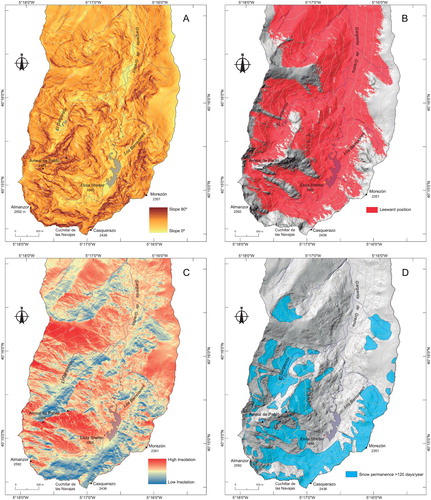
The map compilation produced slopes, leeward locations, insolation and snowpack permanence (). The slopes map ((A)) indicates that most slope gradients in the CdG range between 25° and 30°, while slopes with gradients >45° are restricted to headwall cliffs and minor glacial thresholds. The leeward areas map ((B)) shows that the majority of the surface contained below 2400 m asl is prone to present thick snowpacks and wind slabs. Only the headwalls of the most prominent peaks (e.g. Ameal de Pablo, Almazor, Cuchillar de las Navajas) received the direct influence of dominant winds, preventing high accumulation rates. Insolation map ((C)) shows that the N and NW slopes receive less insolation than S and SE slopes between November and April. Therefore, the first ones likely will develop a dry snowpack, while the second ones will present a wet snow column. Finally, the map of >120 days/year duration snow patches ((D)) shows that patches are well aligned with areas receiving minimum insolation in a leeward position, especially in the valley floor and geo-structural corridors. Therefore, snow permanence is considered as a valid indicator of snowpack thickness as most patches identified are scarcely located on slopes with gradients >30° allowing a high accumulation during the season.
Figure 3. Map of trigger factors used to study avalanches in the Circo de Gredos. (A) Slope map; (B) Leeward areas; (C) Solar radiation (April–November); (D) Areas with snow permanence more than 120 days per year (Muñoz et al., 1995).
4.2. Snow avalanche database
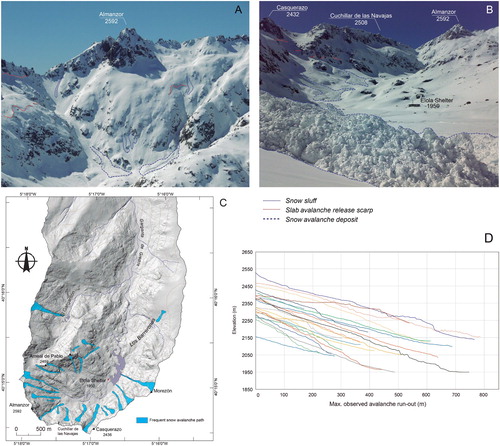
Based on direct observations, newspaper and literature reviews and personal interviews, we identified 23 frequent snow avalanche paths. The release areas are distributed within all aspects ((A,B)), at elevations between ∼2150 and ∼2550 m asl ((C)). The trajectories observed present a mean horizontal distance of ∼440 m and a mean vertical drop of ∼250 m ((D)). According to the European Avalanche Warning Services (http://www.avalanches.org) size classification, the CdG snow avalanches range in size from 1 (sluff) to 3 (large avalanche).
Figure 4. Type, location and run-out zone of observed avalanches. (A) Photo (March 2011) showing the most frequent avalanche locations in Pico Almanzor area; (B) Photo (March 2010) showing three examples of avalanches with run-out zone on the floor of the palaeoglacial cirque. (GREIM, Barco de Ávila); (C) Map showing location of observed avalanches according to data obtained from field observations, personal interviews and bibliographic references. (D) Graphic representation of maximum run-out values for the observed avalanches.
4.3. Snow avalanche susceptibility maps
We identified four susceptibility categories for each type of snow avalanche (Main Map). Very high susceptibility (shown in red on the map) is reserved for areas where all trigger factors are combined (e.g. Canal de la Mina; see (C)). High susceptibility (shown in yellow) is reserved for areas where the necessary factors and one enhancer factor are present. Moderate susceptibility (shown in green) appears where only the necessary factor is exhibited. Finally, low susceptibility areas (shown in white) are mostly found on the valley floor and flat surfaces. The frequent snow avalanche path database is also implemented over the susceptibility layer, considering it as very high susceptibility zones.
4.3.1. Slab avalanche susceptibility map
Slab avalanche susceptibility is widely represented in the CdG (). Most slopes present >30°, the minimum gradient needed to trigger this type of snow avalanche. Furthermore, the study area lies to leeward of the prevailing winds, facilitating snow accumulation and wind slab formation. This circumstances, in addition to low solar radiation, contribute developing a snowpack profile alternating strong and weak layers.
Figure 5. Slab avalanche susceptibility map of the Circo de Gredos according to values obtained from combining trigger factors, reclassified into four categories. Red: very high. Yellow: high. Green: moderate. White: low.
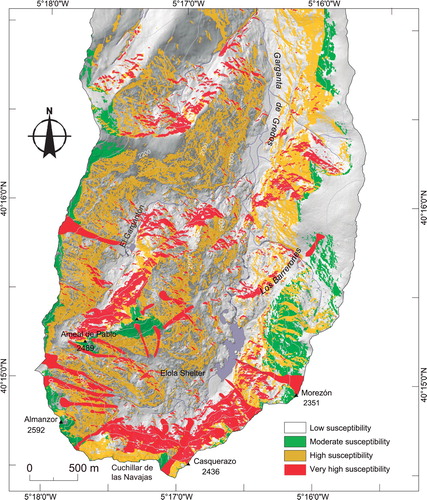
In the CdG, the N and NW slopes present very high susceptibility. Several of the most popular routes for winter sports are in this category, including the normal routes to the Pico Almanzor and Pico Casquerazo peak (see (C)), probably the most transited routes in the CdG in winter. Therefore, these areas present the highest risk for backcountry users.
The area included in the high susceptibility category covers most of the CdG, especially the S and SE slopes. Areas of moderate susceptibility are found in the highest elevations of the CdG. In this area some sections of the headwall gradient starts to decrease towards the summit plateau, reducing the presence of the necessary factor. In the other hand, highest peaks are influenced by wind and the slopes are usually very steep, restricting snow accumulation. Areas of low susceptibility are mostly found on the cirque floor where none of the trigger factors for snow avalanche release are present. Nevertheless, deposits of slab avalanches are frequently located in these areas, so they still imply certain risk (e.g. Canal de la Mina; see (C)).
4.3.2. Wet avalanche susceptibility map
Wet snow avalanches are very common in the CdG as most slopes are >25° and the snowpack receives high solar radiation during late winter and early spring (). However, very high susceptibility surfaces are confined to specific sites and frequent snow avalanche paths. Most of the CdG area presents high susceptibility, specially NW, S and E orientations, where steep slopes receive intense insolation intense during winter sport season, allowing snowpack fusion and subsequent vertical water flow, weakening the snow profile cohesion.
Figure 6. Wet snow avalanche susceptibility map of the Circo de Gredos according to values obtained from combining trigger factors, reclassified into four categories. Red: very high. Yellow: high. Green: moderate. White: low.
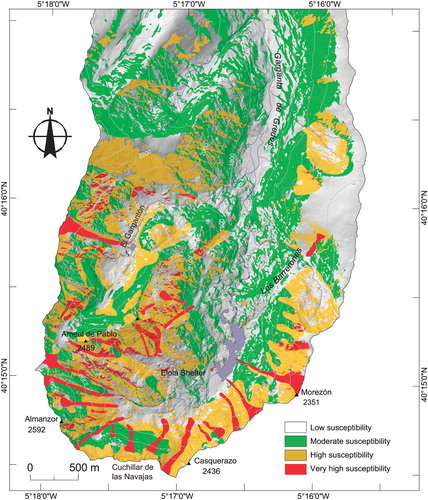
Moreover, some of the busiest routes, such as the normal northern route to Pico Casquerazo (2432 m asl), the upper section of the NW route to Pico Morezón (2389 m asl), the S face of the Cerro de los Huertos-Ameal de Pablo (2489 m asl) and the lower sector of the Pico Almanzor, are all categorized as highly susceptible (see (C)).
There are also considerable areas classified as moderately susceptible, mainly on the W slopes, particularly Los Barrerones, the lower section of the W face of Pico Morezón and Cuchillar de las Navajas (see (C)).
Finally, low susceptibility areas correspond to the cirque floor, where wet snow deposits from the largest events are often observed (see (B)), as this type of snow avalanche may be displaced over a long distance even on flat terrain, so caution is also advised for transiting this area.
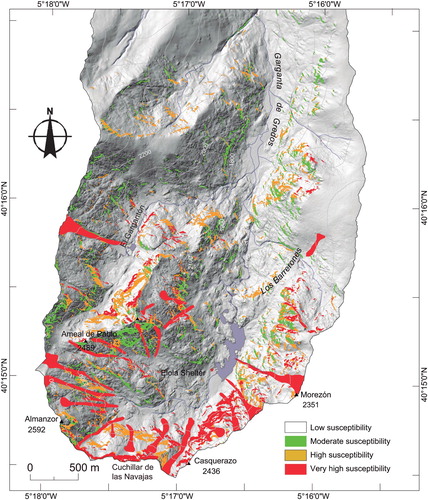
4.3.3. Loose snow avalanche susceptibility map
Loose snow avalanches are very rare in the CdG (). Trigger factors associated with this type of event occasionally appear combined on the N and NW aspects of the CdG headwall. However, local meteorological conditions facilitate the rapid transformation of the snowpack, ensuring high cohesion of the snow column and preventing the release of loose snow avalanches.
Figure 7. Loose snow avalanche susceptibility map of the Circo de Gredos according to values obtained from combining trigger factors, reclassified into four categories. Red: very high. Yellow: high. Green: moderate. White: low.
4.3.4. General snow avalanche susceptibility map
Our map collection was combined to assess the overall snow avalanche susceptibility of the CdG (Main Map). The final map shows that most of the area presents high or very high susceptibility to the phenomenon. More specifically, the N and NW slopes of the Morezón-Casquerazo-Cuchillar de las Navajas-Almanzor ridge (see Main Map) present very high susceptibility due to the combination of all trigger factors. In addition, these peaks hold some of the most popular winter routes in central Spain, with a significant number of visitors during the season. This particular area, therefore, presents the highest risk for winter backcountry users in the CdG.
On the other hand, the Gargantón area also presents high susceptibility (see Main Map). However, this site is less visited than CdG, thus the snow avalanche risk is relatively lower, although caution is advised.
Finally, most of the moderate susceptibility area coincides with the access to the Elola shelter (see Main Map), which is the CdG trail most frequently used by backcountry and other visitors. Some of the most impressive snow avalanches in the area affect this route, e.g. Canal de la Mina (see Figures 1(C) and 4). Special caution should be exercised by visitors, especially in the late season.
5. Final remarks
This paper presents a comprehensive collection of snow avalanche susceptibility maps for the CdG in the Sierra de Gredos (Iberian Central System). Our outcomes partly solve the limited knowledge of snow avalanche activity in this mountain range intensely visited during the winter season, and so contributes to reduce the risk of snow avalanche in central Spain.
By combining a mapping and historical approaches, our results show that snow avalanche activity in CdG is linked to the presence of steep slopes, the absence of arboreal vegetation and local meteorological conditions, which favor the instability of the local snowpack.
Slab and wet snow avalanches are the most frequent type of events in the CdG. By combining the susceptibility maps, we observed that most of the area is highly susceptible to snow avalanche release. Due to the local meteorological conditions, snow avalanche activity is highly likely during the late winter and early spring seasons.
The trail to Elola mountain shelter and the normal routes to Almanzor and Casquerazo peaks, which all pass under areas of very high susceptibility, should be approached with special caution by mountaineers and other users.
Our map collection provides a useful outcome for testing available snow avalanche simulations provided by numerical models such as RAMMS, SAMOS and ELBA+ (CitationChristen, Kowalski, & Bartelt, 2010; CitationKeiler et al., 2006; CitationSampl & Zwinger, 2004) under the Mediterranean conditions of the Iberian Central System and may serve as a first step towards establishing a local snow avalanche survey program project in the future.
Software
Spatial information analysis was carried out using ArcGIS 10.4 software. Final hillshade extraction from the DEM was performed in Surfer 12 software. Final maps design was conducted in Adobe Illustrator CC 2017 software.
Soteres_etal_Map.pdf
Download PDF (39.3 MB)Acknowledgements
The authors acknowledge the help received from the Sierra de Gredos Regional Park, the Consejería de Medio Ambiente of the Junta de Castilla y León (JCyL) and the Elola Shelter. Finally, we would like to thank Antonio Fernández Cañadas for his advice during the process and Borja Robert for his help as field assistant. Comments from Yves Bühler and Martin von Wyss significatively improved this manuscript.
Disclosure statement
No potential conflict of interest was reported by the authors.
Additional information
Funding
Related Research Data
References
- Acaso, E. , Ruiz-Zapata, M. B. , Pedraza, J. , & Centeno, J. (1985). Contribución al estudio del periglaciarismo en la Sierra de Gredos. Cuaderno Lab. Xeolóxico de Laxe , 10 , 115–132.
- Agencia Estatal de Meteorología & Instituto Meteorológico de Portugal . (2011). Atlas Climático Ibérico . Madrid : AEMET e IMP. 80 p.
- Alonso-González, E. , López-Moreno, J. I. , Gascoin, S. , Ojeda, M. G. V. , Sanmiguel-Vallelado, A. , Navarro-Serrano, F. , ... & Essery, R. (2018). Daily gridded datasets of snow depth and snow water equivalent for the Iberian Peninsula from 1980 to 2014. Earth System Science Data , 10 , 303–315.
- Barbolini, M. , Pagliardi, M. , Ferro, F. , & Corradeghini, P. (2011). Avalanche hazard mapping over a large undocumented areas. Natural Hazards , 56 , 451–464. doi: 10.1007/s11069-009-9434-8
- Beato Bergua, S. , Poblete Piedrabuena, M. Á. , & Marino Alfonso, J. L. (2018). Snow avalanche susceptibility in the eastern hillside of the Aramo range (Asturian Central Massif, Cantabrian Mountains, NW Spain). Journal of Maps , 14 (2), 373–381. doi: 10.1080/17445647.2018.1480974
- Bühler, Y. , Kumar, S. , Veitinger, J. , Christen, M. , Stoffel, A. , & Snehmani, S. (2013). Automated identification of potential snow avalanche release areas based on digital elevation models. Natural Hazards and Earth System Sciences , 13 (5), 1321–1335. doi: 10.5194/nhess-13-1321-2013
- Bühler, Y. , Rickenbach, D. V. , Stoffel, A. , Margreth, S. , Stoffel, L. , & Christen, M. (2018). Automated snow avalanche release area delineation-validation of existing algorithms and proposition of a new object-based approach for large-scale hazard indication mapping. Natural Hazards and Earth System Sciences , 18 (12), 3235–3251. doi: 10.5194/nhess-18-3235-2018
- Carrasco, R. M. , Pedraza, J. , Domínguez-Villar, D. , Villa, J. , & Willenbring, J. K. (2013). The plateau glacier in the Sierra de Béjar (Iberian Central System) during its maximum extent. Reconstruction and chronology. Geomorphology , 196 , 83–93. doi: 10.1016/j.geomorph.2012.03.019
- Carrasco, R. M. , Pedraza, J. , Domínguez-Villar, D. , Willenbring, J. K. , & Villa, J. (2015). Sequence and chronology of the Cuerpo de Hombre paleoglacier (Iberian Central System) during the last glacial cycle. Quaternary Science Reviews , 129 , 163–177. doi: 10.1016/j.quascirev.2015.09.021
- Christen, M. , Kowalski, J. , & Bartelt, P. (2010). RAMMS: Numerical simulation of dense snow avalanches in three-dimensional terrain. Cold Regions Science and Technology , 63 (1–2), 1–14. doi: 10.1016/j.coldregions.2010.04.005
- Chueca, J. , & Julián, A. (2004). Caracterización y tipología de aludes en el valle de Ordesa (Pirineo central español). Boletín de La Real Sociedad Española de Historia Natural. Sección Geológica , 99 (1–4), 93–103.
- Chueca, J. , & Julián, A. (2010). Cartografía de zonas probables de salida de aludes en el Alto Gállego (Pirineo Central Aragonés) mediante el empleo de Sistemas de Información Geográfica. Cuadernos de Investigación Geográfica , 36 (1), 27–42. doi: 10.18172/cig.1225
- Chueca, J. , Julián, A. , & Montañés, A. (2014). A proposal for avalanche susceptibility mapping in the Pyrenees using GIS: The Formigal-Peyreget area (Sheet 145- I; scale 1:25.000). Journal of Maps , 10 (2), 203–210. doi: 10.1080/17445647.2013.870501
- Fernández-Cañadas, J. A. , Palomo, M. , & Pantoja, L. (2015). Delimitación espacial de las zonas probables de aludes en el macizo de Peñalara mediante el uso de SIG. Espacio, Tiempo y FormaSeria VI, Geografía , 6–7 , 73–94. doi: 10.5944/etfvi.6-7.0.14849
- Furdada, G. (1996). Estudi de les allaus al Pirineu occidental de Catalunya: Predicció espacial i aplicacions de la cartografia, published Ph. D (Doctoral dissertation, thesis, Ediciones Geoforma, Logroño, 315 pp).
- Furdada, G. , & Vilaplana, J. M. (1998). Statistical prediction of maximum avalanche run- out distances from topographic data in the western Catalan Pyrenees northeast Spain. Annals of Glaciology , 26 , 285–288. doi: 10.3189/1998AoG26-1-285-288
- García-Hernández, C. , Ruiz-Fernández, J. , Sánchez-Posada, C. , Pereira, S. , Oliva, M. , & Vieira, G. (2017). Reforestation and land use change as drivers for a decrease of avalanche damage un mid-latitude mountains (NW Spain). Global an Planetry Change , 153 , 35–50. doi: 10.1016/j.gloplacha.2017.05.001
- Gascón, E. , Sanchez, J. L. , Charalambous, D. , Fernández-González, S. , López, L. , García-Ortega, E. , & Merino, A. (2015). Numerical diagnosis of a heavy snowfall event in the center of the Iberian Peninsula. Atmospheric Research , 153 , 250–263. doi: 10.1016/j.atmosres.2014.08.001
- González, J. S. , Vega, J. M. R. , Villar, A. G. , & Gutiérrez, B. G. (2010). Los aludes de nieve e n el Alto Sil (Oeste de la Cordillera Cantábrica, España). Cuadernos de Investigación Geográfica , 36 , 7–26. doi: 10.18172/cig.1224
- Hidalgo-Moran, S. (2011). La afluencia de visitantes a los Parques Naturales de Castilla y León: Una cuestión problemática. Nimbus , 27-28 , 25–40.
- Huguet del Villar, E. (1915). Los glaciares de Gredos. Boletín de la Real Sociedad Española Historia Natural , 15 , 379–390.
- Julián, A. , & Chueca, J. (1999). Cartografía de zonas probables de aludes en el valle de Ordesa (Pirineo aragonés). Geographicalia , 37 , 73–86.
- Julián, A. , Peña, J. L. , Chueca, J. , Zabalza, J. , Lapeña, A. , & López, I. (2000). Cartografía de zonas probables de aludes en el Pirineo aragonés: Metodología y resultados. Boletín de la A.G.E. , 30 , 119–134.
- Keiler, M. , Sailer, R. , Jörg, P. , Weber, C. , Fuchs, S. , Zischg, A. , & Sauermoser, S. (2006). Avalanche risk assessment? A multi-temporal approach, results from Galtür, Austria. Natural Hazards and Earth System Science , 6 , 637–651. doi: 10.5194/nhess-6-637-2006
- Maggioni, M. , & Gruber, U. (2003). The influence of topographic parameters on avalanche release dimension and frequency. Cold Regions Science and Technology , 37 (3), 407–419. doi: 10.1016/S0165-232X(03)00080-6
- Martínez de Pisón, E. , & Muñoz Jiménez, J. (1972). Observaciones sobre la geomorfología del Alto Gredos. Estudios Geográficos , 32 , 597–690.
- Muñoz, J. , Palacios, D. , & de Marcos, J. (1995). The influence of the geomorphologic heritage on present slope dynamics. The Gredos Cirque, Spain. Pirineos , 145 , 35–63. doi: 10.3989/pirineos.1995.v145-146.146
- Muñoz, R. I. (2012). Accidentes por aludes de nieve en España durante las diez primeras temporadas del siglo XXI. Revista de L’Associació per al Coneixement de la Neu i les Allaus , 4 , 19–23.
- Obermaier, H. , & Carandell, J. (1916). Contribución al estudio del glaciarismo cuaternario de la Sierra de Gredos. Trabajos del Museo Nacional de Ciencias Naturales. Serie Geológica , 14 , 1–54.
- Palacios, D. , Andrés, N. , Marcos, J. , & Vázquez-Selem, L. (2012). Maximum glacial advance and deglaciation of the Pinar Valley (Sierra de Gredos, Central Spain) and its significance in the Mediterranean context. Geomorphology , 177 , 51–61. doi: 10.1016/j.geomorph.2012.07.013
- Palacios, D. , de Marcos, J. , & Vázquez-Selem, L. (2011). Last glacial maximum and deglaciation of Sierra de Gredos, Central Iberian Peninsula. Quaternary International , 233 (1), 16–26. doi: 10.1016/j.quaint.2010.04.029
- Palomo, M. (2008). Análisis espacial de las reas favorables al desencadenamiento de aludes en el circo de Piedrafita (Huesca). Lucas Mallada , 13 , 215–235.
- Pedraza, J. , Carrasco, R. M. , Domínguez-Villar, D. , & Villa, J. (2013). Late Pleistocene glacial evolutionary stages in the Gredos mountains (Iberian Central System). Quaternary International , 302 , 88–100. doi: 10.1016/j.quaint.2012.10.038
- Pedraza, J. , & Fernández, P. (1981). Cuaternario y Terciario. In P. Ruiz , & V. Gabaldón (Eds.), Mapa Geológico de Bohoyo. Map 577 . Madrid : Instituto Geológico y Minero de España (IGME). http://www.igme.es/
- Ruiz, P. , & Gabaldón, V. (eds.). (1981). Mapa Geológico de Bohoyo. Map 577 . Madrid : Instituto Geológico y Minero de España (IGME). http://www.igme.es/
- Sampl, P. , & Zwinger, T. (2004). Avalanche simulation with SAMOS. Annals of Glaciology , 38 , 393–398. doi: 10.3189/172756404781814780
- Schmieder, O. (1915). Die Sierra de Gredos. Mitteilunger der Geographischen Gesellschaft in München, Zehnter Band 1, 60 pp.
- Schweizer, J. , Bartelt, P. , & van Herwijnen, A. (2015). Chapter 12: Snow avalanches. In J. F. Shroder , W. Haeberli , & C. Whiteman (Eds.) Snow and ice-related hazards, risks, and disasters . (pp. 395–436). Cambridge, MA: Academic Press.
- Schweizer, J. , Jamieson, J. B. , & Schneebeli, M. (2003). Snow avalanche formation. Reviews of Geophysics , 41 (4), 1016. doi: 10.1029/2002RG000123
- Soteres, R. L. , Pedraza, J. , & Carrasco, R. M. (2016). Cartografía de susceptibilidad y estimación del máximo alcance de aludes en el Circo de Gredos (Sistema Central Ibérico). POLÍGONOS. Revista de Geografía , 28 , 265–285. doi: 10.18002/pol.v0i28.4296
- Vada, J. A. , Frochoso, M. , & Vilaplana, J. M. (2012). Evaluación y cartografía del riesgo de aludes en el camino PR-PNPE 21 de acceso a la Vega de Urriellu, Picos de Europa (Noroeste de España). Cuaternario y Geomorfología , 26 (1), 29–47.
- Veitinger, J. , Purves, R. S. , & Sovilla, B. (2016). Potential slab avalanche release area identification from estimated winter terrain: A multi-scale, fuzzy logic approach. Natural Hazards and Earth System Sciences, 16(10), 2211.
- Vidal Box, C. (1936). Contribución al conocimiento morfológico del segmento Occidental de la Sierra de Gredos (Bohoyo). Boletín de la Real Sociedad Española de Historia Natural , 36 , 17–37.