
ABSTRACT
Increasing urbanization and suburban growth in cities globally has highlighted the importance of land planning using detailed geomorphologic maps that depict anthropogenic landform changes. Such mapping provides information crucial for land management, hazard identification, and the management of the challenges arising from urbanization. The development and use of quantitative and repeatable methods to map anthropogenic and natural processes are required to advance the science of urban geomorphological mapping. This study investigated the application of geospatial modeling, structure-from-motion (SfM) photogrammetric methods and DEM differencing as means of quantifying anthropogenic landform changes from archival aerial imagery. Anthropogenic landforms were incorporated into a detailed geomorphologic map in an urbanizing watershed located in the Washington, D.C. metropolitan suburb of Vienna, Virginia.
1. Introduction
Human activities have a substantial and cumulative effect on the landscape and its landforms (CitationMarsh, 1864). Geomorphologic changes result from a range of anthropogenic activities including forest clearing, agriculture, land draining and filling, mining and quarrying, channelization, irrigation, and construction of dams or other engineering features (CitationNir, 1983). These activities involve both the intentional removal and deposition of material as well as the unintentional effects of hydrological changes and resulting erosion and sedimentation (CitationHooke, 2000).
Anthropogenic landforms are created at a variety of spatial scales. Local scale landforms result from excavation, cutting, and grading to modify slopes and drainage patterns to create level ground for development and transportation infrastructure (CitationNir, 1983). Broader scale landforms are created by mining and quarrying, as well as subsidence due to water or mineral resource extraction. Depositional landforms, or ‘man-made-ground’ typically entail the use of fill material, as well as waste dumps, and may occur at a range of scales (CitationDouglas et al., 2010). The cumulative geomorphologic effects of anthropogenic activity are most pronounced in areas of dense human occupation (e.g. in urban spaces) and primarily occur in the early-urban to the mid-urban stages of development (CitationNir, 1983).
With increasing pressure on urban areas, the need for geoscience information plays a crucial role in the evaluation of resource potential and suitability for urban development, identifying hazards and informing management strategies (CitationCooke, 1976; CitationFookes et al., 2005; CitationMcGill, 1964). Situations in which development decisions were not grounded in detailed geomorphologic information often have catastrophic results including landslides (CitationAlexander, 1989), housing and infrastructure collapse (CitationChirico & Epstein, 2000), and flooding and hydrological effects (CitationDouglas, 2010). Landform changes, such as those due to road gradation and paving, have significant effects on natural processes which concentrates and alters drainage patterns (CitationMontgomery, 1994).
There is growing recognition of the importance of urban geomorphological and geologic mapping to inform development of urban and suburban fringe areas where prior anthropogenic landform change may have occurred (CitationBrandolini et al., 2017; CitationDel Monte et al., 2016; CitationDouglas, 1999; CitationFaccini et al., 2012; CitationLee, 2001; CitationLóczy & Süto, 2011; CitationRobinson & Speiker, 1978). There are also new methods for geomorphological mapping and landform change which are emerging in parallel with enabling technology and datasets (CitationOtto & Smith, 2013; CitationParon & Smith, 2008). Stereo and monoscopic aerial photography interpretation has consistently been used as a method to map anthropogenic changes and geomorphologic units in urban areas (CitationDel Monte et al., 2016; CitationMaksud Kamal & Midorikawa, 2004). However, traditional stereo compilation methods are labor intensive and time consuming. New structure-from-motion (SfM) photogrammetric techniques offer a more efficient and highly accurate procedure for image matching, triangulation, and digital elevation model extraction from aerial images (CitationFonstad et al., 2013; CitationWestoby et al., 2012). The development of digital elevation models (DEMs) from historical aerial photo sources for mapping geomorphologic change is a recent advance (CitationGomez et al., 2015) and could significantly contribute to urban geomorphological mapping applications. However, comparison of DEM data from historical sources and with different resolutions is not always a straightforward process (CitationJames et al., 2012; CitationSmith et al., 2015).
The goal of this research is to develop and apply quantitative and repeatable geospatial mapping techniques to advance the science of urban geomorphological mapping. The research presented here specifically applies digital elevation modeling, historical aerial imagery, and SfM photogrammetry to map and integrate anthropogenic, fluvial, and regolith geomorphology for a small urbanizing watershed in the Washington, D.C. metropolitan area.
2. Study Area
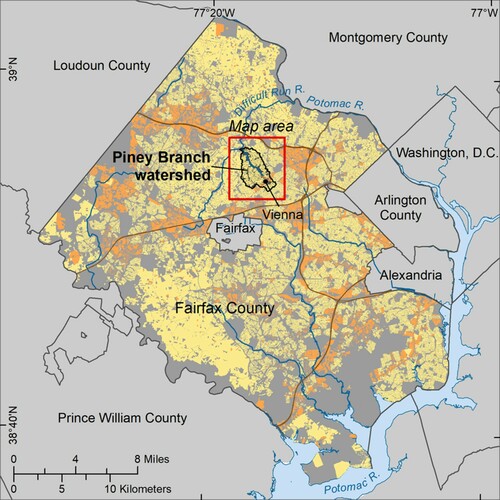
The area selected for this research was the Piney Branch watershed in Vienna, Fairfax County, Virginia, a suburb of Washington, D.C. (). Piney Branch is a tributary of Difficult Run which feeds into the Potomac River. The watershed is approximately 10 km2 in size with 70 m of total relief.
Figure 1. Study area map showing high- and medium-density development (orange) and low-density residential areas (light yellow).
2.1. Geology
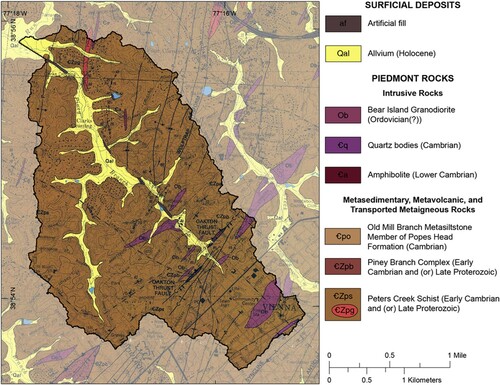
The watershed is underlain by Early Cambrian and/or Late Proterozoic metasedimentary, metavolcanic, and transported metaigneous rocks of the Piedmont geologic province, including the Piney Branch Complex and the Peters Creek Schist (). The Piney Branch Complex (CZpb) is characterized by an intermixed complex of peridotite, pyroxenite, and gabbro now represented by serpentinite, soapstone, actinolite schist, and metagabbro which constitute an autoclastic mélange (CitationDrake & Morgan, 1981). The unit also contains small sheets and dikes of quartz-albite plagiogranite. The Peters Creek Schist is characterized by fine- to coarse-grained, quartz-rich schist, and lesser mica gneiss. Interbedded with these rocks are fine- to medium-grained, well-bedded metagraywacke and semi-pelitic schist (CZpg), as well as a few layers of calc-silicate rock. Also present is the Old Mill Branch metasiltstone Member of the Popes Head Formation (Cpo), which is characterized by thin- to medium-bedded, medium- to very fine-grained, very mature, micaceous metasiltstone. These units are intruded by the Bear Island Granodiorite, a fine-grained, muscovite-biotite, granodiorite and related pegmatite composed largely of quartz. Bear Island Granodiorite holds up irregular elongated ridges roughly perpendicular to the direction of streamflow (see CitationDrake & Lee, 1989). The bedrock units have a significant regolith weathering profile (described in CitationPavich et al., 1989) and are overlain by quaternary alluvium in the floodplain of Piney Branch and its tributaries.
Figure 2. Geologic map of Vienna Quadrangle shown for the extent of the study area (modified from CitationDrake & Lee, 1989)
2.2. Land-use and land cover history
Colonial and post-colonial crop and livestock-based small farms began in the area in 1754 and expanded through the 1850s. Colonial-era deforestation and the introduction of European-style agricultural practices resulted in significant erosion of topsoil from deforested hillslopes resulting in deposition of sedimentary material inherited from previous anthropogenic activities or ‘legacy sediments’ (CitationJames, 2013, Citation2018). Subsequent transport and deposition of legacy sediments into valley bottoms has elevated the floodplain 1–2 m above the previous natural flood plain (CitationHupp et al., 2013). The establishment of several known mill dams located along Piney Branch may have also compounded development of legacy sediments as noted in other regional research (CitationHupp et al., 2013; CitationMerritts et al., 2011).
The Washington and Old Dominion (W&OD) railroad was constructed between 1855 and 1860 for regional passenger and freight travel. Running roughly parallel to Piney Branch and bisecting the watershed, the development of this transportation corridor required significant land modification through excavation and fill and resulted in continued land clearing for development along its route. The W&OD rail line operated until the 1960s, when it was purchased by the Virginia Department of Highways and Virginia Electric and Power Company for use as an electric power line transmission right of way. The railroad line itself was eventually converted to a paved recreational rail trail beginning in the late 1970s (CitationVirginia.gov, 2019).
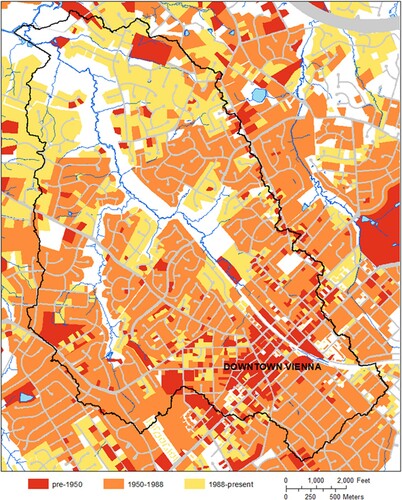
Concurrently, from the late 1940s onward, small farms have gradually been replaced by expanding urbanization and development which is a consistent pattern displayed in other similar urban areas in the US (CitationHooke, 1999). The watershed is primarily suburban, with housing communities and major transportation corridors. The transition from rural agricultural land use to suburban developed land use began in the downtown core area of Vienna and radiated outward through subsequent decades. The development of medium- or high-density housing was accompanied by significant land modification to excavate basement foundations for houses, to build sewer and stormwater infrastructure, to grade existing slopes, and to grade and pave new roadways. A map of the progression of development on a parcel-by-parcel temporal scale is shown in .
Figure 3. Map of parcel development over time in the study area. The black line represents the boundary of the Piney Branch watershed.
3. Materials and Methods
Due to the varied land-use and land cover transitions that have occurred, multiple data sources were incorporated to create a detailed urban geomorphologic map highlighting anthropogenic landform changes (Main Map).
3.1. Data
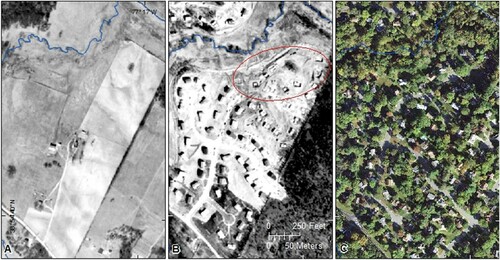
Stereo aerial imagery and ortho-imagery ranging from 1937 to 2017 were acquired. Examples of this imagery, which documents the ‘farm to housing’ transition, are shown in for 1950, 1973, and 2018 respectively. (B) shows the grading, filling, and excavation of building foundations and basements typical of post-1950 housing construction methods utilized in this area.
Figure 4. Example of conversion of small farm to housing development from (A) 1950, (B) 1973, and (C) 2018. The excavation of building foundations and basements is shown within the red circle in B. The development occurs along the floodplain of an unnamed tributary (shown in blue) of Piney Branch in the northwest corner of the image frame.
Prior to processing, all digital aerial images were cropped using Adobe Photoshop to remove the photo frame and fiducial information. SfM processing was conducted using Agisoft PhotoScan [Metashape v. 1.6] to produce a DSM and orthophoto from each set of images. shows the dates and scales of imagery and DEMs used in this study. Eleven ground control points (GCPs) were added to improve photo alignment and to control the final orthophoto and DSM models. shows the data and estimated error for the GCPs as modeled in Agisoft Metashape.
Table 1. Imagery and DEMs used in the study.
Table 2. GCPs used in the study.
The DSM was then filtered to remove vegetation and manmade features above the land surface. This was done in PCI Geomatica v.2018 using the DSM2DTM algorithm. DSM2DTM functions by applying a series of filters to derive a local minimum based on a user-defined window size and compares DSM values to the local minimum or ground surface elevation. Elevation values exceeding the defined ground surface elevation are removed and replaced with the minimum for the patches identified (CitationBarbarella et al., 2017). In this way, the DSM was filtered to produce a DTM and was prepared to be directly compared with the 2012 LiDAR data.
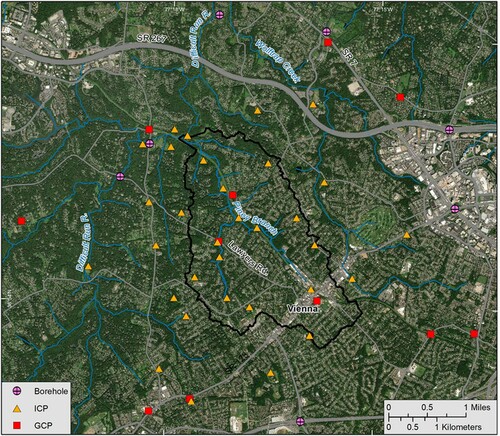
The geologic map of the Vienna Quadrangle in Fairfax County, Virginia (CitationDrake & Lee, 1989) was digitized and used as a data input to modeling regolith thickness in combination with analysis of borehole data, fieldwork, and literature on regolith properties in the larger region (CitationPavich et al., 1989). Specifically, a database of 20 boreholes at 7 locations around the Piney Branch watershed was developed from previously acquired hollow-stem auger borings. These borehole logs record sediment characteristics, material strength properties, degree of weathering, and depth to un-weathered bedrock. The boreholes range in depth from 6 m to 34 m. Field mapping also included shallow hand-augered sediment samples (locations not shown) which generally penetrated less than 2 m and were confined to floodplain areas. shows the distribution of GCPs, independent check points (ICPs), and borehole data used in this study.
Figure 5. Map showing the distribution of GCPs, ICPs, and borehole data used in this study.
Datasets depicting topographic and other anthropogenic development features such as roads, building footprints, and hydrologic features were acquired from various sources including municipal government agencies.
3.2. DEM of Difference (DoD) modeling for anthropogenic landforms
Quantification of anthropogenic topographic change through direct comparison of elevation surfaces is done by differencing two elevation surfaces. In this study, the 1950 SfM DSM was subtracted from the 2012 DEM, resulting in a DEM of Difference (DoD) where positive values represent land accretion and negative values indicate land removal occurring between those time periods (CitationEtzelmuller, 2000). DEMs have unique error characteristics based on the method used to develop them which are compounded when multiple DEMs are directly compared. Therefore, it is necessary to account for the error in both of the input DEMs to ensure that landform changes can be distinguished from the combined error in the DoD dataset (CitationLane et al., 2003; CitationBurrough & McDonnell 1998). In this study, the accuracy of the filtered SfM DTM created from 1950 aerial imagery was calculated using the Root Mean Squared Error (RMSE) statistic from a set of 32 ICPs at locations that exhibited little evidence of landform change in sequential aerial image analysis. These 32 ICPs were attributed with elevation values from the 2008 USGS LiDAR DEM. The 2008 DEM was used for the elevations of these points so that the check point elevations were independent of the 1950 and 2012 DEM elevation datasets used in the DoD modeling. shows the RMSE accuracy results of the 1950 DSM for the ICP locations.
Table 3. RMSE accuracy results of the 1950 DSM for the ICP check point locations used in the study.
After RMSE error modeling, a change threshold value was developed using the Root of Sum in Quadrature (RSiQ) method (CitationChandler, 1999; CitationLane et al., 2000; CitationTaylor, 1997; CitationWestoby et al., 2012; CitationWheaton et al., 2010). The RSiQ method characterizes the combined vertical inaccuracies in the DoD, where values above or below the threshold constitute significant topographic change and values within the threshold cannot be distinguished from noise or possible error in the respective DEMs.
3.3. Geomorphological modeling of fluvial geomorphology features
Using the 2012 USGS LiDAR DEM, hydrologic characteristics such as flow direction and flow accumulation were calculated and used to model streamflow and fluvial processes. A relative elevation model and path-distance model were completed using the methods presented by CitationChirico (2010) for surficial geologic and regolith modeling. It assumes that fluvial erosion and slope processes are the main contemporary natural geomorphic processes at work in the study area. The relative elevation modeling develops a base DEM dataset using the elevation values of points along the hydrologic network. It then subtracts the base elevation data from the 2012 DEM which results in a dataset showing all elevation values of the terrain above the fluvial hydrographic network (erosion surface). The combination of the relative elevation model and the path distance model enable the classification of alluvial and colluvial deposits along the hydrologic network (CitationChirico, 2010).
3.4. Geomorphological modeling of regolith units
The geologic units in the study area have developed regolith profiles as a result of chemical and physical weathering over time. Thus, regolith was mapped by developing a model of regolith thickness based on underlying geologic rock unit properties and supported by analysis of available borehole data (for example see CitationPavich et al., 1989) and field studies. The relative elevation dataset was used in modeling regolith depth as a function of weathering, groundwater level, and elevation of local stream base level. This analysis revealed that the regolith profiles of the Peters Creek Schist and the Piney Branch Complex can be over 30 m thick and progressively thin from the interfluve downslope to the stream channels eroding them. The intrusive rock units have a thinner (generally less than 3 m thick) weathered bedrock surface.
4. Results
4.1. DEM of Difference (DoD) and mapping of anthropogenic landforms
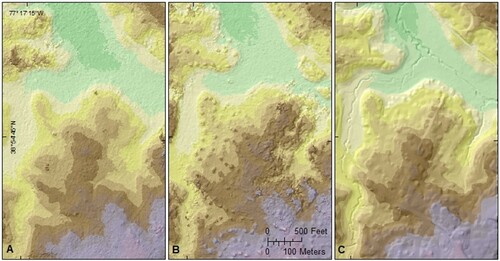
The 1950 DTM was found to have a vertical RMSE of ±1.43 m. While less accurate than the ±0.3 m vertical of the 2012 LiDAR dataset, the 1950 DTM is nonetheless comparable to the LiDAR elevation data for topographic change purposes. shows a small area of the 1950 and 1973 SfM DEMs in comparison to the 2012 LiDAR data for reference.
Figure 6. Comparison of (A) 1950 DTM, (B) 1973 DSM and (C) 2012 USGS LiDAR DEM in the study area.
Calculation of a change detection threshold using the RSiQ method indicated that values of the 2012–1950 DoD between −1.46 m and +1.46 m cannot be distinguished from error or noise. Elevation change exceeding −1.46 m or +1.46 m can be considered as areas of substantive change. Substantive geomorphologic change was classed into the following categories.
Areas of negative change are represented by two categories on the map. One showing −1.46 m to −3.5 m (one standard deviation from the mean) and a second showing −3.5 to −10 m (two or more standard deviations) of land removal such for road cuts or ground excavation for development. These are symbolized by a semi-transparent light blue and dark blue shading, respectively. Areas of positive change between +1.46 m to +3.5 m thick are indicative of artificial in-filling of topographic lows and are mapped in light orange. Dark-orange mapped units show where artificial fill materials exceed +3.5 m (up to 10 m) in depth and show where topographic lows have been filled for road construction, underground utility infrastructure, and where sequential land grading around buildings and infrastructure has occurred in the more densely urbanized town of Vienna. Additionally, areas where vegetation was filtered from the 1950 DSM are shown on as areas of forest removal. These areas are symbolized on the map with a semi-transparent, white circular overprint pattern representing former trees.
Other anthropogenic activities have significantly altered the geomorphologic landscape and function. These landforms were incorporated into the map through integration of other data sources and detailed aerial image analysis. An overlay of abandoned and buried pre-1950 gravel surfaced roads that were mapped from aerial photo interpretation and verified during fieldwork are shown in light gray. Contemporary paved surfaces are indicated in medium gray, and buildings and structures are indicated in dark gray. Retaining walls present along some transportation infrastructure are mapped using a hatched line.
4.2. Geomorphological mapping of fluvial geomorphology features
The results of the fluvial geomorphologic model were used to develop three fluvial geomorphologic map units including alluvial floodplain deposits (in yellow), alluvial levee deposits (in light tan-brown), and colluvial hillslope deposits (in peach). A combination of the relative elevation and path distance models of the DEM data were used to segment floodplains and colluvial deposit zones and then were refined based on field observations along Piney Branch Creek and its tributaries. Alluvial floodplain deposits occupy the valley bottoms where slope values range from 0.0° to 2.5°. Alluvial levee deposits occur in direct proximity to the stream channel and were mapped as higher relative elevation to that of the floodplain deposits and low path-distance values (slope-distance from the stream channel). These deposits were verified in the field through selected hand auguring and field observations from recent overbank flood events. Colluvial units occur at the base of the interfluves on a wider range of slopes (2.5– 5.0°) with some local colluvial accumulation on slopes higher than 5.0°. The colluvial deposits occur mainly in the upper portions of the watershed’s tributaries but there are also some deposits along Piney Branch’s downstream floodplain margins where slope deposits accumulate as a result of surface wash near steep interfluves.
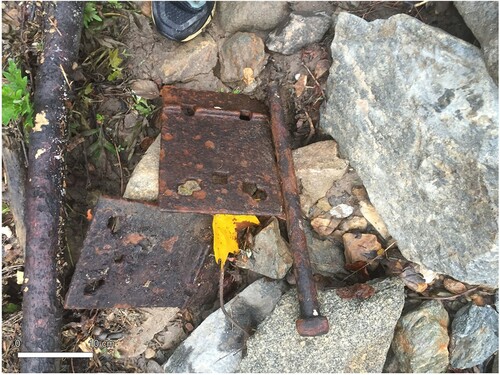
Field mapping revealed the presence of legacy sediments in each of the fluvial geomorphologic map units but predominantly in the alluvial and colluvial units. Legacy sediments in alluvial floodplain deposits were observed in streambank profiles along Piney Branch as an approximately 1–2 m layer of silt/clay, fine sand/sand atop a historical soil layer. The bedload of Piney Branch indicates many fragments of building materials (bricks, shingles, etc.), pebble and gravel sized concrete and asphalt nodules, as well as large anthropogenic debris including iron rail ties and spikes from the former railroad ( and ).
Figure 7. Bricks (foreground) and construction debris observed in the bedload at the confluence of an unnamed tributary and Piney Branch Creek (top of image). Scale is representative of objects in the foreground.
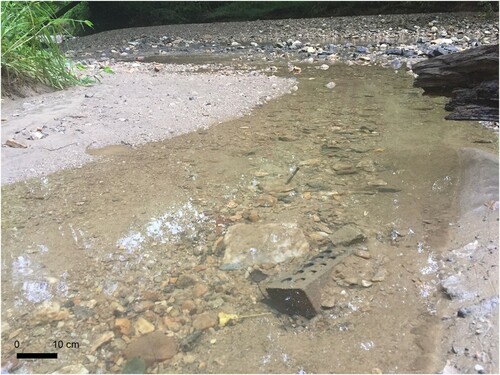
Figure 8. Iron rail ties and spikes observed on a mid-channel cobble/gravel bar in Piney Branch Creek.
4.3. Geomorphological mapping of regolith units
Correlation of relative elevation modeling, previous regolith mapping (CitationPavich et al., 1989), and field observations resulted in the development of 4 map units depicting the presence and thickness of regolith. The first regolith unit (ri) is generally less than 3 m thick and is underlain by units composed of the Lower Cambrian, Cambrian, and Ordovician Piedmont intrusive rock units including amphibolite, quartz bodies, and the Bear Island Granodiorite. These units are more resistant to weathering and thus occur as weathering resistant ridges running perpendicular to Piney Branch and are composed of large boulder to cobble size corestones with abundant quartz fragments mixed with thin sandy to clayey sands at the surface ().
Figure 9. Weathered exposure of the Bear Island Granodiorite (ri). Scale is representative of objects in the foreground.
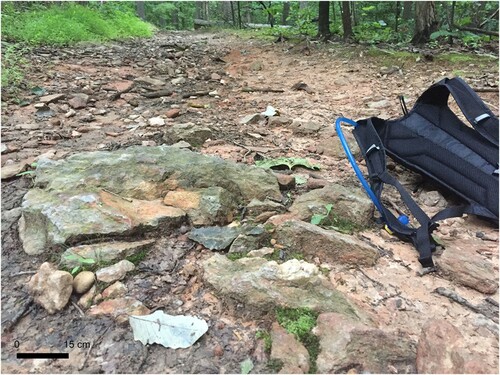
Modeling of the terrain overlying Early Cambrian and/or late Proterozoic and Cambrian Piedmont rocks resulted in three map units (rm1, rm2, rm3) corresponding to the depth of regolith profiles. The regolith profiles are composed of a soil layer which is generally less than 0.6 m thick of sandy-clays to clayey-sands with abundant quartz fragments. The soil is underlain by a mixture of micaceous saprolite and large corestones of the host rock with abundant quartz fragments throughout. Unit rm1 (in light green) is less than 5 m thick and occurs in the toeslope position. Unit rm2 (in medium green) ranges in thickness from 5–10 m along mid-slope areas, and unit rm3 (in dark green) exceeds 10 m in thickness up to a maximum of 35 m and occupies the highest terrain position on upslope interfluves.
5. Discussion/Conclusion
This study focused on geomorphological mapping in an urbanizing watershed in the metropolitan Washington, D.C. region of northern Virginia. The study developed a quantitative and repeatable process for mapping anthropogenic and natural landforms integrating several geospatial techniques to map the presence and thickness of anthropogenic cutting and filling activities as well as fluvial geomorphologic and regolith deposits.
In the Piney Branch watershed, colonial- and post-colonial agricultural practices and associated forest clearing resulted in significant erosion and deposition of legacy sediments above alluvial materials in the floodplain, which has affected contemporary fluvial processes. Post-1950s urbanization and development led to significant topographic change in the form of excavation and filling to construct roads, utility infrastructure, basement foundations, and slope grading for housing developments. These changes are highly evident and quantifiable from the image analysis conducted through SfM photogrammetry and topographic change detection. The map presented in this study clearly shows that the spatial distribution of anthropogenic landform change is associated with the most densely urbanized areas and the areas which have undergone the longest periods of urbanization.
Further, this study demonstrated the value of using SfM photogrammetry, historical aerial photography, and topographic change techniques as efficient and repeatable methods for quantifying elevation changes resulting from anthropogenic activities in urban areas. As such, the study contributes towards the goals of advancing the science of urban geomorphological mapping by expanding the technological tools and methods available to scientists, engineers, and planners for the preparation of these mapping products.
Software
Historic aerial images were cropped as necessary using Adobe Photoshop. A digital surface model (DSM) and orthophoto were developed from historic stereo imagery using the structure-from-motion (SfM) algorithms in Agisoft PhotoScan [Metashape v. 1.6]. Fluvial geomorphologic landforms were modeled using hydrologic and raster analysis tools in ESRI ArcMap. The final geomorphologic map was also created using ESRI ArcMap.
Chirico_etal_JOM_map_revised_20200308.pdf
Download PDF (11.7 MB)Disclosure statement
Any use of trade, firm, or product names is for descriptive purposes only and does not imply endorsement by the U.S. Government.
Related Research Data
References
- Alexander, D. (1989). Urban landslides. Progress in Physical Geography: Earth and Environment, 13(2), 157–189. https://doi.org/10.1177/030913338901300201
- Barbarella, M., Fiani, M., & Zollo, C. (2017). Assessment of DEM derived from very high-resolution stereo satellite imagery for geomorphometric analysis. European Journal of Remote Sensing, 50(1), 534–549. https://doi.org/10.1080/22797254.2017.1372084
- Brandolini, P., Faccini, F., Paliaga, G., & Piana, P. (2017). Urban geomorphology in Coastal Environment: Man-made Morphological changes in a Seaside Tourist Resort (Rapallo, Eastern Liguria, Italy). Quaestiones Geographicae, 36(3), 97–110. https://doi.org/10.1515/quageo-2017-0027
- Burrough, P. A., McDonnell, R. A. (1998). Principles of geographical information systems. Spatial information systems. New York: Oxford University Press. 333.
- Chandler, J. (1999). Technical communication effective application of automated digital photogrammetry for geomorphological research. Earth, 63, 51–63. https://doi.org/10.1002/(SICI)1096-9837(199901)24:1%3C51::AID-ESP948%3E3.0.CO;2-H
- Chirico, P. (2010). Semiautomated mapping of surficial geologic deposits from digital elevation models (DEMs) and hydrologic network data. In D. R. Soller (Ed.), Digital mapping techniques ‘09 (pp. 33–41). https://doi.org/10.3133/ofr20101335
- Chirico, P. G., & Epstein, J. B. (2000). Geographic information system analysis of topographic change in Philadelphia, Pennsylvania, during the Last Century. United States Geological Survey Open-File Report, 00(224), 1–13. https://doi.org/10.3133/ofr00224
- Cooke, R. U. (1976). Urban geomorphology. Geographical Journal, 142(1), 59–65. https://doi.org/10.2307/1796025
- Del Monte, M., D’Orefice, M., Luberti, G. M., Marini, R., Pica, A., & Vergari, F. (2016). Geomorphological classification of urban landscapes: The case study of Rome (Italy). Journal of Maps, 12(sup1), 178–189. https://doi.org/10.1080/17445647.2016.1187977
- Douglas, I. (1999). Physical Problems of the urban environment. In M. Pacione (Ed.), Applied Geography Principles and Practice (1st ed., pp. 59–65). Routledge.
- Douglas, I. (2010). Urban hydrology. The Routledge Handbook of Urban Ecology, 148. https://doi.org/10.4324/9780203839263
- Douglas, I., Goode, D., Houck, M., & Maddox, D. (Eds.). (2010). Handbook of urban Ecology (1st ed.). Routledge.
- Drake, A. A., & Lee, K. Y. (1989). Geologic Map of the Vienna Quadrangle, Fairfax County, Virginia, and Montgomery County, Maryland. U.S. Geological Survey.
- Drake, A. A., & Morgan, B. A. (1981). The Piney Branch Complex; a metamorphosed fragment of the Central Appalachian ophiolite in northern Virginia. American Journal of Science, 281(4), 484–508. https://doi.org/10.2475/ajs.281.4.484
- Etzelmuller, B. (2000). On the Quantification of surface changes using Grid-based digital elevation models (DEMs). Transactions in GIS, 4(2), 129–143. https://doi.org/10.1111/1467-9671.00043
- Faccini, F., Robbiano, A., Roccati, A., & Angelini, S. (2012). Engineering geological map of the Chiavari city area (Liguria, Italy). Journal of Maps, 8(1), 41–47. https://doi.org/10.1080/17445647.2012.668756
- Fonstad, M. A., Dietrich, J. T., Courville, B. C., Jensen, J. L., & Carbonneau, P. E. (2013). Topographic structure from motion: A new development in photogrammetric measurement. Earth Surface Processes and Landforms, 38(4), 421–430. https://doi.org/10.1002/esp.3366
- Fookes, P. G., Lee, E. M., & Milligan, G. (Eds.). (2005). Geomorphology for engineers. Whittles Publishing.
- Gomez, C., Hayakawa, Y., & Obanawa, H. (2015). A study of Japanese landscapes using structure from motion derived DSMs and DEMs based on historical aerial photographs: New opportunities for vegetation monitoring and diachronic geomorphology. Geomorphology, 242, 11–20. https://doi.org/10.1016/j.geomorph.2015.02.021
- Hooke, J. M. (1999). Decades of change: Contributions of geomorphology to fluvial and coastal engineering and management. Geomorphology, 31(1–4), 373–389. https://doi.org/10.1016/S0169-555X(99)00083-5
- Hooke, R. L. (2000). On the history of humans as geomorphological agents. Geology, 28(9), 843–846. https://doi.org/10.1130/0091-7613(2000)28%3C843:OTHOHA%3E2.0.CO;2
- Hupp, C. R., Noe, G. B., Schenk, E. R., & Benthem, A. J. (2013). Recent and historic sediment dynamics along Difficult Run, a suburban Virginia Piedmont stream. Geomorphology, 180–181. 156–169. https://doi.org/10.1016/j.geomorph.2012.10.007
- James, L. A. (2013). Legacy sediment: Definitions and processes of episodically produced anthropogenic sediment. Anthropocene, 2, 16–26. https://doi.org/10.1016/j.ancene.2013.04.001
- James, L. A. (2018). Ten conceptual models of large-scale legacy sedimentation – A review. Geomorphology, 317, 199–217. https://doi.org/10.1016/j.geomorph.2018.05.021
- James, L. A., Hodgson, M. E., Ghoshal, S., & Latiolais, M. M. (2012). Geomorphological change detection using historic maps and DEM differencing: The temporal dimension of geospatial analysis. Geomorphology, 137(1), 181–198. https://doi.org/10.1016/j.geomorph.2010.10.039
- Lane, S., James, T., & Crowell, M. (2000). Application of digital photogrammetry to complex topography for geomorphological research. The Photogrammetric Record, 16(April), 793–821. https://doi.org/10.1111/0031-868X.00152
- Lane, S. N., Westaway, R. M., & Murray Hicks, D. (2003). Estimation of erosion and deposition volumes in a large, gravel-bed, braided river using synoptic remote sensing. Earth Surface Processes and Landforms, 28(3), 249–271. https://doi.org/10.1002/esp.483
- Lee, E. M. (2001). Geomorphological mapping. In J. S. Griffiths (Ed.), Land surface evaluation for engineering Practice, engineering Geology Special Publications (pp. 53–56). The Geological Society of London.
- Lóczy, D., & Süto, L. (2011). Human activity and geomorphology. The Sage Handbook of geomorphology. Sage Publications. 260–278.
- Maksud Kamal, A. S. M., & Midorikawa, S. (2004). GIS-based geomorphological mapping using remote sensing data and supplementary geoinformation. A case study of the Dhaka city area, Bangladesh. International Journal of Applied Earth Observation and Geoinformation, 6(2), 111–125. https://doi.org/10.1016/j.jag.2004.08.003
- Marsh, G. P. (1864). Man and Nature; or, physical Geography as modified by human Action. Scribner.
- McGill, J. T. (1964). Growing importance of urban geology. In U.S. Geological Survey Circular 487. Washington, DC.
- Merritts, D., Walter, R., Rahnis, M., Hartranft, J., Cox, S., Gellis, A., Potter, N., Hilgartner, W., Langland, M., Manion, L., Lippincott, C., Siddiqui, S., Rehman, Z., Scheid, C., Kratz, L., Shilling, A., Jenschke, M., Datin, K., Cranmer, E., … Becker, S. (2011). Anthropocene streams and base-level controls from historic dams in the unglaciated mid-Atlantic region, USA. Philosophical Transactions of the Royal Society A: Mathematical, Physical and Engineering Sciences, 369(1938), 976–1009. https://doi.org/10.1098/rsta.2010.0335
- Montgomery, D. R. (1994). Road surface drainage, channel initiation, and slope instability. Water Resources Research, 30(6), 1925–1932. https://doi.org/10.1029/94WR00538
- Nir, D. (1983). Man, a geomorphological agent: An introduction to anthropogenic geomorphology (D. Ashboren, Ed.). Springer.
- Otto, J. C., & Smith, M. J. (2013). Geomorphological mapping. Geomorphological techniques. Section, 2, 1–10. https://doi.org/10.1144/GSL.ENG.2001.018.01.08
- Paron, P., & Smith, M. J. (2008). Editorial: Applied geomorphological mapping. Journal of Maps, 4(1), 197–200. https://doi.org/10.4113/jom.2008.1048
- Pavich, M. J., Leo, G. W., Obermeier, S. F., & Estabrook, J. R. (1989). Investigations of the characteristics, origin, and residence time of the upland residual mantle of the Piedmont of Fairfax County, Virginia. In US Geological Survey Professional Paper (Vol. 1352). Washington, DC.
- Robinson, G. D., & Speiker, A. M. (Eds.). (1978). ‘Nature to Be Commanded … .’: Earthscience Maps Applied to Land and Water Management. US Geological Survey Professional Paper 950.
- Smith, M. J., Keesstra, S., & Rose, J. (2015). Use of legacy data in geomorphological research. GeoResJ, 6, 74–80. https://doi.org/10.1016/j.grj.2015.02.008
- Taylor, J. R. (1997). An introduction to error analysis: The study of uncertainties in physical measurements. Univ. Science. 45, 92.
- Virginia.gov. (2019). National register of historic places: Washington & Old Dominion Railroad Historic District. http://www.scc.virginia.gov/docketsearch/DOCS/198_01!.PDF
- Westoby, M. J., Brasington, J., Glasser, N. F., Hambrey, M. J., & Reynolds, J. M. (2012). “Structure-from-Motion” photogrammetry: A low-cost, effective tool for geoscience applications. Geomorphology, 179, 300–314. https://doi.org/10.1016/j.geomorph.2012.08.021
- Wheaton, J. M., Brasington, J., Darby, S. E., & Sear, D. A. (2010). Accounting for uncertainty in DEMs from repeat topographic surveys: Improved sediment budgets. Earth Surface Processes and Landforms, 35, 136–156. https://doi.org/10.1002/esp.1886