
ABSTRACT
Two detailed geomorphological maps (1:2000) depicting landscape changes as a result of a glacial lake outburst flood were produced for the 2.1-km-long section of the Zackenberg river, NE Greenland. The maps document the riverscape before the flood (5 August 2017) and immediately after the flood (8 August 2017), illustrating changes to the riverbanks and morphology of the channel. A series of additional maps (1:800) represent case studies of different types of riverbank responses, emphasising the importance of the lateral thermo-erosion and bank collapsing as significant immediate effects of the flood. The average channel width increased from 40.75 m pre-flood to 44.59 m post-flood, whereas the length of active riverbanks decreased from 1729 to 1657 m. The new deposits related to 2017 flood covered 93,702 m2. The developed maps demonstrated the applicability of small Unmanned Aerial Vehicles (UAVs) for investigating the direct effects of floods, even in the harsh Arctic environment.
KEYWORDS:
1. Introduction
Glacial lake outburst floods (GLOFs) happen in many regions around the world and are considered severe geo-hazards (CitationCarrivick & Tweed, 2016; CitationClague & Evans, 2000; CitationEmmer, 2017; CitationIribarren Anacona et al., 2015). The direct cause of the water release is usually related to breaching of the ice dam (CitationRoberts et al., 2003; CitationTweed & Russell, 1999); breaching of the moraine dam (CitationReynolds, 1998; CitationWatanabe & Rothacher, 1996; CitationWestoby et al., 2014a); or increase in the amount of meltwater due to explosion of subglacial volcanos (CitationCarrivick et al., 2004; CitationRussell et al., 2010). Changes in environmental conditions can cause the intensification of flood events (CitationHarrison et al., 2006, Citation2018; CitationReynolds, 1998; CitationWatanabe et al., 2009). For example, GLOFs related to moraine dam failures increased in frequency around 1930, which was probably associated with lagged response to the termination of the Little Ice Age (LIA) (CitationHarrison et al., 2018). CitationHarrison et al. (2018) also indicated that, although there was a decrease in the frequency of GLOFs after 1975, the number of floods will increase again soon, as the climate will become warmer. Therefore, knowledge about the direct geomorphic impact of floods on the landscape is crucial from the standpoint of:
Geomorphologists interested in the evolution of river valleys (CitationCenderelli & Wohl, 2001, Citation2003; CitationEmmer, 2017).
Modelling of floods’ characteristics and effects, including flood hydrographs, inundation area, flow competence and mobilisation of sediments (CitationAggarwal et al., 2016; CitationAnacona et al., 2015; CitationWestoby et al., 2014a, Citation2014b).
Practical application and protection of people/infrastructure (CitationAnacona et al., 2015; CitationCarey et al., 2012; CitationCarrivick & Tweed, 2016; CitationCook et al., 2016; CitationKattelmann, 2003).
Recognising ancient flood events in the sedimentological and geomorphological record (CitationBenn et al., 2006; CitationDussaillant et al., 2010; CitationSlomka & Utting, 2018; CitationSrivastava et al., 2017; CitationZaginaev et al., 2016).
Despite the growing number of studies describing the effects of GLOFs (cf. CitationCarrivick & Tweed, 2016; CitationEmmer, 2018; CitationEmmer et al., 2016; CitationHarrison et al., 2018), there is still a need for comprehensive geomorphological observations and illustrations of flood-related changes to the riverscape in detailed spatial and temporal scales (cf. CitationDietrich, 2016; CitationTamminga et al., 2015). CitationTamminga et al. (2015) indicated that the collection of detailed examples of fluvial change is crucial, as our understanding of the geomorphic response to large floods is still incomplete. Therefore, in this study, we used high-resolution pre-, during-, and post-flood imagery collected using an Unmanned Aerial Vehicle (UAV), which provided excellent means of observing and measuring fluvial system response.
The main aim of this study is to develop detailed geomorphological maps in order to create a spatial picture of the immediate geomorphic response of a riverscape to a flood. This paper describes a case study from the Zackenberg river (NE Greenland), illustrating riverscape changes related to the glacial lake outburst flood, therefore contributing to current knowledge on fluvial system geomorphic response in periglacial environments.
2. Study settings
The study was carried out on the lower reaches of the Zackenberg valley, located in northeast Greenland (74°30′N; 20°30′W) ((A, B)). The Zackenberg Research Station, established in 1995, provided access to the field-based observations in this region of the Arctic. Mountain ridges dominate the contemporary geomorphology of the Zackenberg area with peaks rising to 1,472 m a.s.l., other characteristic elements are a system of U-shaped post-glacial valleys (Zackenbergdalen, Store Sødal, Lindemansdalen, and Slettedal), and deep fiords (Young Sund and Tyrolerfjord) ((B, C)). The region is currently ice-free, and glaciers occur only in the mountains (above 1300 m a.s.l.), mainly as small ice caps. However, the Greenland Ice Sheet covered this region several times during the Quaternary (CitationBennike et al., 2008).
Figure 1. Context maps of the study area: (A) Map of Greenland area with the location of Young Sund region in northeast Greenland highlighted; (B) Map of Young Sund region, with the vicinity of Zackenberg highlighted; (C) Map of the vicinity of Zackenberg area, with the studied section area and glacier-dammed lake highlighted; (D) The studied river section area: red rectangles marked with letters a-l indicate locations of the mapped surface, as shown in ; black lines with profile numbers indicate locations of the morphological profiles in .
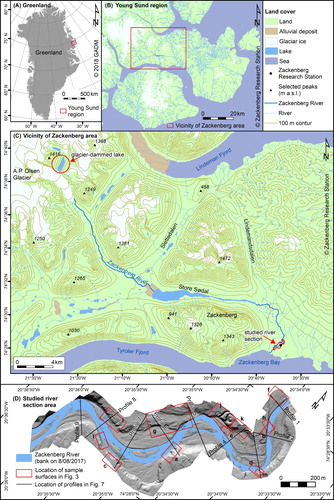
The studied section of the Zackenberg river incises elevated late Weichselian and Holocene terraces and late Weichselian morainic deposits (CitationCable et al., 2018; CitationGilbert et al., 2017). There is continuous permafrost at the study area, with a thickness of 200–300 m in the Zackenberg valley bottom, and 300–500 m in the mountainous region (CitationChristiansen et al., 2008). For the 1997–2014 period, the maximum active layer’s thickness varied between 0.44 and 0.82 m (CitationSkov et al., 2017). The occurrence of continuous permafrost below the active layer was also confirmed by direct observations of frozen sediments along the incised riverbanks in summer 2017.
Degradation of the permafrost by thermo-erosion was previously observed in the Zackenberg valley (CitationDocherty et al., 2017). Erosion resulted from the mechanical and thermal action and caused the formation of an underground tunnel along the Aucellaelv stream. The main factors contributing to the development of thermo-erosion processes were high velocity and warm (4°C) temperature of water, which suggest that as temperature and precipitation in NE Greenland will increase, the degradation of permafrost will also accelerate. Such accelerated degradation can boost sediment load in streams and lower bank stability (CitationChristiansen et al., 2008; CitationDocherty et al., 2017).
The Zackenberg area has a high-Arctic climate. For the period 1996–2005 (CitationHansen et al., 2008), the mean average air temperature was about −9.5°C, with the monthly mean temperature ranging from −22.4°C (February) to 5.8°C (July). The annual average precipitation is low, reaching about 260 mm, mainly in the form of snow. The snow cover begins to form in September and starts to melt in late May. Snowmelt can last until the beginning of July; however, small snow patches can survive until late summer in sheltered depressions.
The Zackenberg river catchment covers about 514 km2. The total annual discharges and associated total annual suspended sediment loads of the river in the years 1996–2015 varied from 132 to 338 million m3 and from 16,129 to 162,622 t, respectively (CitationSkov et al., 2017). The total discharge and suspended sediment were controlled for the most part by extreme events caused by the glacial lake outburst flood (GLOF), extreme rain event, rapid snowmelt, or a combination of these (CitationKroon et al., 2017). In the years 1996–2015, thirteen extreme events with discharges over 100 m3 s−1 were recorded at the Zackenberg river. Moreover, at least two additional extreme events occurred during the winter months (CitationKroon et al., 2017).
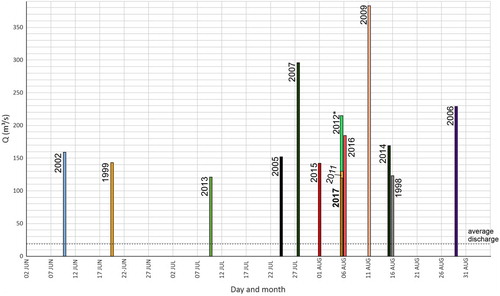
Glacial lake outburst floods are caused by drainage of a glacier-dammed lake near the A.P. Olsen Glacier, located in the western part of the Zackenberg catchment ((C)). The most probable cause of the drainage is rupture of the glacier dam (CitationBehm et al., 2017; CitationJensen et al., 2013). These floods have regularly occurred in late summer (July and August) (). According to data from 2009 to 2013, normal water discharges in the Zackenberg river during summer varied between 10 and 60 m3 s−1 (CitationSøndergaard et al., 2015). However, during a 1–2 day-period of GLOFs, they usually raised even up to c. 400 m3 s−1 (which made up 5–10% of the total annual water discharges), causing significant erosion estimated to make up 25–48% of the annual sediment discharge (estimation was based on sediment concentration in water samples) (cf. CitationSøndergaard et al., 2015).
Figure 2. The average discharge (1996–2018) of the Zackenberg river and the maximum discharges for each year where a flood event was recorded. Data from the Greenland Ecosystem Monitoring Programme were provided by Asiaq – Greenland Survey, Nuuk, Greenland. Note: the flood in 2012 was so large that it destroyed the hydrological station; therefore, the provided discharge is underestimated.
3. Methods
3.1. UAV surveys
Data were collected using a small UAV: a DJI quadcopter Phantom 4 Pro, equipped with a 20 MP camera. Three survey sessions were conducted: before the flood (pre-flood; 5 August 2017); during the flood (6 August 2017); and after the flood, when the water returned to its normal level (post-flood; 8 August 2017). The UAV was flown in a manual mode, in lines along the course of the river. Flight altitude varied from 70 to 110 m above ground. Nadir-images with high overlap (>80%) dominated, with approximately 10% of images taken off-nadir to ensure appropriate coverage of the vertical sections of riverbanks. However, the sunny conditions caused the occurrence of shadows for some sections of the river, which was not possible to avoid due to the polar day and topographic setting. In total, 27 flights from three different take-off sites were performed, and about 5,000 images in jpg format were collected.
3.2. Processing of UAV data
The collected images were processed through the structure-from-motion workflow (CitationEvans et al., 2016) in Agisoft Metashape 1.5.2, using the following steps and parameters:
Sparse point cloud generation with the parameters: accuracy ‘high’, tie-point limit 100,000; key-points – no limit.
Sparse point cloud filtering – three-stage filtering was used to remove points with the highest uncertainty: (1) reconstruction uncertainty: 10; (2) reprojection error: 0.5; and (3) projection accuracy: 6.
Georeferencing of the models – we used UTM 27N coordinates. Control points were collected from previous high-resolution drone imagery from 2014 (CitationCOWI, 2015). We used the same set of control points for all surveys to ensure that the models were registered to the same coordinate space and coherent between each other.
Dense cloud generation with accuracy: high and aggressive filtering.
Generation of digital elevation models (DEMs) and orthomosaics.
The workflow mentioned above was used to process data from the UAV surveys before-flood (5 August 2017), during-flood (6 August 2017), and post-flood (8 August 2017).
3.3. Mapping
The geomorphological features of the studied area were identified based on an analysis of the orthomosaics combined with a visualisation of the digital elevation models, hillshade models with different angles of sun azimuth, maps of the slope gradient, and orthomosaics draped over DEMs and visualised in pseudo-3D view, which enabled us more confident interpretation of geomorphology and changes to riverscape. Field verification was carried out during fieldwork in 2017, and final mapping was performed on-screen using ArcMap 10.6 software. The mapping followed the approach proposed by CitationChandler et al. (2018). As a result, two detailed maps (1:2000) presenting pre- and post-flood geomorphology of the lower reach of the Zackenberg river in northeast Greenland (Main Map 1) and a series of close-up maps (1:800 scale) of sections which experienced the most significant changes (Main Map 2) were produced. The maximum extent of the flood was delineated based on the extent of the water on 6th of August (during-flood) images and the presence of freshly deposited material visible on 8th of August (post-flood) images.
3.4. Map production and design
Produced maps illustrate six main groups of features: fluvial features, riverbank slope types, mass movement types, periglacial features, hydrological features, and other topographic elements (Main Map 1, Main Map 2). The map layout depicts different geomorphological units as polygons (e.g. modern floodplains, relict fluvial terraces, gentle slopes). The most dominant mass movement types, also the most common effects of the flood, were represented as semi-transparent patterns overlain on other geomorphological units – such approach allowed for conveying information about processes and units. Narrow linear features (e.g. thermal-contraction cracks, fluvial scarps) were drawn as polylines. The hillshade was visualised as background. The final map layout was prepared in the UTM 27N coordinate system, in ArcMap 10.6.
4. Results and conclusions
4.1. Morphology of lower section of Zackenberg river, NE Greenland
This study presents the spatial pattern of geomorphological elements in the lower section of the Zackenberg river and illustrates how these elements changed shortly after the glacial lake outburst flood. The mapped features included the following (Main Map 1, ):
Geomorphological expression of different types of erosion and mass movement activity that modified the riverbanks ((a-d, h)):
Debris flows ((a)) – there were two situations in which debris flows were observed. First, they developed along the steep sections of the riverbanks, as a result of debris removal by floodwater leading to slope instability and thawing of the permafrost (Main Map 2: 4A-4B). The second situation included debris flows which developed as a result of the melting of snow patches that survived until late summer in several locations.
Debris slides (slumps) ((b)) were observed mainly in places where the thermo-erosion niches formed, and the riverbank was undercut. Whole blocks of material either slid or slumped as a result of gravitational forces. These processes were observed on slopes that were initially very steep or vertical but were subsequently undercut by the river.
Debris falls ((c)) of single clasts or small cemented gravel blocks were observed along the sections of the banks which were characterised by a relatively high elevation (not necessarily high steepness). The debris fell as a result of lateral erosion and degradation of older segments of the cliffs.
Block fall was observed only in one section where a relatively high and steep slope occurred. Frozen blocks of material fell and developed small rockfall deposits in the river ((d)).
Undercut banks ((h)) were identified from orthomosaics and from the ground. Due to the presence of continuous permafrost, thermo-erosion niches formed as a result of thermal and mechanical activity of floodwater, even though the layer of frozen sediments located above was still stable for at least several days after the flood. The debris and water were constantly falling from these overhanging sections as the permafrost thawed. For that reason, the preservation potential of the overhanging sections would be relatively low. Tension cracks ( m, ), also related to the erosion activity, were observed in some sections.
Fluvial geomorphological features ((e, f, g, i)):
The modern floodplain consists of recently deposited gravels, sands, and fines ((e)). This geomorphological unit included all non-vegetated surfaces built of unconsolidated sediments, which were located along the current river channel. Within this unit, fresh fluvial deposits were also observed and mapped separately (Main Map 1, Main Map 2), as they indicated the maximum extent of the flood.
Vegetated floodplains ((f)) represented this part of the channel floor, which was vegetated by mosses and low plants. Such surface has not been subjected to regular flooding in previous years. However, in the northern section of the studied area, 2017 flood water also covered these vegetated surfaces, eroding some of the vegetation patches.
Relict fluvial terraces ((g)) constitute areas that are higher than the contemporary channel (i.e. located at approximately 4–9 m higher than the current channel floor). Traces of the older channels and bars were clearly visible in the hillshade models and the orthomosaics; some of them were identifiable from the ground.
Small alluvial fans ((i)) developed at the mouth of small gullies, where local drainage transported and deposited debris in the form of 18 small fan-shaped features (the largest is approximately 653 m2; 10 fans have an area smaller than 50 m2).
Features not related to fluvial activity: Permafrost-related features included thermal-erosion gullies ((j)), i.e. the former thermal-contraction-cracks remodelled by the thawing of the permafrost and fluvial activity. Solifluction lobes ((k)) were associated with slow deformations of the surfaces toward the rivers. They were observed only in two places. Modern thermal-contraction-cracks were also clearly visible in the orthomosaic ( l); however, due to the relatively narrow width, they were hard to identify from the ground.
Figure 3. Geomorphological elements mapped in the studied river section. Further explanation in the text.
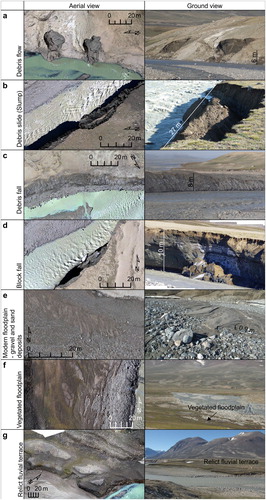
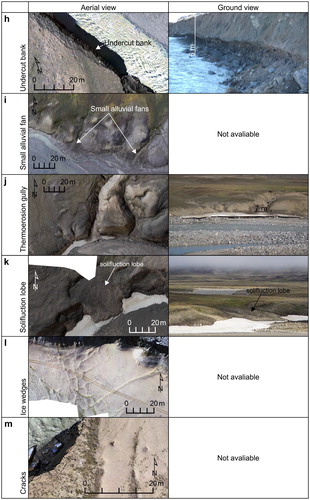
Table 1. Morphological characterisation of riverbank sections.
4.2. Changes in the riverscape morphology as a result of glacial lake outburst flood
As the studied section of the Zackenberg river incised the delta terraces and moraines (CitationCable et al., 2018; CitationGilbert et al., 2017) the steep, sometimes near vertical, riverbanks developed, reaching 6–17 m above the mean water level. The steepness of the slope is related to the presence of permafrost – it would not be possible to develop such steep sections in unconsolidated sediments (sands and gravels) under unfrozen condition. However, as the steep slopes favour processes of lateral erosion, the permafrost is strongly affected by the processes of thermo-erosion, especially under high discharge conditions. Additionally, the riverbanks are in places cut by thermo-erosion gullies which developed due to modification of former thermal-contraction-cracks – in such places, the riverbanks are gentler, and therefore other processes and landforms can evolve post-flood (e.g. solifluction lobes; alluvial fans). A brief description of changes related to the glacial lake outburst flood is provided below and presented in a series of detailed maps (Main Map 2, ):
Lateral erosion caused the retreat of the top of the riverbanks (Main Map 2: 1A-1B, 2A-2B, 3A-3B) in some places up to almost 10 m after just one day of the flood (i.e. immediate response to the single flood event). The lateral extent of the banks’ failure increased slightly in sections 1, 2, 5 and 6, but decreased in section 4 ().
Further erosion is likely in the near future, as sections 1–3, 5 and 6 of the riverbanks were undercut by water and thermo-erosion niches developed (Main Map 2: 1A-1B and 3A-3B, ). Formation of the thermo-erosion niches was related to the presence of permafrost. The water undercut the banks by a combination of thermal and mechanical erosion, but the sediments above the water level were still frozen forming the overhanging sections of riverbanks (). Such overhanging sections are likely transient features, which will collapse in the future (non-immediate response to the flood), thus contributing to a larger cumulative retreat of the riverbanks.
Several debris flows were observed along the riverbanks before the flood (Main Map 2: 4A). After the flood, debris flow processes intensified as water removed the older deposits and increased the steepness of the slopes (Main Map 2: 4B, , ).
Most of the debris eroded from the banks (Main Map 2 – 1A, 2A, 3A) of the river, were subsequently transported further down the valley, towards the modern delta. Only in some places, material, which slumped into the river, was still visible in the river channel several days after the flood.
The erosional power of the river was so great that it destroyed some of the artificial protection features (metal nets filled with boulders), which had been set up to protect the bridge ().
The planimetric measurements of the area occupied by water indicated that the water-covered area in the studied section increased as a result of the flood (from 87,800 to 96,100 m2) – as the river discharge before and after the flood was at similar level, it likely indicates that the depth of the main channel decreased.
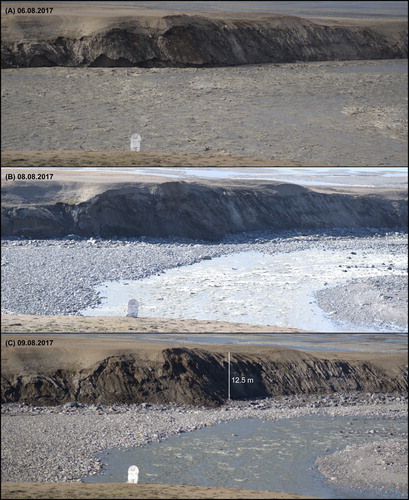
In the wider sections, where water flow was slower, some deposition of fines, sands and small gravels was also observed along the riverbanks (Main Map 1, Main Map 2), especially in later stages of the flood (). These deposits originated from the upstream, as well as from adjacent banks. During the greatest extent of the flood (6 August 2017) lateral erosion removed loose sediments (mainly sands and gravels) and exposed steep sections of the banks. These exposed parts were still visible after the water level dropped (8 August 2017) ((B)); however, rapidly developed debris falls from the upper sections of the riverbanks covered these exposed parts once again ((C)). Most of the eroded deposits originated from diamicton therefore comprised wide variety of grain sizes – smaller fractions were removed by the water, while gravels remained at the foot of the banks; however, the debris was still loose and no armoured layers were formed at the base of the slope.
Other changes in the riverbanks were also observed in some sections. One example was an increase in the steepness of the riverbanks in section 2A-2B (Main Map 2, ). The area where the tension cracks were observed in the vicinity of the riverbanks also increased. The new cracks developed after the flood, which likely indicated that the riverbanks would be more prone to collapse in the future. Indeed, according to reports from the Zackenberg Station in late August 2017 (CitationWestergaard-Nielsen et al., 2018), the section, wherein new tension cracks developed immediately after the flood, subsequently collapsed.
Figure 4. An example of the development of the overhanging section. Note that two days after the flood, some of the overhanging banks were still visible (in the central part of the bottom picture); whereas others have already collapsed (left part of the image).
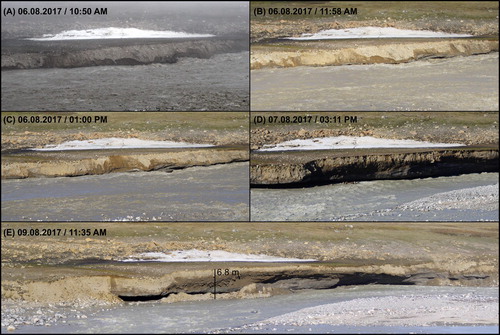
Figure 5. Pre- and post-flood image of artificial bank protection (metal nets filled with rocks). Note that water removed some of the nets.
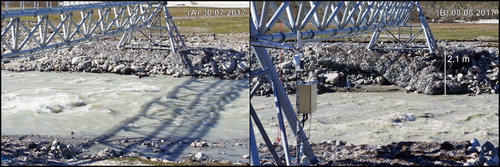
Figure 6. River section, where mass movement processes rapidly covered exposed sediments with new debris.
Some of the sections were still strongly undercut (overhanging) two days after the flood and held together only by the presence of permafrost. However, as the other ‘non-flood’ processes were still in operation (e.g. thawing of permafrost, debris falling), it is expected that the preservation potential of this overhanging bank sections is very low. Therefore, the final (non-immediate) effects of the flood in terms of volumetric changes will be different.
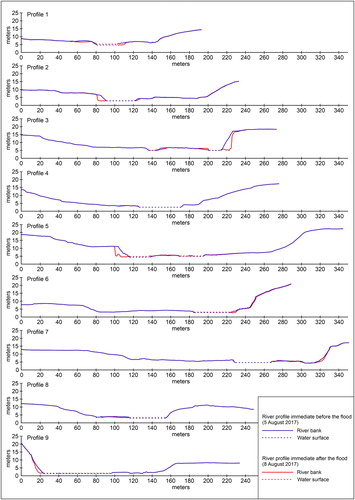
Quantitative analysis of immediate flood-related changes indicated that the active channel increased in average width (measured as active channel area divided by its length) from 40.75 m (5th August) to 44.59 m (8th August). Moreover, during the flood, the average width of the channel was 88.74 m (6th August). The morphology of riverbanks also changed (, ) and profiles clearly illustrate the steepening of the slopes. The length of the active riverbanks decreased from 1729 to 1657 m, as the channel straightened as a result of erosion. The area of non-vegetated floodplains increased only slightly by 1410 m2, but the number of individual patches doubled (from 173 before the flood to 373 patches after the flood), which indicates the development of small bars within the channel. The fresh, flood-related deposition was recorded on the 93,702 m2.
Figure 7. Changes in the channel and riverbanks morphology illustrating the short-term response to the flood event.
While glacial lake outburst floods are often reported from the Arctic regions (CitationCarrivick et al., 2004; CitationRoberts et al., 2003; CitationRussell et al., 2001; CitationRussell et al., 2010; CitationTweed & Russell, 1999), detailed observations of immediate riverscape response to a flood events is rare. Future changes in climate will likely result in further destabilisation of permafrost, which, in combination with the regular occurrence of GLOFs in Zackenberg area, can play a significant role in the modification of local geomorphology and river ecosystem, through changes in sediment load and channel stability. Significant erosion after glacial lake outburst floods has regularly been observed in the Zackenberg river since the Zackenberg Research Station was set up in 1995 (CitationChristiansen et al., 2008). However, our study is the first to show a spatial pattern of this extreme event’s immediate effects in a detailed scale, which was made possible with the use of multi-temporal UAV imagery. Therefore, we have shown that repeated UAV surveys do provide an unique opportunity to investigate geomorphic changes that result from an extreme event.
Software
UAV-generated images were collected in a manual fly mode using DJI Go 4 app for Android. The images were processed using a structure-from-motion approach in Agisoft Metashape Professional 1.5.2, and digital orthomosaics and elevation models were generated. Further data processing was in ArcMap 10.6, where derivatives of DEMs were produced: hillshade models, maps of the slope. The geomorphology of the studied section of the river was mapped on-screen, while the Main Map 1 and Main Map 2 layouts were produced in ArcMap 10.6. Other figures were prepared in ArcMap 10.6 and CorelDraw x7.
Examples of changes in geomorphology following a glacial lake outburst flood, Zackenberg River, Northeast Greenland
Download PDF (44.8 MB)UAV-based remote sensing of immediate changes in geomorphologyfollowing a glacial lake outburst flood, Zackenberg River, Northeast Greenland
Download PDF (34.7 MB)Acknowledgements
We are very grateful for the support from INTERACT Network, which allowed us to visit Zackenberg Research Station in 2017. The realisation of the fieldwork would not have been possible without logistic support provided by the crew of the Zackenberg Research Station. The Aleksandra Tomczyk Scholarship at the Utah State University was funded by Polish National Agency for Academic Exchange NAWA within the framework of the Bekker Scholarship Programme (decision number PPN/BEK/2018/1/00381/DEC/1).
Disclosure statement
No potential conflict of interest was reported by the author(s).
ORCID
Aleksandra M. Tomczyk http://orcid.org/0000-0002-5400-7131
Marek W. Ewertowski http://orcid.org/0000-0002-0422-2327
Additional information
Funding
References
- Aggarwal, A., Jain, S. K., Lohani, A. K., & Jain, N. (2016). Glacial lake outburst flood risk assessment using combined approaches of remote sensing, GIS and dam break modelling. Geomatics, Natural Hazards and Risk, 7(1), 18–36. https://doi.org/10.1080/19475705.2013.862573
- Anacona, P. I., Mackintosh, A., & Norton, K. (2015). Reconstruction of a glacial lake outburst flood (GLOF) in the Engaño valley, Chilean Patagonia: Lessons for GLOF risk management. Science of The Total Environment, 527-528, 1–11. https://doi.org/10.1016/j.scitotenv.2015.04.096
- Behm, M., Walter, J. I., Binder, D., & Mertl, S. (2017). Seismic Monitoring and Characterization of the 2012 Outburst Flood of the Ice-Dammed Lake A.P.Olsen (NE Greenland) [Paper presented]. At the AGU Fall Meeting Abstracts, New Orleans.
- Benn, D. I., Owen, L. A., Finkel, R. C., & Clemmens, S. (2006). Pleistocene lake outburst floods and fan formation along the eastern Sierra Nevada, California: Implications for the interpretation of intermontane lacustrine records. Quaternary Science Reviews, 25(21-22), 2729–2748. https://doi.org/10.1016/j.quascirev.2006.02.018
- Bennike, O., Sørensen, M., Fredskild, B., Jacobsen, B. H., Böcher, J., Amsinck, S. L., Jeppesen, E., Andreasen, C., Christiansen, H. H., & Humlum, O. (2008). Late quaternary environmental and cultural changes in the Wollaston Forland region, northeast Greenland. Advances in Ecological Research, 40, 45–79. Academic Press. https://doi.org/10.1016/S0065-2504(07)00003-7
- Cable, S., Christiansen, H. H., Westergaard-Nielsen, A., Kroon, A., & Elberling, B. (2018). Geomorphological and cryostratigraphical analyses of the Zackenberg valley, NE Greenland and significance of Holocene alluvial fans. Geomorphology, 303, 504–523. https://doi.org/10.1016/j.geomorph.2017.11.003
- Carey, M., Huggel, C., Bury, J., Portocarrero, C., & Haeberli, W. (2012). An integrated socio-environmental framework for glacier hazard management and climate change adaptation: Lessons from lake 513, Cordillera Blanca, Peru. Climatic Change, 112(3-4), 733–767. https://doi.org/10.1007/s10584-011-0249-8
- Carrivick, J. L., Russell, A. J., & Tweed, F. S. (2004). Geomorphological evidence for jökulhlaups from Kverkfjöll volcano, Iceland. Geomorphology, 63(1), 81–102. https://doi.org/10.1016/j.geomorph.2004.03.006
- Carrivick, J. L., & Tweed, F. S. (2016). A global assessment of the societal impacts of glacier outburst floods. Global and Planetary Change, 144, 1–16. https://doi.org/10.1016/j.gloplacha.2016.07.001
- Cenderelli, D. A., & Wohl, E. E. (2001). Peak discharge estimates of glacial-lake outburst floods and “normal” climatic floods in the Mount Everest region, Nepal. Geomorphology, 40(1-2), 57–90. https://doi.org/10.1016/S0169-555X(01)00037-X
- Cenderelli, D. A., & Wohl, E. E. (2003). Flow hydraulics and geomorphic effects of glacial-lake outburst floods in the Mount Everest region, Nepal. Earth Surface Processes and Landforms: The Journal of the British Geomorphological Research Group, 28(4), 385–407. https://doi.org/10.1002/esp.448
- Chandler, B. M. P., Lovell, H., Boston, C. M., Lukas, S., Barr, I. D., Benediktsson, ÍÖ, Benn, D. I., Clark, C. D., Darvill, C. M., Evans, D. J. A., Ewertowski, M. W., Loibl, D., Margold, M., Otto, J.-C., Roberts, D. H., Stokes, C. R., Storrar, R. D., & Stroeven, A. P. (2018). Glacial geomorphological mapping: A review of approaches and frameworks for best practice. Earth-Science Reviews, 185, 806–846. https://doi.org/10.1016/j.earscirev.2018.07.015
- Christiansen, H. H., Sigsgaard, C., Humlum, O., Rasch, M., & Hansen, B. U. (2008). Permafrost and periglacial geomorphology at Zackenberg. Advances in Ecological Research, 40, 151–174. Academic Press. https://doi.org/10.1016/S0065-2504(07)00007-4
- Clague, J. J., & Evans, S. G. (2000). A review of catastrophic drainage of moraine-dammed lakes in British Columbia. Quaternary Science Reviews, 19(17–18), 1763–1783. https://doi.org/10.1016/S0277-3791(00)00090-1
- Cook, S. J., Kougkoulos, I., Edwards, L. A., Dortch, J., & Hoffmann, D. (2016). Glacier change and glacial lake outburst flood risk in the Bolivian Andes. The Cryosphere, 10, 2399–2413. https://doi.org/10.5194/tc-10-2399-2016
- COWI. (2015). Mapping Greenland’s Zackenberg Research Station. https://www.sensefly.com/app/uploads/2017/11/eBee_saves_day_mapping_greenlands_zackenberg_research_station.pdf
- Dietrich, J. T. (2016). Riverscape mapping with helicopter-based structure-from-motion photogrammetry. Geomorphology, 252, 144–157. https://doi.org/10.1016/j.geomorph.2015.05.008
- Docherty, C. L., Hannah, D. M., Riis, T., Rosenhøj Leth, S., & Milner, A. M. (2017). Large thermo-erosional tunnel for a river in northeast Greenland. Polar Science, 14, 83–87. https://doi.org/10.1016/j.polar.2017.08.001
- Dussaillant, A., Benito, G., Buytaert, W., Carling, P., Meier, C., & Espinoza, F. (2010). Repeated glacial-lake outburst floods in Patagonia: An increasing hazard? Natural Hazards, 54(2), 469–481. https://doi.org/10.1007/s11069-009-9479-8
- Emmer, A. (2017). Geomorphologically effective floods from moraine-dammed lakes in the Cordillera Blanca, Peru. Quaternary Science Reviews, 177, 220–234. https://doi.org/10.1016/j.quascirev.2017.10.028
- Emmer, A. (2018). GLOFs in the WOS: Bibliometrics, geographies and global trends of research on glacial lake outburst floods (Web of Science, 1979–2016). Natural Hazards and Earth System Sciences, 18(3), 813–827. https://doi.org/10.5194/nhess-18-813-2018
- Emmer, A., Vilímek, V., Huggel, C., Klimeš, J., & Schaub, Y. (2016). Limits and challenges to compiling and developing a database of glacial lake outburst floods. Landslides, 13(6), 1579–1584. https://doi.org/10.1007/s10346-016-0686-6
- Evans, D. J. A., Ewertowski, M., & Orton, C. (2016). Fláajökull (north lobe), Iceland: Active temperate piedmont lobe glacial landsystem. Journal of Maps, 12(5), 777–789. https://doi.org/10.1080/17445647.2015.1073185
- Gilbert, G. L., Cable, S., Thiel, C., Christiansen, H. H., & Elberling, B. (2017). Cryostratigraphy, sedimentology, and the late Quaternary evolution of the Zackenberg river delta, northeast Greenland. The Cryosphere, 11(3), 1265–1282. https://doi.org/10.5194/tc-11-1265-2017
- Hansen, B. U., Sigsgaard, C., Rasmussen, L., Cappelen, J., Hinkler, J., Mernild, S. H., Petersen, D., Tamstorf, M. P., Rasch, M., & Hasholt, B. (2008). Present-day climate at Zackenberg. Advances in Ecological Research, 40, 111–149. https://doi.org/10.1016/S0065-2504(07)00006-2
- Harrison, S., Glasser, N., Winchester, V., Haresign, E., Warren, C., & Jansson, K. (2006). A glacial lake outburst flood associated with recent mountain glacier retreat, Patagonian Andes. Holocene, 16(4), 611–620. https://doi.org/10.1191/0959683606hl957rr
- Harrison, S., Kargel, J. S., Huggel, C., Reynolds, J., Shugar, D. H., Betts, R. A., Emmer, A., Glasser, N., Haritashya, U. K., Klimeš, J., Reinhardt, L., Schaub, Y., Wiltshire, A., Regmi, D., & Vilímek, V. (2018). Climate change and the global pattern of moraine-dammed glacial lake outburst floods. The Cryosphere, 12(4), 1195–1209. https://doi.org/10.5194/tc-12-1195-2018
- Iribarren Anacona, P., Mackintosh, A., & Norton, K. P. (2015). Hazardous processes and events from glacier and permafrost areas: Lessons from the Chilean and Argentinean Andes. Earth Surface Processes and Landforms, 40(1), 2–21. https://doi.org/10.1002/esp.3524
- Jensen, L. M., Rasch, M., & Schmidt, N. M. (2013). Zackenberg Ecological Research Operations, 18th Annual Report, 2012.
- Kattelmann, R. (2003). Glacial lake outburst floods in the Nepal Himalaya: a manageable hazard? Natural Hazards, 28(1), 145–154. https://doi.org/10.1023/A:1021130101283
- Kroon, A., Abermann, J., Bendixen, M., Lund, M., Sigsgaard, C., Skov, K., & Hansen, B. U. (2017). Deltas, freshwater discharge, and waves along the Young Sound, NE Greenland. Ambio, 46(Suppl 1), 132–145. https://doi.org/10.1007/s13280-016-0869-3
- Reynolds, J. M. (1998). High-altitude glacial lake hazard assessment and mitigation: A Himalayan perspective. Geohazards in Engineering Geology, 15, 25–34. https://doi.org/10.1144/GSL.ENG.1998.015.01.03
- Roberts, M. J., Tweed, F. S., Russell, A. J., Knudsen, Ó, & Harris, T. D. (2003). Hydrologic and geomorphic effects of temporary ice-dammed lake formation during jökulhlaups. Earth Surface Processes and Landforms, 28(7), 723–737. https://doi.org/10.1002/esp.476
- Russell, A. J., Knight, P. G., & Van Dijk, T. A. G. P. (2001). Glacier surging as a control on the development of proglacial, fluvial landforms and deposits, Skei d ararsandur, Iceland. Global and Planetary Change, 28(1-4), 163–174. https://doi.org/10.1016/S0921-8181(00)00071-0
- Russell, A. J., Tweed, F. S., Roberts, M. J., Harris, T. D., Gudmundsson, M. T., Knudsen, Ó, & Marren, P. M. (2010). An unusual jökulhlaup resulting from subglacial volcanism, sólheimajökull, Iceland. Quaternary Science Reviews, 29(11), 1363–1381. https://doi.org/10.1016/j.quascirev.2010.02.023
- Skov, K., Hansen, B. U., Jansen, S., Mathiassen, F., Naamansen, M., Petersen, D., … Lund, M. (2017). Zackenberg basic: The ClimateBasis and GeoBasis programme.
- Slomka, J. M., & Utting, D. J. (2018). Glacial advance, occupation and retreat sediments associated with multi-stage ice-dammed lakes: north-central Alberta, Canada. Boreas, 47(1), 150–174. https://doi.org/10.1111/bor.12257
- Søndergaard, J., Tamstorf, M., Elberling, B., Larsen, M. M., Mylius, M. R., Lund, M., Abermann, J., & Rigét, F. (2015). Mercury exports from a high-Arctic river basin in northeast Greenland (74°N) largely controlled by glacial lake outburst floods. Science of The Total Environment, 514, 83–91. https://doi.org/10.1016/j.scitotenv.2015.01.097
- Srivastava, P., Kumar, A., Chaudhary, S., Meena, N., Sundriyal, Y. P., Rawat, S., Rana, N., Perumal, R. J., Bisht, P., Sharma, D., Agnihotri, R., Bagri, D. S., Juyal, N., Wasson, R. J., & Ziegler, A. D. (2017). Paleofloods records in Himalaya. Geomorphology, 284, 17–30. https://doi.org/10.1016/j.geomorph.2016.12.011
- Tamminga, A. D., Eaton, B. C., & Hugenholtz, C. H. (2015). UAS-based remote sensing of fluvial change following an extreme flood event. Earth Surface Processes and Landforms, 40(11), 1464–1476. https://doi.org/10.1002/esp.3728
- Tweed, F. S., & Russell, A. J. (1999). Controls on the formation and sudden drainage of glacier-impounded lakes: Implications for jökulhlaup characteristics. Progress in Physical Geography: Earth and Environment, 23(1), 79–110. https://doi.org/10.1177/030913339902300104
- Watanabe, T., Lamsal, D., & Ives, J. D. (2009). Evaluating the growth characteristics of a glacial lake and its degree of danger of outburst flooding: Imja glacier, Khumbu Himal, Nepal. Norsk Geografisk Tidsskrift - Norwegian Journal of Geography, 63(4), 255–267. https://doi.org/10.1080/00291950903368367
- Watanabe, T., & Rothacher, D. (1996). The 1994 Lugge Tsho glacial lake outburst flood, Bhutan Himalaya. Mountain Research and Development, 16(1), 77–81. https://doi.org/10.2307/3673897
- Westergaard-Nielsen, A., Lund, M., Schmidt, N. M., Skov, K., Rosello, J. C., Sigsgaard, C., & Jackowicz-Korczynski, M. (2018). Spatial data on: Allows for quantification of. In T. R. Christensen, & E. Topp-Jørgensen (Eds.), Greenland ecosystem Monitoring annual Report Cards 2017 (pp. 44–pp). Danish Centre for Environment and Energy, Aarhus University.
- Westoby, M. J., Glasser, N. F., Brasington, J., Hambrey, M. J., Quincey, D., & Reynolds, J. M. (2014a). Modelling outburst floods from moraine-dammed glacial lakes. Earth-Science Reviews, 134, 137–159. https://doi.org/10.1016/j.earscirev.2014.03.009
- Westoby, M. J., Glasser, N. F., Hambrey, M. J., Brasington, J., Reynolds, J. M., & Hassan, M. A. (2014b). Reconstructing historic glacial lake outburst floods through numerical modelling and geomorphological assessment: Extreme events in the Himalaya. Earth Surface Processes and Landforms, 39(12), 1675–1692. https://doi.org/10.1002/esp.3617
- Zaginaev, V., Ballesteros-Cánovas, J. A., Erokhin, S., Matov, E., Petrakov, D., & Stoffel, M. (2016). Reconstruction of glacial lake outburst floods in northern Tien Shan: Implications for hazard assessment. Geomorphology, 269, 75–84. https://doi.org/10.1016/j.geomorph.2016.06.028