
We live in tumultuous times – it is a common refrain for each new generation as the challenges of contemporary society impinge upon their worldview. There is always change and there is no change quite like how we experience it in the here and now and the way in which it disrupts our status quo.
Malthus was disturbed by population change and how it would implode the society he inhabited. His thesis – the Principle of Population (Citation1798) – espoused what became known as the Malthusian trap whereby growth in the supply of resources led to an increase in population so negating any boost to living standards. The so-called ‘limits to growth’ remain topical both for proponents and opponents.
So is the world we inhabit today any different? Potentially, in the sense that many of the social and physical systems we interact with operate at a global level and any perturbations to those systems reverberate and are felt locally. The global financial crash of 2008 sent shockwaves through markets that left an imprint worldwide. More pressingly, the anthropogenic acceleration of global climate change (CitationIPCC, 2014) is considered to already be impacting communities and may already be past the point of reversing the severest effects.
What these two examples show is the potential for dramatic change globally from variations within our internal social systems, as well as edge effects of the physical systems we interact with. For example, rising smartphone sales can lead to an increase in the mining of precious metals and a surge in the demand for electricity during their production. However, the reverse can also be true – the COVID-19 virus has impacted worker availability within Chinese factories causing a reduction in output.
Against his backdrop, the United Nations (UN) launched its Sustainable Development Goals (SDG; CitationUnited Nations, 2020a) in 2015 targeted at meeting the greatest challenges that face the world's populations. These follow on from the largely successful Millennium Development Goals (MDG; CitationUnited Nations, 2020b) that were advocated at the start of the new millennium. If you were to criticise then MDGs then it would be because they (almost) exclusively focused upon society and, specifically, inequality. The SDGs expand this focus into the environment with a greater number of aspirational goals that seek a reduction in inequality using development as the key tool to leverage change, but in a manner that is sustainable. If the eight MDGs seemed focused, then the 17 SDGs could perhaps be classed as comprehensive (Appendix 1).
Goals are just that – a state of affairs that we wish to achieve. For example, the first goal is
End poverty in all its forms everywhere
By 2030, eradicate extreme poverty for all people everywhere, currently measured as people living on less than $1.25 a day
Proportion of population below the international poverty line
That said, the press (e.g. CitationGalatsidas & Sheehy, 2015) were generally positive about the impacts made by the MDGs, whilst academic review also demonstrated positive impacts (e.g. CitationFukuda-Parr et al., 2014), albeit with caveats around variations arising from differences in local implementations and the distorting effect of poorly chosen indicators. For example, targets for reducing poverty were largely met through changes in just two countries: India and China.
In short, the MDGs resulted in genuine change and it is therefore possible that the SDGs also will. The framework is more complex and the measures are more extensive: communicating the outcomes will, therefore, be a significant task. CitationAttaran’s (2005) criticism of the MDGs in using some indicators that were immeasurable cuts to the core of the scientific process. You state a hypothesis, take repeated measurements of an experiment and use the outcomes to prove or disprove it. Except for the MDGs, the goal is not an unequivocal question, but a statement on the quality of life.
The target provides a quantitative definition, with the indicator showing how this is measured. Problems arise when the indicator is a simple proxy for the goal. For example, measuring poverty as living on less than $1.25 a day masks variations in living costs globally – poverty exists in Westernised countries, yet by this target would not be included. This can be exacerbated by the indicator selected and how the counting is undertaken. For poverty, this would require census data and then a mixture of economic summaries and self-reporting surveys, all undertaken at the country level before aggregation to a global summary. As CitationAttaran (2005) notes, the quality of reporting can be highly variable either because the data isn't available or the indicator is immeasurable.
The UN SDGs are important to global equality and for this reason, academic review of the efficacy of their foundation and ongoing impacts is vital in order to determine how effective they are. This begins with the discussion of the goals’ appropriateness: for example, whether there are too many and how focused they are. Underpinning all of these are the (interwoven) targets and indicators and any review of their utility, performance and outcomes requires some method of assessment. This will need to be statistical in order to provide a quantitative determination that is reproducible and verifiable. There is no discussion about the outcome, rather the meaning of the result and its implications.
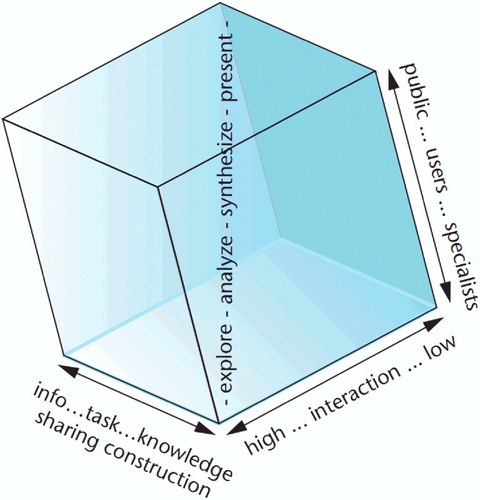
What the above discussion conceals is the critical importance of the visual display of SDG data. As CitationMacEachren et al. (2004) outline with their concept of ‘cartography cubed’ (), the production of maps ranges from the simple communication of a message underpinning data through to the interactive exploration of multi-dimensional datasets at a range of different spatial resolutions. The former graphically delivers a key message to the intended audience, whilst the latter allows interaction from a specialist in order to build understanding. What they both have in common is the power of graphics to present complex information and – more than that – the ability of the human visual system to comprehend difficult concepts, identify trends and make inferences. In short, vision trumps all the other senses (CitationMedina, 2014) and being able to correctly and effectively manipulate spatial data is a critical skill for researchers working with the SDGs. To be clear – it is spatial data that we are processing. As the adage goes, everything happens somewhere and it is geography that we are concerned with when working with the SDGs.
Figure 1. Four functions of geovisualization (modified from MacEachren et al., Citation2004): exploration, analysis, synthesis and presentation.
For this reason, it is the display of data around the SDGs that concerns me. Not because we cannot undertake the processing and analysis of complex spatial datasets, but that this capability is not anywhere near as embedded in universities, governments and non-governmental organisations (NGOs) as it needs to be. Cartography is ‘the art, science and technology of making and using maps’ (CitationICA, 2015) and research groups need to be able to combine quantitative analysis with graphic design in order to achieve a product that is greater than the sum of its parts. It is about understanding that geography, geographical information science and cartography underpin key elements of research design, data collection, data management, data analysis and visualisation. It is about building a complementary team who are competent and capable.
The Journal of Maps has a key role to play in this process by giving researchers the opportunity to present innovative maps of primary and secondary data that relate to the SDGs. Whilst populist in nature, CitationStimers et al. (2011) present maps relating to the Seven Deadly Sins in the US Midwest. It is interesting because the ‘sins’ are non-specific in the same way the SDGs are; the authors then proceed to develop metrics to map them. More specifically related to the SDGs, CitationCampbell and Sparks (2012) demonstrate the impact of changing the way poverty is estimated at a national scale, enabling the extraction of the finest detail possible. At the other extreme, CitationHall et al. (2008) use global poverty estimates which are necessarily generalised.
These examples demonstrate the importance that the analysis and presentation of results play in the transparent review of socio-economic data. The implications for reviewing the SDGs are profound and the Journal of Maps, therefore, has a central role to play in this process.
If we want to use the SDGs as a vehicle for global change then we need to be able to effectively assess their impact and communicate the outcomes widely. Maps have a significant role to play in this process and it is implicit upon us – the global academic community of researchers and practitioners – to use the tools at our disposal to the best of our abilities.
References
- Attaran, A. (2005). An immeasurable crisis? A criticism of the millennium development goals and why they cannot be measured. PLoS Med , 2 (10), e318. https://doi.org/10.1371/journal.pmed.0020318
- Campbell, J. J. A. , & Sparks, C. (2012). County-level poverty estimates for the contiguous United States, 2001, 2005. Journal of Maps , 8 (4), 334–339. https://doi.org/10.1080/17445647.2012.751061
- Fukuda-Parr, S. , Yamin, A.E. and Greenstein, J. (2014) The power of numbers: a critical review of millennium development goal targets for human development and human rights. Journal of Human Development and Capabilities , 15(2–3), 105-117, https://doi.org/10.1080/19452829.2013.864622
- Galatsidas, A. , & Sheehy, F. (2015, July 6). What have the millennium development goals achieved? The Guardian. Retrieved February 20, 2020 from, https://www.theguardian.com/global-development/datablog/2015/jul/06/what-millennium-development-goals-achieved-mdgs .
- Hall, O. , Duit, A. , & Caballero, L. N. C. (2008). World poverty, environmental vulnerability and population at risk for natural hazards. Journal of Maps , 4 (1), 151–160. https://doi.org/10.4113/jom.2008.95
- ICA . (2015). Definitions. Retrieved October, 20 2015, from http://icaci.org/mission/ .
- Intergovernmental Panel on Climate Change . (2014). Sixth assessment report climate change 2021: The physical science basis . Cambridge University Press.
- MacEachren, A. M. , Gahegan, M. , Pike, W. , Brewer, I. , Cai, G. , Lengerich, E. , & Hardistry, F. (2004). Geovisualization for knowledge construction and decision support. Computer Graphics and Applications , 24 (1), 13–17.
- Malthus, T. R. (1798). An essay on the principle of population, as it affects the future improvement of society, with remarks on the speculations of Mr. Godwin, M. Condorcet, and other writers . J. Johnson.
- Medina, J. (2014). Brain rules (2nd ed.). Pear Press.
- Stimers, M. , Bergstrom, R. , Vought, T. , & Dulin, M. (2011). Capital Vice in the Midwest: The spatial distribution of the seven deadly sins. Journal of Maps , 7 (1), 9–17. https://doi.org/10.4113/jom.2011.1133
- United Nations . (2020a). About the sustainable development goals. Retrieved February 20, 2020, from https://www.un.org/sustainabledevelopment/sustainable-development-goals/
- United Nations . (2020b). We can end poverty: Millennium development goals and beyond 2015. Retrieved February 20, 2020, from https://www.un.org/millenniumgoals/
- United Nations . (2020c). SDG indicators. Retrieved February 20, 2020, from https://unstats.un.org/sdgs/indicators/database
Appendix
GOAL 1: End poverty in all its forms everywhere
GOAL 2: End hunger, achieve food security and improved nutrition and promote sustainable agriculture
GOAL 3: Ensure healthy lives and promote well-being for all at all ages
GOAL 4: Ensure inclusive and equitable quality education and promote lifelong learning opportunities for all
GOAL 5: Achieve gender equality and empower all women and girls
GOAL 6: Ensure availability and sustainable management of water and sanitation for all
GOAL 7: Ensure access to affordable, reliable, sustainable and modern energy for all
GOAL 8: Promote sustained, inclusive and sustainable economic growth, full and productive employment and decent work for all
GOAL 9: Build resilient infrastructure, promote inclusive and sustainable industrialisation and foster innovation
GOAL 10: Reduce inequality within and among countries
GOAL 11: Make cities and human settlements inclusive, safe, resilient and sustainable
GOAL 12: Ensure sustainable consumption and production patterns
GOAL 13: Take urgent action to combat climate change and its impacts
GOAL 14: Conserve and sustainably use the oceans, seas and marine resources for sustainable development
GOAL 15: Protect, restore and promote sustainable use of terrestrial ecosystems, sustainably manage forests, combat desertification, and halt and reverse land degradation and halt biodiversity loss
GOAL 16: Promote peaceful and inclusive societies for sustainable development, provide access to justice for all and build effective, accountable and inclusive institutions at all levels
GOAL 17: Strengthen the means of implementation and revitalise the Global Partnership for Sustainable Development