
 ?Mathematical formulae have been encoded as MathML and are displayed in this HTML version using MathJax in order to improve their display. Uncheck the box to turn MathJax off. This feature requires Javascript. Click on a formula to zoom.
ABSTRACT
This paper illustrates a land consumption map for Italy (year 2017) at a scale 1:1,300,000, and the assessment of its changes (2012–2017). We define land consumption as the replacement of a non-artificial land cover to an artificial land cover, both permanent and no-permanent. The maps are a 10 m spatial resolution raster, produced by photointerpretation of very high resolution images and semiautomatic classification of high resolution remote sensing images. An overall accuracy of 97.7% for the map of 2012 and of 99.66% for the map of 2017 was obtained. The results suggest that the method proposed is appropriate to detect land consumption, both for the urban densification and for the sprawling phenomena, from national to local level. Furthermore, because of the high spatial resolution and the classification scheme adopted, it is suitable for an effective monitoring system, compared to other existing classification systems or monitoring programs.
1. Introduction
After World War II, massive urbanization, industrialization and infrastructure development determined many landscape changes, both in terms of land use and land cover (CitationLambin & Geist, 2006). Land use is defined as territory characterised according to its current and future planned functional dimension or socio-economic purpose (e.g. residential, industrial, commercial, agricultural, forestry, recreational) (CitationEC, 2013a). It is the description of land in terms or its socio-economic and ecological purpose. Land cover data provides a description of the surface of the earth by its biophysical characteristics, including the vegetation, bare soil, open bodies of water and artificial surfaces that can be observed by any earth observation platform (CitationEC, 2013b).
Land use and land cover changes dynamics, from local to global, involve important ecological consequences, such as loss of high-quality agricultural land, increased risk of flooding, biodiversity loss and effects on climate changes, having effects also in terms of soil resources depletion (CitationBurghardt, 2006; CitationCeccarelli et al., 2014; CitationHaase & Nuissl, 2007; CitationHenry & Dicks, 1987; CitationMontanarella, 2007).
Soil can be considered one of the most important non-renewable resource since its major role in many ecosystem functions (e.g. biomass production, filtration and transformation of many substances, habitat provision, cultural and historic function) and the slow process of formation (CitationAdhikari & Hartemink, 2016; CitationMEA, 2005). Increasing the awareness of policymakers on the importance of monitoring this resource is a crucial objective.
Although a specific soil protection legislation is not in place in the EU, the 2006 Soil Thematic Strategy (CitationEC, 2006) promoted the inclusion of soil protection measures in different policy areas. This strategy emphasized prevention of further land degradation and maintenance of its functions, underlining the need to implement good practices to reduce the negative effects of land use and, in particular, its most obvious and irreversible form: soil sealing. Soil sealing, is defined as the constant covering of an area land and its soil with artificial waterproof materials, such as asphalt and cement (CitationSWD, 2012).
While the European Commission in May 2014 decided to withdraw the proposal for a Soil Framework Directive, the Seventh Environment Action Programme (CitationEU, 2013), which entered into force on 17 January 2014, recognizes that soil degradation is a serious challenge. It provides that by 2020 land is managed sustainably.
Furthermore, the Commission had already considered it useful to indicate the priorities for action and the guidelines to be followed in order to achieve no net land take by 2050 by publishing guidelines for limiting, mitigating and compensating the soil sealing (CitationEC, 2012).
In addition, the United Nations Conference on Sustainable Development in 2012, published the final report ‘The future that we want’ (CitationUN, 2012) in which invited national governments to intervene to ensure greater attention to the decisions regarding land use, at all levels of relevance, with respect to the environmental, social and economic impacts which generate land degradation.
Later the United Nations Global Agenda for Sustainable Development (CitationUN, 2015), defined the Sustainable Development Goals (SDGs) and indicated, among others, some targets of particular interest for land and soil, to be integrated into national short- and medium-term programs and to be achieved by 2030.
Finally, the European Commission publishes ‘The Future Brief: No net land take by 2050?’ (CitationEC, 2016) focusing on how land and soil could be used efficiently to continue to provide functions and ecosystem services for generations to come.
In Italy, the National Strategy for Sustainable Development 2017–2030 is the mean for the implementation of the 2030 Agenda. However, as in Europe there is a lack of a soil framework directive, even in Italy the Parliament has not yet approved a law that aims to protect the soil from its progressive artificial cover. Currently (year 2019), a law to limit land consumption is under discussion in the Parliament.
Within this context, monitoring land consumption is a paramount requirement for defining effective policies and sustainable planning. An efficient land consumption monitoring strategy allows to quantify land changes, detect trends and adopt appropriate development policies.
Following the definition of the CitationUN-Habitat (2019) land consumption is defined as the uptake of land by urbanized land uses. It often involves conversion of land from other uses to urban functions.
Another definition of artificial land cover comprises all the surfaces where landscape has been modified or influenced by human construction activities (replacing natural surfaces with artificial constructions or artificial materials), including settlements within rural areas. Therefore, urban greenery is vegetation and it is not considered artificial land cover (CitationEAGLE, 2019).
In a more general sense, land consumption can be considered the change from a non-artificial land cover to an artificial land cover of the ground, with the distinction between permanent land consumption (due to permanent artificial cover) (CitationEC, 2012) and no-permanent land consumption (due to a reversible artificial cover) (CitationISPRA, 2018).
In the last decades, following the boost of technological and methodological progresses in the remote sensing sector, the investigation on land consumption received remarkable attention, especially in the field of impervious surfaces detection (e.g. CitationLu et al., 2011; CitationSmiraglia et al., 2014; CitationStathakis et al., 2012; CitationWu, 2009).
Estimation of land consumption represents a fundamental step for the landscape change analysis, in particular, all the ecosystem services related to soil need the information of land use and land cover change as a primary input, giving its main role in affecting major ecological processes, including soil erosion, exchange of energy and water cycling (CitationFu et al., 2015; CitationKibblewhite et al., 2007; CitationManna et al., 2017).
Some of the limitations of the existing land cover dataset are related both to the spatial resolution and to the classification adopted (CitationSmiraglia et al., 2014). In most classification systems, a clear distinction between land use and land cover is lacking, giving rise to hybrid classifications (CitationSallustio et al., 2016). For example, in the Corine Land Cover (CLC) inventory, land use and land cover are often confused within mixed classes and this data are not properly suitable to detect land consumption. Moreover, artificial areas class, with a minimum mapping unit of 25 hectares, may comprise also portions of vegetated areas, while infrastructures and isolated or dispersed buildings are not mapped.
For these reasons, dedicated and detailed tools are needed to overcome the ambiguity and diversity of trends shown by the current available tools at European level such as CLC and Land Use/Cover Area frame Survey (LUCAS). Moreover, these data sets do not provide a reliable accuracy for a comparison of small territories (CitationDecoville & Schneider, 2016) such as Italian municipalities, which is rather the study scale of urban planning.
Once the definition has been established it is clear that a robust and unique definition of land consumption should include a land cover perspective rather than a land use one. The European Union is developing new datasets in the framework of Copernicus Land Monitoring Services (CLMS); in particular new products will be developed based on a conceptual framework from EIONET EAGLE group (Action Group on Land monitoring in Europe) that will provide the basis for meeting users’ requests on land cover/land use information for the next 15 years. The data model proposed by the EAGLE group is based on the definition of three blocks, in order to provide a tool that allows to completely separate land use and land cover definitions, always encouraging integration between data as much as possible.
Among Copernicus products there are the High Resolution Layers (HRLs), which are raster maps (20 m resolution) for the following environmental issues: Imperviousness, Forest, Grassland, Water and Wetness. The Imperviousness product is the specific product to monitor soil sealing.
The layer Imperviousness Degree (IMD), with temporal resolution of three years and minimum 90% user’s/producer’s accuracy, is based on a definition of land consumption that refers to the concept of impermeable covering of land according to a gradient of impermeability ranging from 0 to 100. Imperviousness means all areas covered by buildings, impermeable surfaces contained within permeable areas (parks, gardens private, cemeteries, campsites), road structure, photovoltaic parks, surfaces covered with permanent plastic, etc. Other no-permanent artificial surfaces are not considered in the Imperviousness layer.
The Italian Institute for Environmental Protection and Research (ISPRA) is responsible for a monitoring program on land consumption producing national maps with a spatial resolution of 10 m updated every year. These land consumption maps and the Copernicus Imperviousness layer are different not only in terms of spatial and temporal resolution and accuracy, but also in class definition. The Copernicus satellite images with 10 meters spatial resolution, such as the four bands of Sentinel-2, integrated with photointerpretation of national orthophotos, allows for a detailed investigation of artificial land covers recognizing more classes than the existing classification systems, and to reach a suitable minimum mapping unit useful to detect land consumption changes. ISPRA’s products include also other artificial surfaces contributing to soil depletion such as unpaved parking, dumps, quarries, and railways lines, considering the ‘land consumption’ in a thorough meaning encompassing permanent and no-permanent altered surfaces due to anthropogenic pressure (CitationISPRA, 2018).
The aims of this paper are therefore (i) to present a map at a 1:1,300,000 scale illustrating the extension of land consumption in Italy in 2017 with a 10 m resolution, and (ii) an assessment of land consumption rate in Italy from 2012, when the first national land consumption map was produced, to 2017.
2. Study area
The Italian peninsula is located in the middle of the Mediterranean basin between 47°05′ N – 35°29′ N and 6°37′ E – 18°31′ E (Main Map), and has a surface of about 300,000 km2. Italy is separated from Europe by the Alps and the peninsula is divided longitudinally by the Apennines mountain range. It is composed of about 23% of flat zones (up to 300 m a.s.l.), 42% of hilly areas (between 300 and 700 m a.s.l.), and 35% of mountains (above 700 m a.s.l.) and has a long coastline of about 7500 km including islands. The country is divided into 20 administrative regions with important regional disparities in economic growth, settlement development and natural resource distribution (CitationSalvati et al., 2015).
3. Data and methods
The national land consumption map for the year 2012 was generated using RapidEye imagery whereas, given the data availability from 2015, Sentinel-1 and Sentinel-2 data were used to produce the land consumption map for the year 2017. RapidEye is a constellation of satellites providing 5 bands (Blue, Green, Red, NIR and Red Edge) with 5 m pixel size. These bands have proved to be useful for urban studies and for the identification of vegetation (CitationTigges et al., 2013). The Sentinel-2 Multispectral Instrument (MSI) samples 13 spectral bands: four bands at 10 m, six bands at 20 m and three bands at 60 m spatial resolution. shows the technical specification of the bands.
Table 1. Sentinel-2 and RapidEye bands technical specification.
Sentinel-1 is an imaging radar mission providing continuous all-weather, day-and-night imagery at C-band. Built-up areas, like buildings, are typically characterized by high backscattering values: urban areas do not significantly change within short time and therefore they can be easily recognized in the multitemporal images stacks.
In addition, to improve the detection of consumed land, ancillary data were used; e.g. to enhance the classification of roads, the free and open data OpenStreetMap (year 2012) was used as ancillary information.
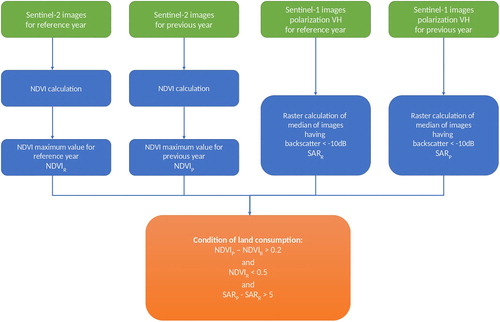
The production methodology () integrates multispectral and SAR images, vegetation index extraction (i.e. Normalized Difference Vegetation Index), and photointerpretation according to the phases described hereafter.
Figure 1. Workflow of the methodology for producing the land consumption map.
3.1. Classification of land consumption
The national land consumption map for the year 2012 (10 m resolution) is a product derived from a first classification, performed by ISPRA in collaboration with Planetek Italia s.r.l. and which is not presented in this paper (CitationISPRA, 2014). It was derived from the semiautomatic classification of RapidEye imagery (5 m resolution) acquired in 2011 and 2012 covering the Italian territory, provided from ESA (https://earth.esa.int/web/guest/missions/3rd-party-missions/current-missions/rapideye). To produce the map, the Maximum Likelihood classification algorithm was performed using the five available wavebands of RapidEye imagery and collecting training data of impervious surfaces derived from visual interpretation (CitationISPRA, 2015); considering that each RapidEye image has 77 km wide swath, dozens of tiles were processed separately to cover the whole territory, thus collecting a variable number of training areas per tile (from a few to hundreds).
Moreover, ancillary data available at the regional level were used, such as regional land cover and land use databases, and OpenStreetMap data to improve the identification of roads (CitationISPRA, 2015).
The national land consumption map for the year 2012 presented in this paper (available at http://groupware.sinanet.isprambiente.it/uso-copertura-e-consumo-di-suolo/library/consumo-di-suolo/carta-nazionale-consumo-suolo-2012), is the result of pixel resampling (from 5 m to 10 m) and intensive manual editing in order to correct omission errors and to improve classification accuracy.
3.2. Spectral indices
Sentinel-2 images were used for the calculation of spectral indices in order to ease the photointerpretation of land cover changes, and update the land consumption maps of the following years.
The Normalized Difference Vegetation Index (NDVI) is a very important spectral index commonly used for monitoring vegetation dynamics (CitationBhandaria et al., 2012; CitationFensholt et al., 2012; CitationJeong et al., 2011; CitationViana et al., 2019) because it is a reliable indicator of plant biomass (CitationGlenn et al., 2008).
It is computed by measuring the difference between near-infrared (which vegetation strongly reflects) and red light (which vegetation absorbs) as shown below by the formula:NDVI ranges from −1 to +1 where negative values indicate non-vegetated areas, positive low values refer to sparsely vegetated zones and values close to 1 indicate densely vegetated zones.
For every Sentinel-2 tile, NDVI was calculated for every image acquired in a year; therefore, the maximum value per pixel was calculated for each year, obtaining rasters of maximum NDVI.
The difference between the two maximum NDVI rasters of the reference year and the previous year was calculated in order to assess the possible land consumption changes, assuming that land consumption caused a decrease of the NDVI values due to the removal of vegetation cover. The NDVI difference raster was compared to a threshold value, in order to extract pixels of potential changes. Pixels above the threshold of 0.2 were considered as possible changes, if the NDVI of the reference year was below 0.5 (). These thresholds allows for removing false positive changes due to drier seasons in the reference year; nevertheless false-positive changes can occur for agricultural fields without vegetation such as plowed land or land at rest.
To enhance the reliability of the results, Sentinel-1 images have been employed too. Areas with low NDVI values could be artificial or simply bare soil. Using a threshold on SAR backscatter of VH polarization it is possible to determine if those areas are bare soil or urban areas making possible to mask out from the map of changes only the bare soil areas. The median backscatter was calculated and a threshold lower than −10 dB was applied for the reference year and the previous year. Therefore, if the difference between the two medians resulted greater than 5, the pixels were considered as possible land consumption ().
3.3. Photointerpretation of changes
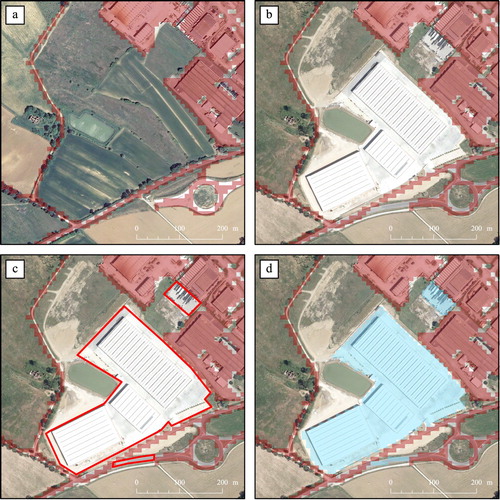
The manual photointerpretation was carried out for the year 2017 editing vector polygons at a detailed scale (greater than 1:5,000, MMU 100 sq m) based on the mosaics of Sentinel-2, national orthophotos and other free VHR satellite images (e.g. through Google Earth or Bing services). The data refer to the period between March and July. This choice supports the identification of land consumption (and the distinction from the bare soil) because in this period the vegetation is more evident. Then the data were converted into raster format (10 m spatial resolution) by attributing the class to each pixel based on the prevalent coverage that falls within it ().
Figure 2. Process of photointerpretation: (a) area of interest at 2012, (b) change 2012–2017, (c) manual interpretation of vector data, (d) conversion of the new land consumption polygon in raster.
The classification nomenclature adopted follows a hierarchical scheme on three levels (). The third level defines different kinds of permanent and reversible land consumption and it is ensured for all changes in areas with very high-resolution image availability. The first and second level were used in other cases where the image spatial resolution was not adequate.
Table 2. Legend of the land consumption classification.
The final maps are the product of a binary classification (consumed land/not-consumed land) having 10 m spatial resolution, allowing for the accurate estimation of land consumption at the local level and for the whole national territory (CitationCongedo et al., 2017). The map projection is UTM Zone 32N, Datum WGS84.
3.4. Accuracy assessment
The accuracies of the two land consumption maps (2012 and 2017) were evaluated calculating confusion matrices. The validation of the 2012 map was performed using the ISPRA national and regional land consumption monitoring network, consisting of 190,000 points. From the network, a stratified random sample of 40,000 points was extracted and classified according to the first level of the classification system (consumed or not consumed land) through photo-interpretation of very high-resolution images (CitationISPRA, 2016). The comparison of the classification map (5 m resolution) to the sample points was performed with the process of extracting values from raster pixels. Regarding the map of 2017, the validation approach was focused on area samples, selecting 10 cells of 1 km2 of area using a grid reference with regular square cell. A total of 200 cells were randomly selected and distributed evenly in each region. The sampled areas were photointerpreted through high-resolution images using the method described in Section 3.3. Commission and omission errors were classified and considered in the assessment of the accuracy.
4. Results
Regarding the land consumption map of the year 2012, the comparison of sample points to the expanded map resulted in an overall accuracy of 97.7%, with an omission error of 19.6% and a commission error of 21.7%.
Regarding the land consumption map of the year 2017, the overall accuracy performed with the area samples was 99.7%, with all regions above 98.5% and with an error of omission between 0.22 and 1.49% and a commission error which turns out to be between 0.15 and 2.14% ().
Table 3. Accuracy assessment of the land consumption map (year 2017).
The Main Map shows the distribution of consumed land at the national level for the year 2017 (7.65% of the national surface). From 2012 to 2017 the consumed land in Italy increased by about 1% () amounting to a total of 23,063 square kilometers of the Italian territory with a net growth from 2012 of 24,881 hectares ().
Figure 3. A detail of the 2012 land consumption map and example of changes occurred between 2012 and 2017.
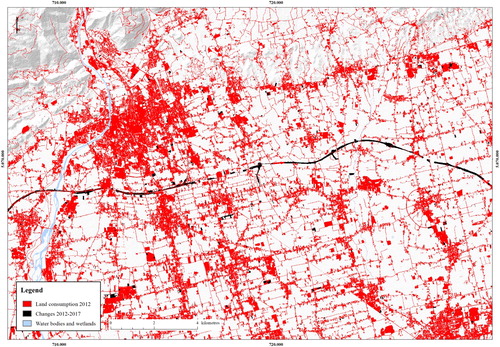
Table 4. Land consumption at national and regional level from 2012 to 2017.
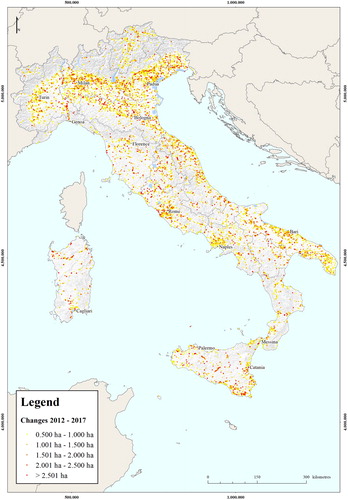
As shown in the areas most affected are the plains: the Po plain, the Tuscan area along the axis between Florence and Pisa, and the plains of Lazio, Campania and Puglia regions. Also, the main metropolitan areas show the new consumption of soil in the study period. Coastal areas, in particular those bordering the Adriatic Sea and the Liguria, Campania and Sicily regions, albeit with a lesser extent, are one of the most vulnerable areas that has been affected. By contrast, the areas with least land consumption are those in which the geomorphological characteristics represent a major obstacle to the spread of urbanization, principally the mountainous areas.
Figure 4. Map of changes occurred between 2012 and 2017 with extent greater than 0.5 ha.
At the regional level () the most affected region by the land consumption is Lombardia with almost 13% of its land that turns out to be consumed, followed by Veneto (12.35%) and Campania (10.36%). Analyzing the relative variations, Puglia and Basilicata have been the regions with a greater increase (1.53% and 1.44% increasing in soil sealed from 2012 to 2017). The changes in regional land consumption ranges between 0.37% and 1.53% showing a positive trend of this process in the 5 year period.
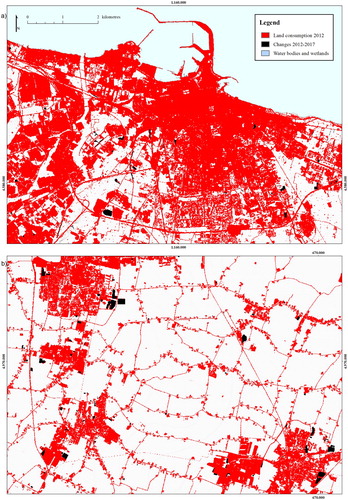
At the local level, urban morphological trends and expansions patterns can be distinguished. shows two examples of urban densification (a) and urban sprawling (b) giving evidence of the effectiveness of the method in the detection of both compact city and diffused urban agglomeration.
Figure 5. Examples of urban densification (a) and urban sprawling (b).
A few cities are illustrated in detail in the Main Map (Turin, Milan, Padua, Rome, Naples) in order to appreciate the spatial resolution and the potential use of the map for urban planning purposes.
5. Conclusions
The need to protect the soil to halt land degradation has been widely recognized both at the European and global level. In such a view, the proposed method provides accurate land consumption maps, from national to local level, compared to other classification systems or monitoring programs.
The classification system adopted enables to monitor also the non-permanent artificial surfaces which are focal areas where effective measures to contain soil loss can be implemented. Therefore, the definition adopted for land consumption mapping is in line with what is suggested at the European level and improves monitoring operations with the production of national data consistent with the requests of the EU. Such approach, combined with the spatial resolution of 10 meters of Sentinel-2 products, allows to overcome the limits linked to classification systems and coarse minimum mapping units insufficient to detect land consumption changes.
The Sentinel satellite images are found to be useful in monitoring land consumption due to the very high spatial and temporal resolution, and the free access of data. This is important from the perspective of a frequent and cost-efficient monitoring of the dynamics of land consumption.
Furthermore, the proposed monitoring methodology allows to identify the changes both of the expansion of the urban areas and those that occurred in the consolidated city. For example, the process of urban densification, the new artificial cover of the soil within an urban area, represents a form and an increase in land consumption that would not be counted in monitoring operations that use classification typologies based only on land use. Likewise, the urban fabric produced by sprawl and sprinkling phenomena (CitationRomano et al., 2017) would also escape in many cases, not falling into areas destined for urbanization or not reaching spatial dimensions definable as such. The representation of land consumption is, therefore, given by the growing set of areas artificially covered but not necessarily only in urban areas.
The Main Map and the other products provided in this paper fulfill a wide range of landscape issues considering their relevance for further spatial analyses assessing the effect of land consumption on the environment, such as the evaluation of land vulnerability, as well as monitoring land capability or biodiversity threats recognition. Such information could be relevant for landscape planning, supporting urban strategies aimed to contain land consumption and able to put together environmental sustainability and future urban development.
Software
QGIS 3.4 was used for the land consumption classification process and ArcGIS 10.2 was used for the Main Map production.
Supplemental Material
Download PDF (28.5 MB)Data availability statement
The data that support the findings of this study are openly available at http://groupware.sinanet.isprambiente.it/uso-copertura-e-consumo-di-suolo/library/consumo-di-suolo/
Disclosure statement
No potential conflict of interest was reported by the author(s).
Additional information
Funding
References
- Adhikari, K., & Hartemink, A. E. (2016). Linking soils to ecosystem services – a global review. Geoderma, 262, 101–111. doi.org/10.1016/j.geoderma.2015.08.009
- Bhandaria, A. K., Kumara, A., & Singhb, G. K. (2012). Feature extraction using normalized difference vegetation index (NDVI): A case study of Jabalpur city. Procedia Technology, 6, 612–621. https://doi.org/10.1016/j.protcy.2012.10.074
- Burghardt, W. (2006). Soil sealing and soil properties related to sealing. In E. Frossard, W. E. H. Blum, & B. P. Warkentin (Eds.), Function of soils for human societies and the environment (pp. 117–124). Special Publications 266, The Geological Society.
- Ceccarelli, T., Bajocco, S., Perini, L., & Salvati, L. (2014). Urbanisation and land take of high quality agricultural soils – exploring long-term land use changes and land capability in Northern Italy. International Journal of Environmental Research, 8(1), 181–192. https://doi.org/10.22059/IJER.2014.707.
- Congedo, L., Marinosci, I., Riitano, N., Strollo, A., De Fioravante, P., & Munafò, M. (2017). Monitoring of land consumption: An analysis of loss of natural and agricultural areas in Italy. Annali di Botanica, 7, 1–9. https://doi.org/10.4462/annbotrm-13843
- Decoville, A., & Schneider, M. (2016). Can the 2050 zero land take objective of the EU be reliably monitored? A comparative study. Journal of Land Use Science, 11(3), 331–349. https://doi.org/10.1080/1747423X.2014.994567
- EAGLE, 2019. Artificial surfaces and constructions. EAGLE reference manuals. Retrieved April 19, 2019, from https://land.copernicus.eu/eagle/content-documentation-of-the-eagle-concept/manual/content-documentation-of-the-eagle-concept/b-thematic-content-and-definitions-of-eagle-model-elements/part-i-land-cover-components/1-abiotic-non-vegetated-surfaces-and-objects/1-1-artificial-surfaces-and-constructions
- EC. (2006). Soil thematic strategy. COM(2006) 231. Bruxelles, 22.9.2006.
- EC. (2012). Guidelines on best practice to limit, mitigate or compensate soil sealing. Bruxelles, 15.5.2012, SWD (2012) 101.
- EC. (2013a). Data specification on land use – technical guidelines. D2.8.III.4. https://inspire.ec.europa.eu/id/document/tg/lu
- EC. (2013b). Data specification on land cover – technical guidelines. D2.8.II.2. https://inspire.ec.europa.eu/id/document/tg/lc
- EC. (2016). Future brief: No net land take by 2050? April 2016.
- EU. (2013). Decision No 1386/2013/EU of the European Parliament and of the Council.
- Fensholt, R., Langanke, T., Rasmussen, K., Reenberg, A., Prince, S. D., Tucker, C. J., Scholes, R. J., Le, Q. B., Bondeau, A., Eastman, R., Epstein, H., Gaughan, A. E., Hellden, U., Mbow, C., Olsson, L., Paruelo, J., Schweitzer, C., Seaquist, J., & Wessels, K. (2012). Greenness in semi-arid areas across the globe 1981–2007 – an earth observing satellite based analysis of trends and drivers. Remote Sensing of Environment, 121, 144–158. https://doi.org/10.1016/j.rse.2012.01.017
- Fu, B., Zhang, L., Xu, Z., Zhao, Y., Wei, Y., & Skinner, D. (2015). Ecosystem services in changing land use. Journal of Soils and Sediments, 15(4), 833–843. https://doi.org/10.1007/s11368-015-1082-x
- Glenn, E. P., Huete, A. R., Nagler, P. L., & Nelson, S. G. (2008). Relationship between remotely-sensed vegetation indices, canopy attributes and plant physiological processes: What vegetation indices can and cannot tell us about the landscape. Sensors, 8(4), 2136–2160. https://doi.org/10.3390/s8042136
- Haase, D., & Nuissl, H. (2007). Does urban sprawl drive changes in the water balance and policy? The case of Leipzig (Germany) 1870–2003. Landscape and Urban Planning, 80(1–2), 1–13. https://doi.org/10.1016/j.landurbplan.2006.03.011
- Henry, J. A., & Dicks, S. E. (1987). Association of urban temperatures with land use and surface materials. Landscape and Urban Planning, 14, 21–29. https://doi.org/10.1016/0169-2046(87)90003-X
- ISPRA. (2014). Il consumo di suolo in Italia. Rapporti 195/2014. ISBN 978-88-448-0646-0. ISPRA.
- ISPRA. (2015). Il consumo di suolo in Italia. Rapporti 218/2015. ISBN 978-88-448-0703-0. ISPRA.
- ISPRA. (2016). Consumo di suolo, dinamiche territoriali e servizi ecosistemici. Rapporti 248/2016. ISBN 978-88-448-0776-4. ISPRA.
- ISPRA. (2018). Consumo di suolo, dinamiche territoriali e servizi ecosistemici. Rapporti 288/2018. ISBN: 978-88-448-0902-7. ISPRA.
- Jeong, S. J., Ho, C. H., Gim, H. J., & Brown, M. E. (2011). Phenology shifts at start vs. end of growing season in temperate vegetation over the Northern Hemisphere for the period 1982–2008. Global Change Biology, 17(7), 2385–2399. https://doi.org/10.1111/j.1365-2486.2011.02397.x
- Kibblewhite, M., Rubio, J.-L., Kosmas, C., Jones, R., Arrouays, D., Huber, S., & Verheijen, F. (2007, 3–14 September). Environmental assessment of soil for monitoring desertification in Europe. In Eighth Session of the Conference of the Parties (COP 8) to the United Nations Convention to Combat Desertification (UNCCD), Madrid, ISBN 1-871315-97-2, Cranfield UK.
- Lambin, E. F., & Geist, H. (2006). Land-use and land cover change: Local processes and global impacts. Springer.
- Lu, D., Hetrick, S., & Moran, E. (2011). Impervious surface mapping with Quickbird imagery. International Journal of Remote Sensing, 32(9), 2519–2533. https://doi.org/10.1080/01431161003698393
- Manna, P., Basile, A., Bonfante, A., D’Antonio, A., De Michele, C., Iamarino, M., Langella, G., Mileti, A. F., Pileri, P., Vingiani, S., & Terribile, F. (2017). Soil sealing: Quantifying impacts on soil functions by a geospatial decision support system. Land Degradation & Development, 28(8), 2513–2526. https://doi.org/10.1002/ldr.2802
- MEA (Millennium Ecosystem Assessment). (2005). Ecosystems and human well being synthesis. Island Press.
- Montanarella, L. (2007). Trends in land degradation in Europe. In M. V. K. Sivakumar & N. Ndiang’ui (Eds.), Climate and land degradation (pp. 83–104). Springer.
- Romano, B., Zullo, F., Fiorini, L., Marucci, A., & Ciabò, S. (2017). Land transformation of Italy due to half a century of urbanization. Land Use Policy, 67, 387–400. https://doi.org/10.1016/j.landusepol.2017.06.006
- Sallustio, L., Munafò, M., Riitano, N., Lasserre, B., Fattorini, L., & Marchetti, M. (2016). Integration of land use and land cover inventories for landscape management and planning in Italy. Environmental Monitoring and Assessment, 188(1), 1–20. https://doi.org/10.1007/s10661-015-5056-7
- Salvati, L., Smiraglia, D., Ceccarelli, T., Bajocco, S., & Perini, L. (2015). Planning for sustainable agro-forest systems: Protected areas and soil degradation hotspots in Italy (1990–2010). Soil Science and Plant Nutrition, 61(3), 404–413. https://doi.org/10.1080/00380768.2014.978729
- Smiraglia, D., Rinaldo, S., Ceccarelli, T., Bajocco, S., Salvati, L., Ricotta, C., & Perini, L. (2014). A cost-effective approach for improving the quality of soil sealing change detection from landsat imagery. European Journal of Remote Sensing, 47(1), 805–819. https://doi.org/10.5721/EuJRS20144746
- Stathakis, D., Perakis, K., & Savin, I. (2012). Efficient segmentation of urban areas by the VIBI. International Journal of Remote Sensing, 33(20), 6361–6377. https://doi.org/10.1080/01431161.2012.687842
- SWD 101 final/2. (2012). Commission staff working document. Guidelines on best practice to limit, mitigate or compensate soil sealing. http://ec.europa.eu/environment/soil/pdf/soil_sealing_guidelines_en.pdf
- Tigges, J., Lakes, T., & Hostert, P. (2013). Urban vegetation classification: Benefits of multitemporal RapidEye satellite data. Remote Sensing of Environment, 136, 66–75. https://doi.org/10.1016/j.rse.2013.05.001
- UN. (2012). The Future We Want. A/RES/66/288, United Nations. http://www.un.org/en/development/desa/population/migration/generalassembly/docs/globalcompact/A_RES_66_288.pdf
- UN. (2015). Transforming our world: The 2030 Agenda for sustainable development. A/RES/70/1. United Nations.
- UN-Habitat. (2019). Metadata on SDGs indicator 11.3.1Indicator category: Tier II. Metadata on SDG Indicator 11.3.1. [online]. Retrieved May 10, 2019, from https://unhabitat.org/wp-content/uploads/2019/04/Metadata-on-SDG-Indicator-11.3.1.pdf
- Viana, C. M., Oliveira, S., Oliveira, S. C., & Rocha, J. (2019). 29 – Land use/land cover change detection and urban sprawl analysis. In H. R. Pourghasemi & C. Gokceoglu (Eds.), Spatial modeling in GIS and R for earth and environmental sciences (pp. 621–651). Elsevier. https://doi.org/10.1016/B978-0-12-815226-3.00029-6.
- Wu, C. (2009). Quantifying high-resolution impervious surfaces using spectral mixture analysis. International Journal of Remote Sensing, 30(11), 2915–2932. https://doi.org/10.1080/01431160802558634