
ABSTRACT
The long-term venting and combustion of offshore associated gas have substantial adverse effects on the ecological environment, so characterizing the global proliferation of offshore gas flaring areas is very important for marine environmental protection and climate change research. However, the use of a single fire/light remote sensing product makes it difficult to conduct long-term observations. In this study, we detected global offshore gas flaring areas during the 27-year interval from 1992 to 2018, using temporal and spatial complementarity of six different remote sensing data products, which are as follows: DMSP-OLS Nighttime Lights; (A)ATSRs; MODIS and VIIRS active fire products; and VIIRS Night Fire and Nighttime Light. Our aim was to achieve more comprehensive extraction results and to analyze a longer time-interval than has been attempted previously. In addition, the resulting map of the global proliferation of offshore gas flaring areas enables their locational and temporal characteristics to be visualized.
1. Introduction
Associated petroleum gas (APG), or associated gas, is natural gas which is present in petroleum deposits and often escapes during crude oil production (CitationAhmed, 2016; CitationBuzcu-Guven & Harriss, 2012; CitationIte & Ibok, 2013; CitationJohn Kearns et al., 2000; CitationRøland, 2008). Most of the associated gas has long been vented and combusted and has become a symbol of oilfield exploitation (CitationAhmed, 2016; CitationChristen, 2004). According to the World Bank Global Gas Flaring Reduction Partnership (GGFR), 141 billion cubic meters (bcm) of natural gas was flared in 2017, and 148 bcm in 2016. The venting and combustion of large amounts of associated gas are not only a source of ocean light pollution and a serious waste of non-renewable resources, but they also represent more than 350 million tons of CO2 emissions per year, which contribute to climate change and are a source of air pollution (CitationAjugwo, 2013; CitationIsmail & Umukoro, 2012; CitationIte et al., 2013; CitationOgri, 2001). Marine oil and gas resources are currently being actively explored and their production expanded on a global scale, which are important for the worldwide development of energy resources given the long-term rising global demand for oil and natural gas and the continuous depletion of onshore oil resources reserves (CitationHall et al., 2003; CitationTeichmann et al., 2011). However, the associated gas flaring on the ocean surface will inevitably alter local temperature and humidity conditions (CitationHansen, Nazarenko et al., 2005; CitationHansen, Sato et al., 2005), contribute to ongoing global climate change, and even interfere with the reproduction of marine organisms (CitationCordes et al., 2016; CitationHansen, 2005). The ocean represents 70% of the Earth’s surface (CitationErickson & Taylor, 1992), and investigating the combustion of marine associated gas on a global scale can promote the management and reuse of the associated gas, which is important for protecting the global climate and the marine environment, therefore contributing to sustainable development.
Several substantial difficulties are associated with the detection of global offshore associated gas flaring areas, including their wide distribution, discrete targets, and interference (e.g. clouds, vessels, biomass burning). Efficient research of the topic relies heavily on the rapid development of satellite remote sensing geodetic observation technology, as an alternative to traditional survey techniques, which has the advantages of large-scale, short-period, high-precision, and low-cost (CitationCohen & Goward, 2004). Recent research has focused on offshore oil/gas platforms and other marine targets using synthetic aperture radar (SAR) images (CitationCasadio, Arino, & Minchella 2012; CitationCheng et al., 2013; CitationJiasheng et al., 2013; CitationLewis, 1998; CitationLiu, Hu, Sun et al., 2018) and satellite-based optical remote sensing images (CitationAnejionu et al., 2014; CitationLiu, Sun, Sun et al., 2016; CitationLiu, Sun, Yang et al., 2016; CitationLiu, Hu, Sun et al., 2018; CitationLiu et al., 2019; CitationXing et al., 2015), although these images make it difficult to detect the combustion of associated gas. However, the remote sensing products of the thermal-infrared sensor or photomultiplier visible sensor provide the possibility of characterizing the combustion of the associated gas on the ocean surface on a large scale, and they can also indirectly reflect the combustion state of oil and gas production within the detection zone. CitationElvidge et al. (2007) and CitationElvidge et al. (2009) used gas flaring characteristics to conduct a global survey of natural gas flaring using the Defense Meteorological Program (DMSP) Operational Line-Scan System (OLS) Nighttime Lights, after its initial use by CitationCroft (1973). CitationElvidge et al. (2015) and CitationElvidge et al. (2018) developed a multispectral pyrometric system (CitationElvidge et al., 2013) to estimate the global flared gas volume, using data collected by the Visible Infrared Imaging Radiometer Suite (VIIRS) onboard the Suomi National Polar Partnership (Suomi-NPP) satellite, which (CitationLiu, Hu, Zhan et al., 2018) also used to build a global industrial inventory, adopting an object-oriented approach. CitationCasadio, Arino, and Serpe (2012) used the (Advanced) Along-Track Scanning Radiometers ((A)ATSRs), constructing ALGO3 algorithm to monitor gas flaring during 1991–2009 on a global scale. CitationGiglio et al. (2006) analyzed the distribution of global active fires using the Moderate Resolution Imaging Spectroradiometer (MODIS) Active Fire products. In addition to the global spatial distribution of gas flaring research described above, other studies have emphasized more localized regional combustion activity (CitationAnejionu et al., 2015; CitationCracknell et al., 1983; CitationCsiszar et al., 2014; CitationFisher & Wooster, 2018; CitationMuirhead & Cracknell, 1984). All of this research has demonstrated that the fire/light-related remote sensing products generated from thermal-infrared sensors or photomultiplier visible sensors are applicable to the global mapping of gas flaring. However, most of the existing global gas flaring studies have only used the data from a single fire/light-related product; moreover, the scope of the studies has included both land and ocean, rather than focusing exclusively on global offshore gas flaring.
The main objective of the present study is to combine six fire/light-related remote sensing data products – DMSP-OLS Nighttime Lights, (A)ATSRs, MODIS Active Fire, VIIRS Active Fire, VIIRS Nightfire and VIIRS Nighttime Lights – in order to cross-validate offshore gas flaring areas and to analyze its dynamics during a longer period (1992–2018) and to provide a more complete global offshore gas flaring database, which has been mapping to better understand the proliferation of global offshore gas flaring areas.
2. Datasets and methods
2.1. Datasets
The high temperature or high brightness characteristics associated with the combustion of natural gas at sea can be captured using thermal-infrared or photomultiplier sensors (CitationAnejionu et al., 2015; CitationElvidge et al., 2015), such as those of the Operational Line-scan System (OLS), the Moderate Resolution Imaging Spectroradiometer (MODIS), and the Visible Infrared Imaging Radiometer Suite (VIIRS). In this study, the following six relevant fire/light products were collected to detect global offshore gas flaring areas: (1) Defense Meteorological Satellite Program (DMSP) OLS Nighttime Lights (NTL) Time Series, downloaded from the National Oceanic and Atmospheric Administration (NOAA) National Geophysical Data Center (https://ngdc.noaa.gov/eog/dmsp/downloadV4composites.html). (2) Along Track Scanning Radiometer (ATSR)-2 and the Advanced ATSR (AATSR), downloaded from the Data User Element of European Space Agency (ESA, http://due.esrin.esa.int/page_wfa.php). (3) MODIS Active Fire product (Collection 6, MCD14ML), which was provided through the Fire Information for Resource Management System (FIRMS, https://firms.modaps.eosdis.nasa.gov/download/). (4) VIIRS Active Fire product (VNP14IMGML), which was also acquired from FIRMS. (5) VIIRS Nightfire product (VNF V2.1), downloaded from the Earth Observation Group (EOG) of NOAA (https://www.ngdc.noaa.gov/eog/viirs/download_viirs_fire.html). (6) VIIRS Nighttime Lights product, which was also acquired from EOG of NOAA (https://www.ngdc.noaa.gov/eog/viirs/download_dnb_composites.html). The datasets involved are detailed in . The time inheritance and global coverage of the data products offer the possibility of conducting time-series analysis of global offshore gas flaring.
Table 1. Details of the datasets used in this study.
2.2. Methods
Offshore gas flaring areas are characterized by high temperature and high brightness compared with the surrounding seawater and can be detected using fire/light-related remote sensing products. However, near-shore industries, volcanoes, marine biomass burning and vessel lights with flaming/bright reaction, as well as the potential uncertainty caused by opaque clouds and the sensors’ resolution and sensitivity, may interfere with the detection of offshore gas flaring areas (CitationLiu, Hu, Sun et al., 2018).
In order to mitigate these potential uncertainties, given the characteristics of high-temperature, high contrast to the background (water), and position-invariance-persistence of offshore gas flaring, two strategies were adopted: (i) Time-series strategy. The offshore gas flaring undetected due to the cloud cover or other reasons in a given phase may be complemented by other observations in favorable observation conditions, over a relatively long period (e.g. one year) (CitationLiu, Sun, Yang et al., 2016; CitationLiu, Hu, Sun et al., 2018; CitationLiu, Hu, Zhan et al., 2018). (ii) Multi-source strategy. We used six types of data product, including the light signals of gas flaring documenting in two nighttime light products and thermal signals with high-temperature (∼1780 K) in four fire products. Time inheritance, spatial superposition and complementarity between the six datasets enable us to determine the dynamics of global offshore gas flaring and can also minimize misassignments and the omission of gas flaring. For fire products, spatial and temporal aggregation are combined for gas flaring extraction, while for nighttime lights products, the relevant attributes are brightness similarity and temporal aggregation. As shown in , the study comprises four main parts: target detection with a single dataset, target detection with multiple datasets, validation, and temporal analysis, which are described in Sections 2.2.1–2.2.4, respectively.
Figure 1. Datasets and processing chain used in this study. More details of Steps 1–4 can be found in Sections 2.2.1–2.2.4, respectively.
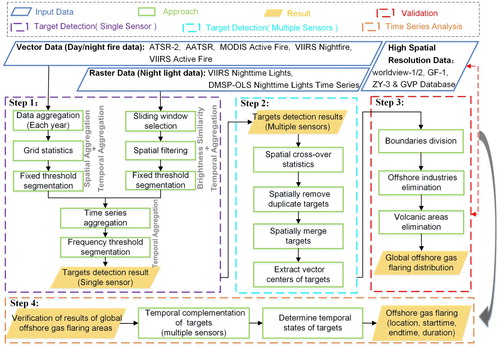
2.2.1. Step 1: target detection with a single dataset
Offshore gas flaring with high-temperature and high-brightness have a continuous fixed position. Consequently, for annual fire products, the thermal anomalies of gas flaring areas are densely distributed within a relatively small range and have higher detection frequency over a long interval. In addition, nighttime light products are more sensitive to detect gas flaring at night, despite their low resolution. Note that the annual and monthly nighttime products used in this study have been filtered to exclude the influence by stray light, lightning, lunar illumination, and cloud-cover (CitationElvidge et al., 2007; CitationElvidge et al., 2009; CitationElvidge et al., 2017).
-
Spatial aggregation. Use of spatial and temporal aggregation for (A)ATSRs, MODIS Active Fire, and the VIIRS Active Fire and Nightfire products. The following procedures were used for the daytime/nighttime thermal anomaly data: (i) Annual data integration. Each dataset was merged at one-year intervals to obtain the annual fire data for each dataset. (ii) Grid statistical analysis. Grid statistical analysis was performed for the annual fire data of each dataset, with different grid statistical units: (A)ATSRs = 1 km, MODIS Active Fire = 1 km, VIIRS Nightfire = 750 m, VIIRS Active Fire = 500 m. In addition, the numbers of thermal anomalies in each grid unit were counted to obtain the raster image of each dataset in each year. (iii) Threshold segmentation. Each raster image was segmented with a fixed threshold. The threshold used in this study is 2, which means that the extracted object was detected at least twice by the same dataset in the same year. Preliminary offshore gas flaring regions of each dataset in each year were then extracted by segmentation. (iv) Raster vectorization. The raster preliminary-objects were converted to vector polygon objects in order to obtain the annual target objects of global offshore gas flaring areas for each dataset in each year.
-
Brightness similarity. The brightness of offshore gas flaring areas is more pronounced than that of the surroundings (i.e. seawater), and their pixel values in the image are higher than those in the vicinity. The combination of brightness similarity and temporal aggregation was used to analyze the DMSP-OLS and VIIRS Nighttime Lights products. Combined with spatial filtering (median filtering) and threshold segmentation (different images correspond to different thresholds), this enables the annual target objects of DMSP OLS and VIIRS Nighttime Light to be extracted. Notably, the VIIRS Nighttime Lights monthly product was synthesized into annual images for statistical analysis.
-
Temporal aggregation. The offshore gas flaring characteristics of position-invariance-persistence can be distinguished from clouds and temporary bright objects (e.g. active volcanoes, vessels and biomass burning). Therefore the utilization of the temporal aggregation characteristics of each extracted object can reduce the interference of cloud cover and occasional bright objects. The target extraction results for all years of a single dataset were aggregated, and the targets with a duration at least two years were then extracted by segmentation. This enabled the acquisition of extraction objects of the global offshore gas flaring based on individual datasets.
2.2.2. Step 2: target detection with multiple datasets
Since different remote sensing datasets have different temporal coverage, the offshore gas flaring undetected by a given data-product may be complemented by other data products. The extraction results of multiple datasets were superimposed in order to merge identical objects and complement different objects. (i) Multi-source datasets cross-validation. On the basis of the target extraction of individual datasets described in Section 2.2.1, in order to achieve complementarity of the extraction objects between the various datasets, the objects extracted from the six datasets were cross-correlated. According to the differences in temporal coverage of the various datasets (), there are only two data products (DMSP-OLS & A(A)TSR) spanning 1992–2000, three data products (DMSP-OLS, A(A)TSR & MODIS Active Fire) spanning 2000–2011, and four data products (MODIS Active Fire, VIIRS Active Fire, Nightfire and Nighttime Lights) spanning 2012–2018. Therefore, an object that can be identified as offshore gas flaring area must be detected by at least one dataset for several consecutive years during 1992–2000, and during 2001–2018 it should be detected by least 2 datasets annual. Thereby, the correspondence between target positions in different datasets is established, which further ensures the credibility of the extracted objects. (ii) Spatial merging and statistics of target objects. The extracted objects of different datasets with overlapping positions were merged into a single object in small units, and statistics were obtained of the final number of all target objects. (iii) Extracting the centroid of objects. Centroid extraction was performed on all final target objects in order to form vector point data, which represent the center positions of the global offshore associated gas flaring.
2.2.3. Step 3: validation
In order to ensure the accuracy of the position of the extracted areas, a number of high-resolution remote sensing images and related databases were used for one-by-one comparison verification. In order to minimize the interference of active volcanoes, volcanic targets were removed from the extracted objects using the database of Global Volcanism Program (GVP). In addition, the extracted objects were verified visually using GF-1, ZY-3, worldview-1/2 and aerial imageries of the National Agriculture Imagery Program (NAIP), and nearshore/island industrial heat sources were excluded. In addition, for objects that were difficult to verify by the above data, the offshore platform inventory compiled by CitationLiu et al. (2019) was used in the verification, since offshore gas flaring always corresponds to the location of oil/gas development platforms. Thus, the distribution of the global offshore gas flaring areas could be determined.
2.2.4. Step 4: temporal analysis
The years of detection objects from all different datasets were enumerated to achieve temporal complementarity. This enabled us to obtain star-year, end-year, and the duration of each offshore gas flaring during 1992–2018. Finally, a database of global offshore gas flaring areas from 1992 to 2018 was built and the main map was produced to show the proliferation of global offshore gas flaring, with the flaring start-year displayed in different grades of color.
3. Results
A total of 1263 offshore gas flaring areas during 1992–2018 (main map) were derived from multi-source satellite products (527 occurred before 1992), and 1021 were still active by 2018 ((a)), with only 242 gas flaring areas were extinguished ((a)), as shown in (b).
Figure 2. Temporal attributes (start-year and end-year) of global offshore gas flaring. (a) Annual new growth of global offshore gas flaring areas and annual number of gas-flaring areas ceasing burning; map (b) shows the spatial distribution of the end-year of global offshore gas flaring.
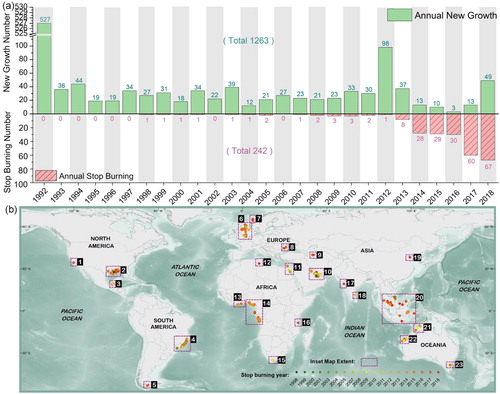
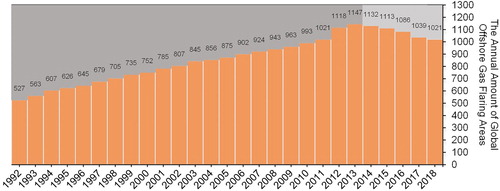
From a temporal perspective (), the number of global offshore gas flaring regions increased during 1992–2013. Apart from the large increase in 2012 (an increase of 97 compared to 2011), the number increased gradually, with an annual growth rate of 11–44/yr, with a peak in 2013. Subsequently, from 2014, the global offshore gas flaring areas declined gradually.
Figure 3. Annual total number of global offshore gas flaring areas from 1992 to 2018.
From a spatial perspective, the location of the offshore gas flaring areas exhibits a tendency to gradually move offshore into the deep sea, as indicated by the dark red marks in the main map; this phenomenon is especially obvious in the case of the northern Gulf of Mexico (main map-3), Brazil (main map-12), North Sea (main map-15), Gulf of Guinea (main map-22), Persian Gulf (main map-31), South China Sea and its surroundings (main map-37), Bohai Sea (main map-38) and Western Australia (main map-43).
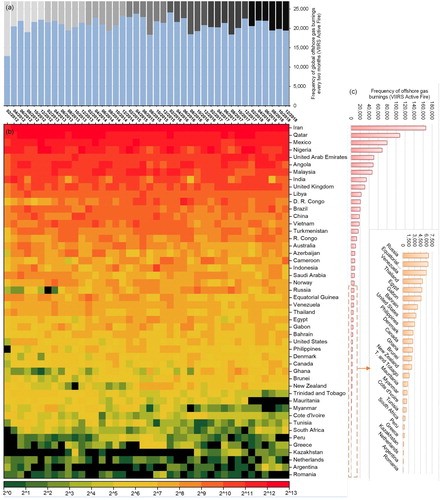
The frequency of offshore gas combustion burnings of 48 countries from the VIIRS Active Fire product during 2012–2018 was analyzed. Reference to (a) indicates a slight reduction in the burning frequency in 2017 and 2018. From a national perspective, in 2018 the 10 countries with the highest frequency of offshore gas burning were: Iran, Qatar, Mexico, Nigeria, the United Arab Emirates, Angola, Malaysia, India, the United Kingdom and Libya ((c)).
Figure 4. Results of statistical analysis of the frequency of offshore gas burning from the VIIRS Active Fire product during 2012–2018. (a) Number of offshore gas burnings every two months; (b) frequency of offshore gas burnings in time series of 48 countries (black indicates 0), with their rankings and total occurrence frequency listed in (c).
4. Conclusions and discussion
The detailed acquisition of offshore gas flaring areas is of great importance for protecting the marine ecological environmental and for the evaluation and control of atmospheric greenhouse gas emissions. For this purpose, we have mapped the global proliferation of offshore gas flaring during 1992–2018, utilizing the characteristics of the high-temperature, high-contrast to the background (water), and position-invariance-persistence for offshore gas flaring, with time-series strategy and multi-source strategy.
The detection of offshore gas flaring areas using multiple fire/light product datasets has the following advantages. First, the dynamics of offshore gas flaring can be analyzed for a longer period due to the temporal complementarity achieved by combining the respective time periods of different datasets. Second, the objects extracted from the six datasets can be merged to obtain more comprehensive detection results, mitigating the problem of low target numbers obtained by a single dataset. However, the large amount of data involved in the use of multiple datasets is a potential shortcoming. In addition, despite time-series strategy and multi-source strategy adopted in this study, cloud cover (especially opaque clouds), the sensors’ different scanning technology and spatial resolution inevitably affect the detection probability of offshore gas flaring (CitationSharma et al., 2017; CitationWang et al., 2020). And the disturbance of South Atlantic magnetic anomaly (SAA), difficult to avoid completely (CitationPolivka et al., 2015), was reduced by high frequency statistics in a fine statistical scale (15 arc seconds) (CitationLiu, Hu, Zhan et al., 2018).
The global proliferation map of offshore gas flaring reveals their distribution and dynamics, and the study provided basic data for estimating offshore carbon emissions and potentially facilitating future studies of the effects of global natural gas combustion on local ocean temperature, humidity and atmospheric pollution.
Software
The maps presented in this paper were organized, managed, processed and analyzed using ArcGIS 10.3 and Python 2.7.8.
Main_Map_revision2.pdf
Download PDF (8.3 MB)Acknowledgements
We thank the ESA, NASA and NOAA for providing (A)ATSRs, MODIS Active Fire, VIIRS Active Fire, VIIRS Nightfire, VIIRS Nighttime Lights and DMSP-OLS Nighttime Lights products.
Disclosure statement
No potential conflict of interest was reported by the author(s).
Additional information
Funding
References
- Ahmed, M. M. (2016). Recovery of natural gas liquids and produce liquified petroleum gas from assosiated natral gas . Sudan University of Science & Technology.
- Ajugwo, A. O. (2013). Negative effects of gas flaring: The Nigerian experience. Journal of Environment Pollution and Human Health , 1 , 6–8. https://doi.org/10.12691/jephh-1-1-2
- Anejionu, O. C. , Blackburn, G. A. , & Whyatt, J. D. (2015). Detecting gas flares and estimating flaring volumes at individual flow stations using MODIS data. Remote Sensing of Environment , 158 , 81–94. https://doi.org/10.1016/j.rse.2014.11.018
- Anejionu, O. C. D. , Blackburn, G. A. , & Whyatt, J. D. (2014). Satellite survey of gas flares: Development and application of a Landsat-based technique in the Niger Delta. International Journal of Remote Sensing , 35 (5), 1900–1925. https://doi.org/10.1080/01431161.2013.879351
- Buzcu-Guven, B. , & Harriss, R. (2012). Extent, impacts and remedies of global gas flaring and venting. Carbon Management , 3 (1), 95–108. https://doi.org/10.4155/cmt.11.81
- Casadio, S. , Arino, O. , & Minchella, A. (2012). Use of ATSR and SAR measurements for the monitoring and characterisation of night-time gas flaring from off-shore platforms: The North Sea test case. Remote Sensing of Environment , 123 , 175–186. https://doi.org/10.1016/j.rse.2012.03.021
- Casadio, S. , Arino, O. , & Serpe, D. (2012). Gas flaring monitoring from space using the ATSR instrument series. Remote Sensing of Environment , 116 , 239–249. https://doi.org/10.1016/j.rse.2010.11.022
- Cheng, L. , Yang, K. , Tong, L. , Liu, Y. , & Li, M. (2013). Invariant triangle-based stationary oil platform detection from multitemporal synthetic aperture radar data. Journal of Applied Remote Sensing , 7 (1), 073537. https://doi.org/10.1117/1.JRS.7.073537
- Christen, K. (2004). Environmental impacts of gas flaring, venting add up. Environmental Science & Technology , 38 (24), 480A–480A. https://doi.org/10.1021/es0406886
- Cohen, W. B. , & Goward, S. N. (2004). Landsat’s role in ecological applications of remote sensing. Bioscience , 54 (6), 535–545. https://doi.org/10.1641/0006-3568(2004)054[0535:LRIEAO]2.0.CO;2
- Cordes, E. E. , Jones, D. O. , Schlacher, T. A. , Amon, D. J. , Bernardino, A. F. , Brooke, S. , Carney, R. , DeLeo, D. M. , Dunlop, K. M. , & Escobar-Briones, E. G. (2016). Environmental impacts of the deep-water oil and gas industry: A review to guide management strategies. Frontiers in Environmental Science , 4 , 58. https://doi.org/10.3389/fenvs.2016.00058
- Cracknell, A. , Muirhead, K. , Callison, R. , & Campbell, N. (1983). Satellite remote sensing, environmental monitoring and the offshore oil and gas industries. ESA Remote Sensing Applied for Environmental Studies , 188 , 163–171. ISSN: 0379-6566
- Croft, T. A. (1973). Burning waste gas in oil fields. Nature , 245 (5425), 375–376. https://doi.org/10.1038/245375a0
- Csiszar, I. , Schroeder, W. , Giglio, L. , Ellicott, E. , Vadrevu, K. P. , Justice, C. O. , & Wind, B. (2014). Active fires from the Suomi NPP visible infrared imaging radiometer suite: Product status and first evaluation results. Journal of Geophysical Research: Atmospheres , 119 (2), 803–816. https://doi.org/10.1002/2013JD020453
- Elvidge, C. D. , Baugh, K. , Zhizhin, M. , Hsu, F. C. , & Ghosh, T. (2017). VIIRS night-time lights. International Journal of Remote Sensing , 38 (21), 5860–5879. https://doi.org/10.1080/01431161.2017.1342050
- Elvidge, C. D. , Bazilian, M. D. , Zhizhin, M. , Ghosh, T. , Baugh, K. , & Hsu, F.-C. (2018). The potential role of natural gas flaring in meeting greenhouse gas mitigation targets. Energy Strategy Reviews , 20 , 156–162. https://doi.org/10.1016/j.esr.2017.12.012
- Elvidge, C. D. , Erwin, E. H. , Baugh, K. E. , Tuttle, B. T. , Howard, A. T. , Pack, D. W. , & Milesi, C. (2007). Satellite data estimate worldwide flared gas volumes. Oil & Gas Journal , 105 (42), 50–58.
- Elvidge, C. D. , Zhizhin, M. , Baugh, K. , Hsu, F.-C. , & Ghosh, T. (2015). Methods for global survey of natural gas flaring from visible infrared imaging radiometer suite data. Energies , 9 (1), 14. https://doi.org/10.3390/en9010014
- Elvidge, C. D. , Zhizhin, M. , Hsu, F.-C. , & Baugh, K. E. (2013). VIIRS nightfire: Satellite pyrometry at night. Remote Sensing , 5 (9), 4423–4449. https://doi.org/10.3390/rs5094423
- Elvidge, C. D. , Ziskin, D. , Baugh, K. E. , Tuttle, B. T. , Ghosh, T. , Pack, D. W. , Erwin, E. H. , & Zhizhin, M. (2009). A fifteen year record of global natural gas flaring derived from satellite data. Energies , 2 (3), 595–622. https://doi.org/10.3390/en20300595
- Erickson, D. J., III ., & Taylor, J. A. (1992). 3-D tropospheric CO modeling: The possible influence of the ocean. Geophysical Research Letters , 19 (19), 1955–1958. https://doi.org/10.1029/92GL01475
- Fisher, D. , & Wooster, M. J. (2018). Shortwave IR adaption of the mid-infrared radiance method of fire radiative power (FRP) retrieval for assessing industrial gas flaring output. Remote Sensing , 10 (2), 305. https://doi.org/10.3390/rs10020305
- Giglio, L. , Csiszar, I. , & Justice, C. O. (2006). Global distribution and seasonality of active fires as observed with the terra and aqua moderate resolution imaging spectroradiometer (MODIS) sensors. Journal of Geophysical Research: Biogeosciences , 111 (G2). https://doi.org/10.1029/2005JG000142
- Hall, C. , Tharakan, P. , Hallock, J. , Cleveland, C. , & Jefferson, M. (2003). Hydrocarbons and the evolution of human culture. Nature , 426 (6964), 318–322. https://doi.org/10.1038/nature02130
- Hansen, J. , Nazarenko, L. , Ruedy, R. , Sato, M. , Willis, J. , Del Genio, A. , Koch, D. , Lacis, A. , Lo, K. , Menon, S. , Novakov, T. , Perlwitz, J. , Russell, G. , Schmidt, G. A. , & Tausnev, N. (2005). Earth’s energy imbalance: Confirmation and implications. Science , 308 (5727), 1431–1435. https://doi.org/10.1126/science.1110252
- Hansen, J. , Sato, M. , Ruedy, R. , Nazarenko, L. , Lacis, A. , Schmidt, G. A. , Russell, G. , Aleinov, I. , Bauer, M. , Bauer, S. , Bell, N. , Cairns, B. , Canuto, V. , Chandler, M. , Cheng, Y. , Del Genio, A. , Faluvegi, G. , Fleming, E. , Friend, A. , … Zhang, S. (2005). Efficacy of climate forcings. Journal of Geophysical Research: Atmospheres , 110 , D18104. https://doi.org/10.1029/2005JD005776
- Hansen, J. E. (2005). A slippery slope: How much global warming constitutes “dangerous anthropogenic interference”? Climatic Change , 68 (3), 269–279. https://doi.org/10.1007/s10584-005-4135-0
- Ismail, O. S. , & Umukoro, G. E. (2012). Global impact of gas flaring. Energy and Power Engineering , 4 (4), 290–302. https://doi.org/10.4236/epe.2012.44039
- Ite, A. E. , & Ibok, U. J. (2013). Gas flaring and venting associated with petroleum exploration and production in the Nigeria’s Niger delta. American Journal of Environmental Protection , 1 (4), 70–77. https://doi.org/10.12691/env-1-4-1
- Ite, A. E. , Ibok, U. J. , Ite, M. U. , & Petters, S. W. (2013). Petroleum exploration and production: Past and present environmental issues in the Nigeria’s Niger delta. American Journal of Environmental Protection , 1 (4), 78–90. https://doi.org/10.12691/env-1-4-2
- Jiasheng, W. , Yongxue, L. , Manchun, L. , Kang, Y. , & Liang, C. (2013). Drilling platform detection based on ENVISAT ASAR remote sensing data: A case of southeastern Vietnam offshore area. Geographical Research , 32 , 2143–2152. https://doi.org/10.11821/dlyj201311015
- John Kearns, K. A. , Shirvill, L. , Garland, E. , Simon, C. , & Monopolis, J. (2000). Flaring and venting in the oil and gas exploration and production industry: An overview of purpose, quantities, issues, practices and trends. International Association of Oil & Gas Producers (OGP) Report 2.79/288.
- Lewis, Anthony J. (1998). Detecting and mapping offshore navigation hazards using synthetic aperture radar data. In IGARSS’98. Sensing and managing the environment. 1998 IEEE international geoscience and remote sensing. Symposium proceedings. (Cat. No. 98CH36174) (Vol. 2, pp. 810–812). IEEE.
- Liu, Y. , Hu, C. , Dong, Y. , Xu, B. , Zhan, W. , & Sun, C. (2019). Geometric accuracy of remote sensing images over oceans: The use of global offshore platforms. Remote Sensing of Environment , 222 , 244–266. https://doi.org/10.1016/j.rse.2019.01.002
- Liu, Y. , Hu, C. , Sun, C. , Zhan, W. , Sun, S. , Xu, B. , & Dong, Y. (2018). Assessment of offshore oil/gas platform status in the northern Gulf of Mexico using multi-source satellite time-series images. Remote Sensing of Environment , 208 , 63–81. https://doi.org/10.1016/j.rse.2018.02.003
- Liu, Y. , Hu, C. , Zhan, W. , Sun, C. , Murch, B. , & Ma, L. (2018). Identifying industrial heat sources using time-series of the VIIRS nightfire product with an object-oriented approach. Remote Sensing of Environment , 204 , 347–365. https://doi.org/10.1016/j.rse.2017.10.019
- Liu, Y. , Sun, C. , Sun, J. , Li, H. , Zhan, W. , Yang, Y. , & Zhang, S. (2016). Satellite data lift the veil on offshore platforms in the South China Sea. Scientific Reports , 6 (1), 33623. https://doi.org/10.1038/srep33623
- Liu, Y. , Sun, C. , Yang, Y. , Zhou, M. , Zhan, W. , & Cheng, W. (2016). Automatic extraction of offshore platforms using time-series landsat-8 operational land imager data. Remote Sensing of Environment , 175 , 73–91. https://doi.org/10.1016/j.rse.2015.12.047
- Muirhead, K. , & Cracknell, A. (1984). Identification of gas flares in the North Sea using satellite data. International Journal of Remote Sensing , 5 (1), 199–212. https://doi.org/10.1080/01431168408948798
- Ogri, O. R. (2001). A review of the Nigerian petroleum industry and the associated environmental problems. The Environmentalist , 21 (1), 11–21. https://doi.org/10.1023/A:1010633903226
- Polivka, T. , Hyer, E. , Wang, J. , & Peterson, D. (2015). First global analysis of saturation artifacts in the VIIRS infrared channels and the effects of sample aggregation. IEEE Geoscience and Remote Sensing Letters , 12 , 1262–1266. https://doi.org/10.1109/LGRS.2015.2392098
- Røland, T. H. (2008). Associated petroleum gas in Russia: Reasons for non-utilization. Policy , 37 , 407–429.
- Sharma, A. , Wang, J. , & Lennartson, E. M. (2017). Inter-comparison of MODIS and VIIRS fire products in Khanty-Mansiysk Russia: Implications for characterizing gas flaring from space. Atmosphere , 8 (12), 95. https://doi.org/10.3390/atmos8060095
- Teichmann, D. , Arlt, W. , Wasserscheid, P. , & Freymann, R. (2011). A future energy supply based on liquid organic hydrogen carriers (LOHC). Energy & Environmental Science , 4 (8), 2767–2773. https://doi.org/10.1039/c1ee01454d
- Wang, J. , Roudini, S. , Hyer, E. J. , Xu, X. , Zhou, M. , Garcia, L. C. , Reide, J. S. , Petersone, D. A. , & da Silva, A. M. (2020). Detecting nighttime fire combustion phase by hybrid application of visible and infrared radiation from Suomi NPP VIIRS. Remote Sensing of Environment , 237 (237), 111466. https://doi.org/10.1016/j.rse.2019.111466
- Xing, Q. , Meng, R. , Lou, M. , Bing, L. , & Liu, X. (2015). Remote sensing of ships and offshore oil platforms and mapping the marine oil spill risk source in the Bohai Sea. Aquatic Procedia , 3 , 127–132. https://doi.org/10.1016/j.aqpro.2015.02.236